Vital Signs: Racial Disparities in Breast Cancer Severity — United States, 2005–2009
Abstract
Background: Breast cancer death rates have been declining among U.S. women since 1990 because of early detection and advances in treatment; however, all racial groups have not benefited equally.
Methods: Breast cancer incidence, stage at diagnosis, and mortality rates for 2005–2009 for women in the United States and for each state were calculated using United States Cancer Statistics (USCS) data. Black to white mortality ratios and mortality to incidence ratios by race were calculated.
Results: Despite having lower incidence rates, black women had a 41% higher breast cancer death rate. More black women were diagnosed at regional or distant cancer stage compared with white women (45% versus 35%). For every 100 breast cancers diagnosed, black women had nine more deaths than white women (27 deaths per 100 breast cancers diagnosed among black women compared with 18 per 100 among white women).
Conclusions: Despite significant progress in breast cancer detection and treatment, black women experience higher death rates even though they have a lower incidence of breast cancer compared to white women.
Implications for Public Health Practice: Advances in screening and treatment have improved survival for U.S. women with breast cancer. However, black women experience inequities in breast cancer screening, follow-up, and treatment after diagnosis, leading to greater mortality. At the individual level, the maximal effectiveness of screening for breast cancer can only be achieved when all women have timely follow-up to breast cancer exams and state-of-the-art treatment. At the health system level, optimal health-care delivery may be strengthened through performance-based reimbursement, expanded use of information technology, and quality assurance reporting-protocols. Proven effective interventions such as patient navigation could be expanded for use in other settings.
Introduction
Breast cancer remains a significant public health challenge. It is the most commonly diagnosed cancer among US women. Although breast cancer deaths have declined over the last 2 decades, it remains the second leading cause of cancer deaths among women (1). It is estimated that approximately half of this decrease has resulted from advances in treatment and early detection (2). However, not all racial groups have benefited equally.
The continuum of breast cancer care begins with regular screening, and continues with timely follow-up and appropriate treatment (3). The maximum benefit of breast cancer screening will only be achieved if women of all racial groups receive not only optimal screening, but also timely follow-up and state-of-the-art treatment. Modeling studies have shown possible differences in mortality at each phase of this process (4).
This report summarizes disparities in breast cancer incidence and mortality between white and black women in the United States, using data from USCS for 2005–2009. USCS includes mortality data from the National Vital Statistics System (NVSS) and incidence data from the National Program of Cancer Registries (NPCR) and the Surveillance, Epidemiology, and End Results (SEER) program.
Methods
Data on new cases of invasive breast cancer diagnosed during 2005–2009 were obtained from population-based cancer registries affiliated with the NPCR and SEER programs, which combined cover all of the US population. Data from all states met the USCS data-quality criteria for 2005–2009.* SEER Summary Stage 2000† was used to characterize cancers as localized, regional, distant, or unknown stage using clinical and pathologic tumor characteristics such as tumor size, depth of invasion and extension to regional or distant tissues, involvement of regional lymph nodes, and distant metastases. Data on breast cancer deaths during 2005–2009 were based on death certificate information reported to state vital statistics offices and compiled into a national file through NVSS. Population estimates for the denominators of incidence and death rates were from the U.S. Census, as modified by SEER.§ Annual breast cancer incidence and mortality rates per 100,000 women were age-adjusted by the direct method to the 2000 U.S. standard population (19 age groups), and corresponding 95% confidence intervals (CIs) were calculated.
To measure disparity in rates, the incidence and mortality rate ratios among black women to those among white women were calculated. The mortality to incidence ratio (MIR) was calculated by dividing the age-adjusted mortality rate by the age-adjusted incidence rate. The MIR represents the number of breast cancer deaths per 100 breast cancers diagnosed and is an indication of prognosis after diagnosis. To ensure stability of rates, statistics were not reported if the numerator had fewer than 16 observations.
Results
During 2005–2009, among women of all races, an average of 205,246 breast cancers were diagnosed each year; 173,970 were in white women, and 21,942 were in black women. Black women had a lower incidence rate (116.9 cases per 100,000) compared with white women (122.1) but a higher percentage of cancers diagnosed at regional or distant stage (45% versus 35%) (Table). In addition, black women had a 41% higher rate of breast cancer mortality (31.6 deaths per 100,000) during 2005–2009 than did white women (22.4 deaths per 100,000) (Figure 1).
Overall in the United States during 2005–2009, the MIR was 0.27 (27 deaths per 100 breast cancers) among black women and 0.18 (18 deaths per 100 breast cancers) among white women. Among the 40 states and District of Columbia with sufficient numbers of deaths for analysis, MIRs for black women showed more variability and were generally higher than those for white women. MIRs were similar among black and white women only in Delaware and Rhode Island (Figure 2).
Conclusions and Comments
Black women experience higher death rates even though they have a lower incidence of breast cancer compared to white women. The disparity in breast cancer death rates among black and white women has been described previously (4). Disparities exist at each phase in the complex breast cancer care trajectory, from screening and follow-up of abnormal findings to treatment initiation and completion (5). Although the causes and magnitude of these disparities are debated, possible solutions have been implemented to help reduce differences in care along the continuum (6).
Although similar rates of mammography use among white and black women have been described using national self-reported data, studies verifying self-report have shown that mammography use might actually be lower among black women (7). One study found that after accounting for overreporting, the prevalence of mammography use decreased from 77% to 65% among white women and from 78% to 59% among black women (7). Black women are more likely to have longer intervals between screening mammograms which might lead to an increase in diagnosis of cancer at a later stage (8). Regular and adequate breast cancer screening can result in detection of breast cancer at an earlier stage and therefore a better prognosis (8,9).
Timeliness of follow-up care after an abnormal screening test is a critical step to optimal outcomes. Extensive delay after an abnormal screening mammogram leads to larger cancers, more positive lymph nodes, and subsequently poorer outcomes (10). Initiation of treatment depends on a definitive diagnosis. Timeliness and adequacy of follow-up varies by socioeconomic, community, and health system characteristics (11). Even among women with similar insurance status, black women have longer intervals to diagnosis after an abnormal mammogram than white women (12,13). For example, 20% of black women had diagnostic intervals over 60 days compared to 12% of white women. (13).
Breast cancer prognosis varies considerably by subtypes. Breast cancer can be subtyped by the expression of the estrogen receptor (ER), progesterone receptor (PR) and human epidermal growth factor receptor 2 (HER2). Women who have ER+ and PR+ breast cancers have more treatment options and a more favorable prognosis than women with tumors lacking ER and PR expression or with triple-negative (ER-, PR-, HER2-) breast cancers (14). Compared with white women, black women more frequently are found to have tumor subtypes with a poorer prognosis, especially the triple negative subtype (14). Models show that differences in breast cancer characteristics contribute to differences in breast cancer mortality between black and white women (4). Further research is needed to determine the etiology of biologic characteristics of breast cancer in black women to design effective prevention and treatment strategies.
Advances in treatment of breast cancer are estimated to be responsible for a quarter of the recent decline in breast cancer deaths (2). However, several studies have reported that black women do not receive the same quality of treatment for breast cancer as white women (15). A recent modeling study showed that up to 19% of the mortality difference between black and white women could be eliminated if the same treatment was provided to both populations (4). Given equal response to chemotherapy, equal treatment of woman based on stage and tumor characteristics should lead to similar outcomes (16). Beginning treatment in a timely way is also important. Fewer black women (69%) start treatment within 30 days compared with white women (82%) (15).
The findings in this report are subject to at least three limitations. First, cause of death was not verified in this study, but lack of verification was not likely to affect the results. A recent CDC study reported that >98% of breast cancer deaths were verified using linkage with the National Death Index (17). Second, the analyses based on race might be biased if race and ethnicity were misclassified; although reports have shown that misclassification is minimal for categorizing by white and black race.¶ Finally, postcensal populations for 2005–2009 were estimated by the U.S. Census Bureau; errors in these estimates might increase as time passes from the original recording of Census data, leading to underestimates or overestimates of incidence and mortality rates.
In the Guide to Community Preventive Services, evidence-based client-directed interventions include group education, one-on-one education, client reminders, reduction of structural barriers, and reduction of out-of-pocket expenses (18). Peer educators and patient navigators serving in underserved communities have a proven track record of assisting women with adherence to breast cancer screening recommendations and with assuring that women with abnormal screening test results obtain appropriate follow-up tests and treatment (19). Observational studies have shown that patient navigation in complex health systems leads to more complete, timely breast cancer care and earlier stage at diagnosis (19). Emerging evidence from randomized controlled trials supports this intervention in high risk populations (6).
Implementation of systematic approaches for tracking screening results and assurance that follow-up and treatment are provided within predetermined intervals have been critical to the success of the National Breast and Cervical Cancer Early Detection Program (NBCCEDP) (13). The program holds providers accountable for reporting performance data and achieving benchmarks for screening women, including time to diagnosis after an abnormal test result and time to treatment (13). A recent report using data from NBCCEDP found improvement in program performance measures, with higher percentages of women completing timely follow-up after abnormal screening test results and initiating treatment (13). The quality of breast cancer screening, follow-up, and treatment initiation among NBCCEDP providers improved through the widespread use of performance-based protocols designed to achieve predetermined program benchmarks (13). Expansion of health information technology through meaningful use of electronic health records is expected to improve quality, safety, and efficiency, leading to improved health outcomes.** Finally, centralized data systems such as population-based screening registries could be used to monitor and assure the quality of screening and timely diagnosis, and treatment of breast cancer (20).
The National Cancer Institute (NCI) sponsors the HMO Cancer Research Network, which provides a health system platform for conducting research on disparities in the delivery of screening and treatment and on interventions to improve access to and increase the effectiveness and efficiency of screening and treatment.†† NCI recently funded a multisite program with the scientific goal of supporting research to better understand how to improve the screening process from recruitment, screening, and diagnosis to referral for treatment of breast, colon, and cervical cancer.§§
At the individual level, the maximal effectiveness of screening for breast cancer can only be achieved when all women have access to timely follow-up testing after abnormal breast cancer exams and state-of-the-art treatment. More research is needed to determine the best screening and treatment strategies for aggressive breast cancers. Optimal health-care delivery can be strengthened through performance-based reimbursement, expanded use of information technology, and quality assurance–reporting protocols. More work also is needed to develop, evaluate, and disseminate additional interventions to decrease inequities in follow-up after an abnormal mammogram and receipt of treatment (6,10).
Reported by
Kathleen A. Cronin, PhD, Surveillance Research Program, National Cancer Institute, Bethesda, Maryland. Lisa C. Richardson, MD, S. Jane Henley, MSPH, Jacqueline W. Miller, MD, Cheryll C. Thomas, MSPH, Arica White, PhD, Marcus Plescia, MD, Div of Cancer Prevention and Control, National Center for Chronic Disease Prevention and Health Promotion, CDC. Corresponding contributor: Lisa C. Richardson, MD, lrichardson@cdc.gov, 770-488-4351.
References
- Eheman C, Henley SJ, Ballard-Barbash R, et al. Annual report to the nation on the status of cancer, 1975–2008, featuring cancers associated with excess weight and lack of sufficient physical activity. Cancer 2012;118:2338–66.
- Berry DA, Cronin KA, Plevritis SK, et al; Cancer Intervention and Surveillance Modeling Network (CISNET) Collaborators. Effect of screening and adjuvant therapy on mortality from breast cancer. N Engl J Med 2005;353:1784–92.
- Zapka JG, Taplin SH, Solberg LI, Manos MM. A framework for improving quality of cancer care: the case of breast and cervical cancer screening. Cancer Epidemiol Biomarkers Prev 2003;12:4–13.
- Van Ravesteyn NT, Schechter CB, Near AM, et al. Race-specific impact of natural history, mammography screening, and adjuvant treatment on breast cancer mortality rates in the United States. Cancer Epidemiol Biomarkers Prev 2011;20:112–22.
- Hewitt M, Simone JV. Ensuring quality cancer care. Washington, DC: Institute of Medicine and National Research Council; 1999.
- Taplin SH, Yabroff KR, Zapka J. A multilevel research perspective on cancer care delivery: the example of follow-up to an abnormal mammogram. Cancer Epidemiol Biomarkers Prev 2012;21:1–7.
- Njai R, Siegel P, Miller J, Liao Y. Misclassification of survey responses and black-white disparity in mammography use, Behavioral Risk Factor Surveillance System, 1995–2006. Prev Chronic Dis 2011;8(3):A59.
- Smith-Bindman R, Miglioretti DL, Lurie N, et al. Does utilization of screening mammography explain racial and ethnic differences in breast cancer? Ann Intern Med 2006;144:541–53.
- Grabler P, Dupuy D, Rai J, Bernstein S, Ansell D. Regular screening mammography before the diagnosis of breast cancer reduces black:white breast cancer differences and modifies negative biological prognostic factors. Breast Cancer Res Treat 2012;135:549–53.
- Olivotto I, Gomi A, Bancej C, et al. Influence of delay to diagnosis on prognostic indicators of screen-detected breast carcinoma. Cancer 2002;94:2143–50.
- Taplin S, Clauser S, Rodgers A, Breslau E, Rayson D. Interfaces across the cancer continuum offer opportunities to improve the process of care. J Natl Cancer Inst Monogr 2010:104–10.
- Jones BA, Dailey A, Calvocoressi L, et al. Inadequate follow-up of abnormal screening mammograms: findings from the race differences in screening mammography process study (United States). Cancer Causes Control 2005;16:809–21.
- Richardson LC, Royalty J, Howe W, Helsel W, Kammerer W, Benard VB. Timeliness of breast cancer diagnosis and initiation of treatment in the National Breast and Cervical Cancer Early Detection Program, 1996–2005. Am J Public Health 2010;100:1769–76.
- Agurs-Collins T, Dunn BK, Browne D, Johnson KA, Lubet R. Epidemiology of health disparities in relation to the biology of estrogen receptor–negative breast cancer. Semin Oncol 2010;37:384–401.
- Lund MJ, Brawley OP, Ward KC, Young JL, Gabram SS, Eley JW. Parity and disparity in first course treatment of invasive breast cancer. Breast Cancer Res Treat 2008;109:545–57.
- Chavez-MacGregor M, Litton J, Chen H, et al. Pathologic complete response in breast cancer patients receiving anthracycline- and taxane-based neoadjuvant chemotherapy. Cancer 2010;116:4168–77.
- German RR, Fink AK, Heron M, et al. The accuracy of cancer mortality statistics based on death certificates in the United States. Cancer Epidemiol 2011;35:126–31.
- CDC. The Guide to Community Preventive Services: increasing breast, cervical, and colorectal cancer screening. Atlanta, GA: US Department of Health and Human Services, CDC; 2012. Additional information available at http://www.thecommunityguide.org/index.html.
- Freeman HP, Rodriguez RL. History and principles of patient navigation. Cancer 2011;117(15 Suppl):3539–42.
- Plescia M, Richardson LC, Joseph D. New roles for public health in cancer screening. CA Cancer J Clin 2012;62:217–9.
* CDC and the National Cancer Institute, in collaboration with the North American Association of Central Cancer Registries, maintain the USCS dataset, which contains the official federal statistics on cancer incidence. Cancer registries demonstrated that cancer incidence data were of high quality by meeting six USCS publication criteria: 1) case ascertainment is ≥90% complete, 2) ≤5% of cases are ascertained solely on the basis of a death certificate, 3) ≤3% of cases are missing information on sex, 4) ≤3% of cases are missing information on age, 5) ≤5% of cases are missing information on race, and 6) ≥97% of the registry's records passed a set of single-field and inter-field computerized edits that test the validity and logic of data components. Additional information available at http://www.cdc.gov/uscs and http://www.cdc.gov/cancer/npcr/uscs/technical_notes/criteria.htm.
† Additional information available at http://seer.cancer.gov/tools/ssm.
§ Population estimates for the period 2005–2009 incorporate bridged single-race estimates that are derived from the original multiple race categories in the 2000 U.S. census. Adjustments to population data were made by the U.S. Census Bureau to account for the Gulf Coast population in Alabama, Mississippi, Louisiana, and Texas displaced by major population shifts resulting from hurricanes Katrina and Rita in 2005. Additional information available at http://seer.cancer.gov/popdata/index.html and http://www.census.gov/popest.
¶ Additional information available at http://www.cdc.gov/cancer/npcr/uscs/technical_notes/interpreting/race.htm.
** Additional information available at http://www.healthit.gov/policy-researchers-implementers/meaningful-use.
†† Additional information available at http://crn.cancer.gov.
§§ Additional information available at http://appliedresearch.cancer.gov/networks/prospr.
|
Key Points |
|
FIGURE 1. Invasive female breast cancer incidence and mortality rates,* by race† — United States, 2005–2009
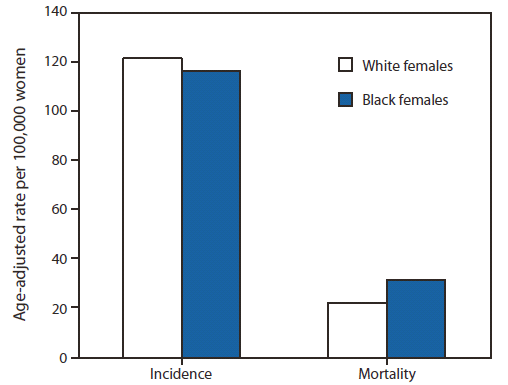
Source: CDC's National Program of Cancer Registries (NPCR), the National Cancer Institute's Surveillance, Epidemiology, and End Results (SEER) program, and National Vital Statistics System mortality data (available at http://www.cdc.gov/nchs/deaths.htm).
* Rates are per 100,000 and age-adjusted to the 2000 U.S. standard population (19 age groups, Census P25–1130).
† The ratio of breast cancer incidence rates among black females compared with breast cancer incidence rates among white females was 0.96. The ratio of breast cancer mortality rates among black females compared with breast cancer mortality rates among white females was 1.41.
Alternate Text: The figure above shows invasive female breast cancer incidence and mortality rates, by race, in the United States during 2005–2009. Black women had a 41% higher rate of breast cancer mortality during 2005–2009 than white women.
FIGURE 2. Breast cancer mortality to incidence ratios* among black and white females — United States, 2005–2009
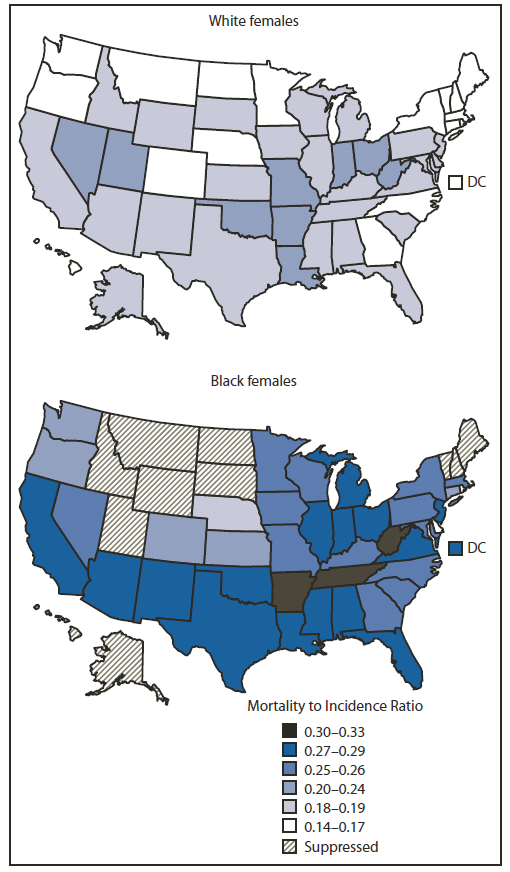
* The mortality to incidence ratio (MIR) was calculated as the age-adjusted mortality rate divided by the age-adjusted incidence rate. The MIR is a population-based measure of fatality/prognosis after diagnosis and can be used to compare groups with disparate incidence or mortality rates. The difference in MIRs can be used as an estimate of excess deaths. An MIR of 0.14 indicates that for every 100 breast cancer cases, 14 breast cancer deaths occurred. Overall, the MIR among black females was 0.27, compared with 0.18 among white females.
Alternate Text: The figure above shows breast cancer mortality to incidence ratios (MIRs) among black and white females in the United States during 2005–2009. Overall in the United States during 2005–2009, the MIR was 0.27 (27 deaths per 100 breast cancers) among black women and 0.18 (18 deaths per 100 breast cancers) among white women. Among the 40 states and District of Columbia with sufficient numbers of deaths for analysis, MIRs for black women showed more variability and were generally higher than MIRs for white women. MIRs were similar among black and white women only in Delaware and Rhode Island.
Use of trade names and commercial sources is for identification only and does not imply endorsement by the U.S. Department of
Health and Human Services. |
All MMWR HTML versions of articles are electronic conversions from typeset documents.
This conversion might result in character translation or format errors in the HTML version.
Users are referred to the electronic PDF version (http://www.cdc.gov/mmwr)
and/or the original MMWR paper copy for printable versions of official text, figures, and tables.
An original paper copy of this issue can be obtained from the Superintendent of Documents, U.S.
Government Printing Office (GPO), Washington, DC 20402-9371;
telephone: (202) 512-1800. Contact GPO for current prices.
**Questions or messages regarding errors in formatting should be addressed to
mmwrq@cdc.gov.
