|
TABLE. Annual percentage change (APC)* in colorectal cancer death and incidence† rates from 2003 to 2007, and percentage of respondents aged 50--75 years with up-to-date screening in 2010, by state/area --- United States |
||||||||
|---|---|---|---|---|---|---|---|---|
|
State/Area |
Mortality |
Incidence |
Screening§ |
|||||
|
APC 2003 to 2007 |
(95% CL) |
APC 2003 to 2007 |
(95% CL) |
% |
(95% CL) |
|||
|
United States |
-3.0 |
(-4.2, -1.7) |
-3.4 |
(-3.7, -3.2) |
65.4 |
(65.0, 65.8) |
||
|
Alabama |
-1.0 |
(-1.3, -0.7) |
-0.7¶ |
(-2.2, 0.8) |
63.4 |
(61.3, 65.4) |
||
|
Alaska |
-1.5 |
(-2.3, -0.8) |
-6.2¶ |
(-17.0, 6.1) |
59.3 |
(55.0, 63.5) |
||
|
Arizona |
-2.0 |
(-2.3, -1.6) |
-6.3 |
(-9.0, -3.4) |
63.4 |
(60.5, 66.3) |
||
|
Arkansas |
-3.0 |
(-4.4, -1.7) |
-3.0 |
(-5.3, -0.6) |
59.4 |
(56.8, 62.0) |
||
|
California |
-2.2 |
(-2.3, -2.1) |
-1.9 |
(-3.4, -0.4) |
64.1 |
(62.7, 65.5) |
||
|
Colorado |
-4.6 |
(-8.6, -0.4) |
-3.9 |
(-7.4, -0.4) |
66.0 |
(64.5, 67.5) |
||
|
Connecticut |
-5.1 |
(-6.3, -3.8) |
-4.7 |
(-7.5, -1.8) |
75.6 |
(73.6, 77.4) |
||
|
Delaware |
-2.1 |
(-2.4, -1.7) |
-1.7¶ |
(-6.4, 3.3) |
71.0 |
(68.5, 73.3) |
||
|
District of Columbia |
-1.6 |
(-1.9, -1.2) |
-5.1¶ |
(-13.6, 4.1) |
70.7 |
(68.2, 73.2) |
||
|
Florida |
-2.9 |
(-3.5, -2.2) |
-4.5 |
(-5.7, -3.3) |
67.3 |
(65.7, 68.9) |
||
|
Georgia |
-3.1 |
(-4.1, -2.1) |
-2.7 |
(-5.1, -0.3) |
67.4 |
(65.2, 69.4) |
||
|
Hawaii |
-1.5 |
(-1.8, -1.1) |
-2.9¶ |
(-6.1, 0.4) |
62.0 |
(59.8, 64.2) |
||
|
Idaho |
-1.9 |
(-2.4, -1.4) |
-3.6 |
(-6.3, -0.8) |
57.0 |
(55.0, 58.9) |
||
|
Illinois |
-2.1 |
(-2.4, -1.9) |
-2.4 |
(-4.0, -0.7) |
59.4 |
(57.0, 61.7) |
||
|
Indiana |
-3.6 |
(-5.4, -1.8) |
-3.6 |
(-4.8, -2.4) |
61.8 |
(60.1, 63.6) |
||
|
Iowa |
-2.8 |
(-3.6, -1.9) |
-3.0 |
(-5.1, -0.9) |
63.8 |
(61.8, 65.7) |
||
|
Kansas |
-1.7 |
(-2.0, -1.4) |
-3.6 |
(-6.4, -0.7) |
63.7 |
(62.1, 65.3) |
||
|
Kentucky |
-1.6 |
(-2.0, -1.3) |
-2.5 |
(-3.5, -1.5) |
62.4 |
(60.2, 64.5) |
||
|
Louisiana |
-4.5 |
(-6.6, -2.3) |
-2.2 |
(-4.1, -0.3) |
60.8 |
(58.9, 62.6) |
||
|
Maine |
-2.5 |
(-2.9, -2.2) |
-4.0 |
(-6.6, -1.4) |
73.7 |
(72.1, 75.2) |
||
|
Maryland |
-3.1 |
(-3.6, -2.7) |
-6.5 |
(-9.0, -4.0) |
72.6 |
(70.8, 74.3) |
||
|
Massachusetts |
-5.3 |
(-7.0, -3.5) |
-6.0 |
(-7.4, -4.7) |
75.8 |
(74.4, 77.2) |
||
|
Michigan |
-2.4 |
(-2.6, -2.1) |
-3.5 |
(-5.6, -1.5) |
70.1 |
(68.5, 71.6) |
||
|
Minnesota |
-2.4 |
(-2.9, -2.0) |
-2.4 |
(-4.0, -0.7) |
70.7 |
(68.7, 72.5) |
||
|
Mississippi |
-0.1¶ |
(-0.4, 0.1) |
-2.1¶ |
(-4.4, 0.3) |
58.2 |
(56.3, 60.0) |
||
|
Missouri |
-3.6 |
(-5.2, -2.0) |
-2.7¶ |
(-5.5, 0.1) |
63.5 |
(61.0, 66.0) |
||
|
Montana |
-1.6 |
(-2.0, -1.3) |
-2.2 |
(-4.3, 0.0) |
58.7 |
(56.8, 60.7) |
||
|
Nebraska |
-1.5 |
(-1.7, -1.3) |
-1.0¶ |
(-4.7, 2.9) |
60.4 |
(58.6, 62.1) |
||
|
Nevada |
-1.1 |
(-1.5, -0.8) |
NS |
NS |
57.7 |
(54.4, 61.0) |
||
|
New Hampshire |
-2.3 |
(-2.7, -2.0) |
-4.6 |
(-8.5, -0.5) |
75.7 |
(73.9, 77.4) |
||
|
New Jersey |
-2.8 |
(-3.0, -2.5) |
-4.0 |
(-6.3, -1.7) |
65.5 |
(63.8, 67.2) |
||
|
New Mexico |
-1.2 |
(-1.5, -0.9) |
-3.6 |
(-6.4, -0.7) |
60.1 |
(58.2, 62.1) |
||
|
New York |
-4.7 |
(-5.7, -3.7) |
-3.8 |
(-5.5, -2.2) |
70.1 |
(68.4, 71.7) |
||
|
North Carolina |
-2.2 |
(-2.7, -1.8) |
-2.4¶ |
(-5.9, 1.1) |
68.9 |
(67.2, 70.5) |
||
|
North Dakota |
-2.3 |
(-3.2, -1.5) |
-1.4¶ |
(-7.5, 5.1) |
58.4 |
(56.3, 60.5) |
||
|
Ohio |
-2.1 |
(-2.3, -1.9) |
-2.7 |
(-4.5, -0.9) |
63.4 |
(61.7, 65.1) |
||
|
Oklahoma |
-1.0 |
(-1.2, -0.8) |
-1.4 |
(-2.4, -0.4) |
54.9 |
(53.1, 56.6) |
||
|
Oregon |
-1.6 |
(-1.9, -1.4) |
-4.3 |
(-6.1, -2.5) |
64.8 |
(62.7, 66.8) |
||
|
Pennsylvania |
-3.4 |
(-4.2, -2.6) |
-2.8 |
(-3.9, -1.7) |
67.0 |
(65.4, 68.6) |
||
|
Rhode Island |
-6.3 |
(-10.3, -2.2) |
-1.9¶ |
(-5.4, 1.7) |
74.7 |
(72.8, 76.4) |
||
|
South Carolina |
-1.9 |
(-2.5, -1.4) |
-5.6 |
(-7.5, -3.6) |
65.1 |
(63.0, 67.2) |
||
|
South Dakota |
-4.3 |
(-7.1, -1.5) |
-3.4¶ |
(-8.0, 1.5) |
64.4 |
(62.4, 66.4) |
||
|
Tennessee |
-1.4 |
(-1.8, -1.1) |
NS |
NS |
61.2 |
(58.8, 63.6) |
||
|
Texas |
-2.5 |
(-2.9, -2.2) |
-2.9 |
(-3.8, -1.9) |
59.9 |
(57.9, 61.7) |
||
|
Utah |
-4.4 |
(-7.1, -1.7) |
-4.8 |
(-8.1, -1.4) |
67.5 |
(65.8, 69.1) |
||
|
Vermont |
-2.2 |
(-2.7, -1.7) |
-3.3¶ |
(-9.8, 3.6) |
71.7 |
(70.0, 73.3) |
||
|
Virginia |
-3.8 |
(-5.2, -2.4) |
-4.5 |
(-6.0, -2.9) |
68.1 |
(65.6, 70.6) |
||
|
Washington |
-3.6 |
(-5.3, -1.8) |
-4.5 |
(-7.0, -1.9) |
72.4 |
(71.3, 73.4) |
||
|
West Virginia |
-3.1 |
(-5.4, -0.7) |
-4.2 |
(-6.6, -1.7) |
54.7 |
(52.3, 57.0) |
||
|
Wisconsin |
-4.4 |
(-6.2, -2.6) |
-6.0 |
(-10.2, -1.6) |
68.9 |
(66.6, 71.2) |
||
|
Wyoming |
-3.3 |
(-5.0, -1.6) |
-2.8¶ |
(-11.0, 6.2) |
57.6 |
(55.7, 59.5) |
||
|
Abbreviation: CL = confidence limits; NS = not shown; state did not meet United States Cancer Statistics (USCS) publication criteria for 2003--2007. Sources: Mortality data are provided by the National Vital Statistics System, covering 100% of the U.S. population. Cancer incidence combines cancer registry data from the National Program of Cancer Registries and the Surveillance, Epidemiology and End Results Program that met USCS publication criteria for 2003--2007, covering 97.2% of the U.S. population. Additional information available at http://www.cdc.gov/uscs. Colorectal cancer screening data are from the 2010 Behavioral Risk Factor Surveillance System (BRFSS) survey. Available at http://www.cdc.gov/brfss. * Calculated using weighted least squares method and joinpoint regression modeling. † Per 100,000 population, age-adjusted to the 2000 U.S. standard population. § Percentage of persons aged 50--75 years who reported receiving a fecal occult blood test within 1 year or a lower endoscopy (i.e., sigmoidoscopy or colonoscopy) within 10 years; age-standardized to the 2010 BRFSS population aged 50--75 years. ¶ The APC was not significantly different from zero (p≥0.05). |
||||||||
Vital Signs: Colorectal Cancer Screening, Incidence, and Mortality --- United States, 2002--2010
Abstract
Background: Screening lowers colorectal cancer (CRC) incidence and mortality. CRC is preventable through the removal of premalignant polyps and is curable if diagnosed early. Increased CRC screening and reduced CRC incidence and mortality are among the Healthy People 2020 objectives.
Methods: CRC screening data are reported using information from 2002--2010 Behavioral Risk Factor Surveillance System surveys. State-specific CRC incidence and mortality data were drawn from the United States Cancer Statistics. Annual percentage changes (APCs) in incidence and death rates from 2003 to 2007 were calculated by state.
Results: From 2002 to 2010, the percentage of persons aged 50--75 years who were adequately screened for colorectal cancer increased from 52.3% to 65.4%. In 2007, CRC incidence ranged from 34.3 per 100,000 population in Utah to 56.9 in North Dakota; death rates ranged from 12.3 per 100,000 in Utah to 21.1 in the District of Columbia (DC). From 2003 to 2007, CRC incidence declined significantly in 35 states, and mortality declined in 49 states and DC, with APCs ranging from 1.0% per year in Alabama to 6.3% per year in Rhode Island.
Conclusions: CRC incidence and mortality have declined in recent years throughout the United States, and CRC screening has increased.
Implications for Public Health Practice: Continued declines in incidence and mortality are expected as past and current public health emphasis on the importance of CRC screening become evident with the increase in screening. To ensure these gains continue, CRC screening should be accessible and used as recommended by all eligible persons in the United States.
Introduction
Colorectal cancer (CRC) is the second most commonly diagnosed cancer and the second leading cause of cancer mortality in the United States among cancers that affect both men and women (1). Strong evidence indicates that screening for CRC reduces the incidence of and mortality from the disease (2). Screening tests for CRC, including fecal occult blood testing (FOBT), sigmoidoscopy, and colonoscopy, used at appropriate intervals, reduce incidence and mortality through prevention (identification and removal of premalignant polyps) and early detection (2). Since 1996, the United States Preventive Services Task Force (USPSTF) and other organizations have recommended CRC screening for persons aged ≥50 years. In 2008, updated guidelines from USPSTF recommended that routine screening continue only until age 75 years, based on review of the risks and benefits of screening (2). Despite the evidence linking CRC screening to lower incidence and mortality, a significant number of age-eligible persons in the United States have not received potentially life-saving screening.
Healthy People 2020 (HP 2020) objectives call for reducing the incidence of CRC to 38.6 per 100,000 population, reducing the death rate to 14.5 per 100,000 population, and increasing the prevalence of CRC screening to 70.5% (3). This report updates CRC screening prevalence data with data from the 2010 Behavioral Risk Factor Surveillance System (BRFSS) survey and presents state-specific data for CRC incidence and death rates for 2007 and annual percentage changes from 2003 to 2007.
Methods
BRFSS is a state-based, random--digit-dialed telephone survey of the civilian, noninstitutionalized adult population that collects information on health risk behaviors, preventive health practices, and health-care access in the United States (4). Survey data were available for all 50 states (except for Hawaii in 2004) and the District of Columbia (DC). For 2010, the median Council of American Survey and Research Organizations (CASRO) response rate for BRFSS was 54.6%, and the median cooperation rate was 76.9% (4).
During 2002--2010, every 2 years, respondents aged ≥50 years were asked whether they have ever used a "special kit at home to determine whether the stool contains blood (fecal occult blood test [FOBT])," whether they have ever had a "tube inserted into the rectum to view the colon for signs of cancer or other health problems (sigmoidoscopy or colonoscopy)," and when these tests were last performed. CDC calculated the percentage of adults who reported having had an FOBT within the past year or lower endoscopy (i.e., sigmoidoscopy or colonoscopy) within the preceding 10 years, enabling comparison with previous reports (5). This analysis is restricted to persons aged 50--75 years, in accordance with the USPSTF recommended age range for screening (2). Respondents who refused to answer, had a missing answer, or who answered "don't know/not sure" were excluded from the analysis. Data were weighted to the age, sex, and racial/ethnic distribution of each state's adult population using intercensal estimates and were age-standardized to the 2010 BRFSS population.
United States Cancer Statistics (USCS) (1) provides official federal statistics on cancer incidence (newly diagnosed cases) and cancer deaths in each state, using data from the National Program of Cancer Registries (NPCR) and/or the Surveillance, Epidemiology, and End Results (SEER) Program and from the National Vital Statistics System. In 2007, the most recent year for which incidence data were available, 49 states and DC met USCS data criteria representing 99.2% of the U.S. population. Incidence trend analyses included new cases of colorectal cancer diagnosed during 2003--2007 from NPCR/SEER registries that met USCS criteria for every year of the study period; 48 states and DC, representing 97.2% of the U.S. population, were included. Incident colorectal cancers were coded according to the International Classification of Disease for Oncology, Third Edition (ICD-O-3).
Cancer mortality statistics are based on information from all death certificates filed in the 50 states and DC and therefore cover 100% of the U.S. population. All reported deaths with CRC identified as the underlying cause of death according to the International Classification of Diseases, Tenth Revision (ICD-10) during 2003--2007 were included in this analysis. For trends in incidence and mortality, annual percentage changes (APCs) are reported, using the weighted least squares method and the joinpoint regression program. Population estimates for the denominators of incidence and death rates were from the U.S. Census, as modified by SEER (1). Data were age-adjusted to the 2000 U.S. standard population by the direct method; corresponding 95% confidence limits (CLs) were calculated as modified gamma intervals (6). Rates and APCs are shown for all races/ethnicities, and all age groups combined for each state.
Results
The 2010 BRFSS survey was administered to 236,186 persons aged 50--75 years. In this population, the overall age-adjusted combined CRC screening (FOBT and lower endoscopy) increased from 52.3% in 2002 to 65.4% in 2010 (Table, Figure 1). From 2002 to 2010, FOBT use declined from 21.1% to 11.8%.
During 2003--2007, a total of 722,542 CRC cases were reported in the United States. Overall age-adjusted CRC incidence rates decreased from 52.3 per 100,000 in 2003 to 45.5 per 100,000 in 2007 (an APC of 3.4% per year), representing 65,994 fewer new cases of cancer than expected during this period (2003--2007) compared with 2002. In 2007, North Dakota reported the highest CRC incidence (56.9 per 100,000) and Utah reported the lowest (34.3) (Figure 2). CRC incidence rates decreased significantly in 35 states from 2003 to 2007, with Maryland reporting the largest percentage decrease in CRC incidence (6.5% per year) (Table).
During 2003--2007, a total of 268,783 CRC deaths were reported in the United States. The overall age-adjusted CRC death rate decreased from 19.0 per 100,000 in 2003 to 16.7 per 100,000 in 2007 (an APC of 3.0% per year), representing 31,800 fewer deaths than expected during this period (2003--2007) compared with 2002. In 2007, DC reported the highest CRC mortality (21.1 per 100,000), and Colorado and Montana reported the lowest (14.1 per 100,000) (Figure 2). CRC mortality rates decreased significantly in 49 states and DC from 2003-2007, with Rhode Island reporting the largest decrease in CRC mortality (6.3% per year).
Conclusion and Comments
CRC incidence decreased by 3.4% per year, and the CRC death rate decreased by 3.0% per year from 2003 to 2007 in the United States. These decreases in CRC incidence and mortality represent approximately 66,000 fewer new cases and 32,000 fewer deaths than expected from 2003 to 2007, compared with 2002. A total of 35 states had significant decreases in CRC incidence. Forty-nine states and DC experienced a statistically significant decrease in CRC mortality, with the largest declines occurring in states with some of the highest screening prevalence. Approximately 50% of the improvement in mortality can be attributed to increased screening, with 35% attributed to reductions in risk factors such as smoking and obesity, and 12% to improved CRC treatment (7). For incidence, CRC screening and changes in risk factors each accounted for 50% of the decline (7).
The decreases in CRC incidence and mortality from 2003 to 2007 were part of a larger U.S. trend from 1975 to 2007 (Figure 3). According to SEER statistics, beginning in 1975, CRC incidence increased from 59.5 per 100,000 population to 66.3 in 1985, before declining steadily to 44.7 in 2007. The CRC death rate declined from 28.6 in 1976 to 16.7 in 2007 (http://seer.cancer.gov/csr/1975_2007/index.html). However, CRC incidence and death rates overall remained above the HP 2020 targets of 38.6 per 100,000 and 14.5 per 100,000, respectively (Figure 3).
The prevalence of being up-to-date with CRC screening improved with 65.4% reporting being screened at recommended intervals (2). This represents a substantial improvement in the past decade; only 40.9% of U.S. residents reported CRC screening in 1997 (8). Endoscopy is currently the predominant screening modality in the United States; 61.8% of U.S. residents aged 50--75 years reported lower endoscopy within the past 10 years. A recent report estimated that, in 2005, colonoscopy use prevented an estimated 7,000 CRC deaths, but an additional 14,000 CRC deaths could have been prevented that year if more persons had undergone colonoscopy (9). If the HP 2020 target for CRC screening (70.5%) is met, almost 1,000 additional deaths will be averted per year (10).
More than one third of respondents reported not being up-to-date with screening. A recent review of predictors of CRC screening found that physician recommendation continues to be a major facilitator of screening and a barrier when no recommendation is made (11). Lack of knowledge about CRC screening, lack of health insurance, lower income and education, and being from a racial or ethnic minority group were additional barriers to screening (11). A survey of U.S. and Canada residents regarding their preference for CRC screening reported that 31% of survey respondents in the United States would choose not to be screened for CRC even when their preferred screening test was offered (12). Given provider influence on patients' use of CRC screening, this appears to provide an opportunity to recommend screening to eligible patients.
The medical and societal costs of CRC are substantial. Estimated direct medical costs for CRC care in 2010 were $14 billion, with projected costs of up to $20 billion by 2020 (13). In 2006, estimated lost productivity costs for persons who died from CRC were $15.3 billion (14). This equals $288,468 of lost productivity per CRC death in 2006 (14). Screening costs per person vary by test. The lifetime (age 50--80 years) average per person cost of screening ranges from $71 per person for guaiac-based FOBT to $1,397 per person for colonoscopy (15).
CDC established the Colorectal Cancer Control Program in 2009, funding a total of 22 states and four tribal organizations to promote CRC screening and increase population-level screening rates to 80% and, subsequently, to reduce CRC incidence and mortality. In 2010, three additional states were funded, bringing the total number of grantees to 29. Grantees work through partnership with state and local organizations, Federally Qualified Health Centers, and other health-care systems that will be critical to effect population-level change. Many of the program strategies draw from the Community Guide to Preventive Services, which has identified evidence-based interventions to increase cancer screening in communities by targeting providers and the general population (available at http://www.thecommunityguide.org/index.html.)
Implementation of the Affordable Care Act is expected to remove financial barriers to CRC screening. However, additional effort will be needed to improve population-based screening and outcomes. Targeting systems-level changes and providers might be an effective method to improve CRC screening and follow-up in health-care systems. For example, from 2005 to 2009, Kaiser Northern California doubled its up-to-date CRC screening from 35% to 69% among commercially insured enrollees and increased screening for Medicare enrollees from 46% to 75% (16) by implementing a highly organized screening program based on evidence-based recommendations from the Community Guide. These strategies also have been effective at the community-level to improve CRC screening (17). State health departments should build on existing infrastructure and seek opportunities to develop highly-organized screening service delivery systems and enhance assurance of screening service delivery. State health departments could work with Medicaid to institute policies that facilitate systematic screening programs for the Medicaid population and design systems that allow linkage of Medicaid enrollee data to other datasets, if such linkages are allowed by the state or jurisdiction. This would enable identification and active recruitment for screening, and develop program registries to monitor participation, diagnostic follow-up, treatment initiation and long-term outcomes.
The findings in this report are subject to at least four limitations. First, because BRFSS is administered by telephone, only adults living in households with landline telephones are represented; therefore, the results might not be representative of the entire U.S. population. Adults living in wireless-only households tend to be younger, to have lower incomes, and to be members of minority populations, which might result in overestimates (18). Second, responses are self-reported and not confirmed by review of medical records. Third, the survey response rate was relatively low and variable among states. Fourth, the percentages of adults who reported having had an FOBT in the past year and/or lower endoscopy within the preceding 10 years are presented to enable comparison with previous reports. However, USPSTF states that modeling evidence suggests CRC screening using any of the following three regimens will be approximately equally effective in life-years gained: 1) annual FOBT, 2) sigmoidoscopy every 5 years combined with FOBT every 3 years, or 3) colonoscopy at intervals of 10 years (2).
Recent significant improvements in CRC screening in the United States have contributed to reductions in incidence and death rates, but HP 2020 targets have not yet been reached. Adherence to recommended CRC screening recommendations will prevent more CRC cases and deaths.
Reported by
Lisa C. Richardson, MD, Eric Tai, MD, Sun Hee Rim, MPH, Djenaba Joseph, MD, Marcus Plescia, MD. Div of Cancer Prevention and Control, National Center for Chronic Disease Prevention and Health Promotion. Corresponding contributor: Lisa C. Richardson, lrichardson@cdc.gov; 770-488-4351.
References
- US Cancer Statistics Working Group. United States Cancer Statistics (USCS): 1999--2007 incidence and mortality data. Atlanta, GA: U.S. Department of Health and Human Services, CDC, National Cancer Institute; 2010. Available at http://www.cdc.gov/uscs. Accessed June 7, 2011.
- US Preventive Services Task Force. Screening for colorectal cancer. Rockville, MD: Agency for Healthcare Research and Quality; 2008. Available at http://www.uspreventiveservicestaskforce.org/uspstf/uspscolo.htm. Accessed June 7, 2011.
- US Department of Health and Human Services. Healthy people 2020. Available at http://www.healthypeople.gov/2020/topicsobjectives2020/default.aspx. Accessed June 7, 2011.
- CDC. Behavioral Risk Factor Surveillance System. Atlanta, GA: US Department of Health and Human Services, CDC; 2010. Available at http://www.cdc.gov/brfss. Accessed June 7, 2011.
- CDC. Vital signs: colorectal cancer screening among adults aged 50--75 years---United States, 2008. MMWR 2010;59:808--12.
- Tiwari RC, Clegg LX, Zou Z. Efficient interval estimation of age-adjusted cancer rates. Stat Methods Med Res 2006;15:547--69.
- Edwards BK, Ward E, Kohler BA, et al. Annual report to the nation on the status of cancer, 1975--2006, featuring colorectal cancer trends and impact of interventions (risk factors, screening, and treatment) to reduce future rates. Cancer 2010;116:544--73.
- CDC. Screening for colorectal cancer---United States, 1997. MMWR 1999;48:116--21.
- Stock C, Knudsen AB, Lansdorp-Vogelaar I, Haug U, Brenner H. Colorectal cancer mortality prevented by use and attributable to nonuse of colonoscopy. Gastrointest Endosc 2011;73:435--43.e5.
- Farley TA, Dalal MA, Mostashari F, Frieden TR. Deaths preventable in the U.S. by improvements in use of clinical preventive services. Am J Prev Med 2010;38:600--9.
- Beydoun HA, Beydoun MA. Predictors of colorectal cancer screening behaviors among average-risk older adults in the United States. Cancer Causes Control 2008;19:339--59.
- Marshall DA, Johnson FR, Kulin NA, et al. How do physician assessments of patient preferences for colorectal cancer screening tests differ from actual preferences? A comparison in Canada and the United States using a stated-choice survey. Health Econ 2009;18:1420--39.
- Mariotto AB, Yabroff KR, Shao Y, Feuer EJ, Brown ML. Projections of the cost of cancer care in the United States: 2010--2020. J Natl Cancer Inst 2011;103:117--28.
- Ekwueme DU, Guy GP, Li C, Rim SH, Parelkar P, Chen SC. The health burden and economic costs of cutaneous melanoma mortality by race/ethnicity--United States, 2000--2006. J Am Acad Derm. In press.
- Lansdorp-Vogelaar I, van Ballegooijen M, Zauber AG, Habbema JD, Kuipers EJ. Effect of rising chemotherapy costs on the cost savings of colorectal cancer screening. J Natl Cancer Inst 2009;101:1412--22.
- Agency for Healthcare Research and Quality. Integrated system nearly doubles colorectal cancer screening rate through distribution of inhome kit and followup with nonresponders. Rockville, MD: US Department of Health and Human Services, Agency for Healthcare Research and Quality; 2010. Available at http://innovations.ahrq.gov/content.aspx?id=2900. Accessed June 7, 2011.
- Lebwohl B, Neugut AI, Stavsky E, et al. Effect of a patient navigator program on the volume and quality of colonoscopy. J Clin Gastroenterol 2011;45:e47--53.
- Blumberg SJ, Luke JV, Ganesh N, Davern ME, Boudreaux MH, Soderberg K. Wireless substitution: state-level estimates from the National Health Interview Survey, January 2007--June 2010. Natl Health Stat Report 2011;(39):1--26.
|
Key Points |
|
FIGURE 1. Percentage of respondents aged 50--75 years who reported receiving a fecal occult blood test (FOBT) within 1 year and/or a lower endoscopy* within 10 years and Healthy People 2020 (HP 2020) target --- Behavioral Risk Factor Surveillance System (BRFSS) surveys, United States, 2002, 2004, 2006, 2008, and 2010†
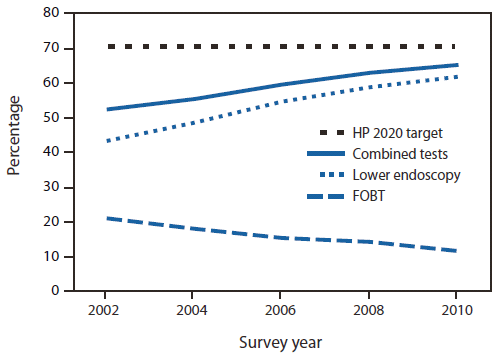
* Sigmoidoscopy or colonoscopy.
† Age-standardized to the population aged 50--75 years in the 2010 BRFSS survey.
Alternate Text: The figure above shows the percentage of respondents aged 50–75 years who reported receiving a fecal occult blood test (FOBT) within 1 year and/or a lower endoscopy within 10 years and the Healthy People 2020 target for testing
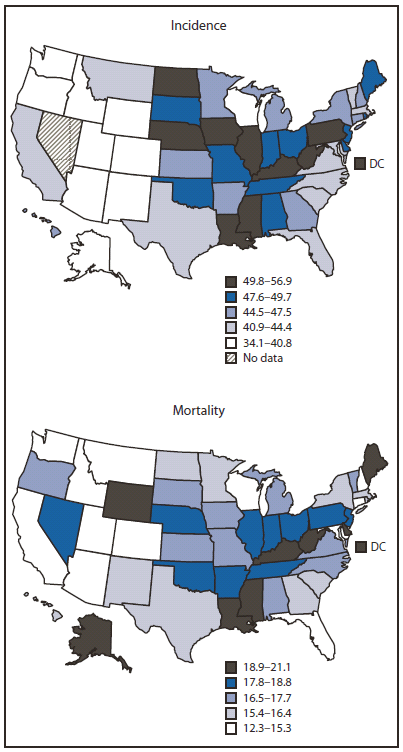
Sources: Cancer incidence combines cancer registry data from the National Program of Cancer Registries and the Surveillance, Epidemiology, and End Results Program that meet United States Cancer Statistics publication criteria for 2007, covering 99.2% of the U.S. population. Additional information available at http://www.cdc.gov/uscs.
Mortality data are provided by the National Vital Statistics System, covering 100% of the U.S. population.
* Per 100,000 population, age-adjusted to the 2000 U.S. standard population.
Alternate Text: The figure above shows colorectal cancer (CRC) incidence and death rates per 100,000 population, by state in 2007. North Dakota reported the highest CRC incidence (56.9 per 100,000) and Utah reported the lowest (34.3). The District of Columbia DC reported the highest CRC mortality (21.1 per 100,000), and Colorado and Montana reported the lowest (14.1).
FIGURE 3. Age-adjusted colorectal cancer incidence and death rates* and Healthy People 2020 (HP 2020) targets --- United States,1975--2007
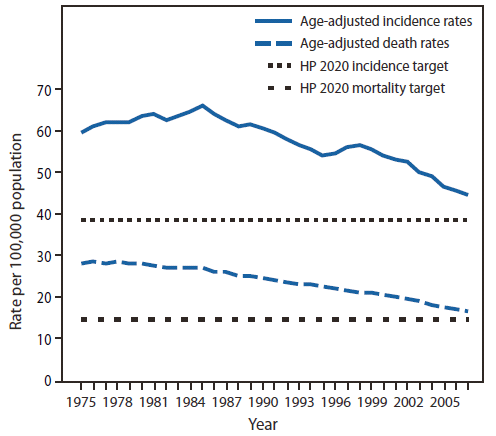
Sources: Incidence data are provided from nine areas (San Francisco, Connecticut, Detroit, Hawaii, Iowa, New Mexico, Seattle, Utah, and Atlanta) of the Surveillance, Epidemiology, and End Results (SEER) Program. Additional information available at http://seer.cancer.gov.
Mortality data are provided by U.S. Mortality Files of the National Vital Statistics System.
* Per 100,000 population, age-adjusted to the 2000 U.S. standard population.
Alternate Text: The figure above shows declines in colorectal cancer (CRC) incidence from 59.5 per 100,000 population in 1975 to 44.7 in 2007 and in the CRC death rate from 28.6 per 100,000 population in 1976 to 16.7 in 2007 and the corresponding Healthy People 2020 targets of 38.6 per 100,000 and 14.5, respectively.
Use of trade names and commercial sources is for identification only and does not imply endorsement by the U.S. Department of
Health and Human Services. |
All MMWR HTML versions of articles are electronic conversions from typeset documents.
This conversion might result in character translation or format errors in the HTML version.
Users are referred to the electronic PDF version (http://www.cdc.gov/mmwr)
and/or the original MMWR paper copy for printable versions of official text, figures, and tables.
An original paper copy of this issue can be obtained from the Superintendent of Documents, U.S.
Government Printing Office (GPO), Washington, DC 20402-9371;
telephone: (202) 512-1800. Contact GPO for current prices.
**Questions or messages regarding errors in formatting should be addressed to
mmwrq@cdc.gov.
