|
Key Points |
|
Vital Signs: Nonfatal, Motor Vehicle--Occupant Injuries (2009) and Seat Belt Use (2008) Among Adults --- United States
ABSTRACT
Background: Motor vehicle crashes are the leading cause of death in the United States among persons aged 5--34 years. Seat belts have been shown to be the most effective method for reducing injuries among adults in the event of a crash.
Methods: CDC used 2009 data from the National Electronic Injury Surveillance System--All Injury Program (NEISS-AIP) to provide U.S. estimates of the number and rate of nonfatal, motor vehicle--occupant injuries treated in emergency departments among adults aged ≥18 years. In addition, CDC used 2008 data from the Behavioral Risk Factor Surveillance System (BRFSS) to estimate the prevalence of self-reported seat belt use among adults in the United States. Seat belt use was examined further by type of state seat belt enforcement law.
Results: In 2009 in the United States, an estimated 2.3 million adult motor vehicle--occupants had nonfatal injuries treated in emergency departments. The nonfatal, motor vehicle--occupant injury rate declined 15.6% from 1,193.8 per 100,000 population in 2001 to 1,007.5 per 100,000 population in 2009. In 2008, self-reported seat belt use was higher in states with primary enforcement laws (88.2%), compared with states with secondary enforcement laws (79.2%). If the secondary law states had achieved 88.2% seat belt use in 2008, an additional 7.3 million adults would have been belted. From 2002 to 2008, self-reported seat belt use increased overall from 80.5% to 85.0%.
Conclusions: Nonfatal, motor vehicle--occupant injuries treated in emergency departments have declined in recent years but still affect a substantial proportion of the adult U.S. population each year. Self-reported belt use increased from 2002 to 2008, and was higher in states with primary enforcement laws compared with states with secondary enforcement laws.
Implications for Public Health Practice: Seat belt use is a proven method to reduce motor vehicle--occupant injuries, and the results of this analysis demonstrate that states with primary enforcement laws have higher prevalence of self-reported seat belt use. To help reduce the number of motor vehicle--occupant injuries, 19 states without primary enforcement laws should consider enacting them.
Introduction
In addition to being the leading cause of death among U.S. residents aged 5--34 years, motor vehicle--occupant injuries account for approximately 15% of all nonfatal injuries treated in U.S. emergency departments (1). In 2005, the lifetime costs of fatal and nonfatal motor vehicle--occupant injuries were estimated at approximately $70 billion, including costs for medical care, treatment, rehabilitation, and lost productivity (2). Motor vehicles account for approximately 90% of all trips taken in the United States, and the vast majority of persons killed and injured while traveling are occupants of motor vehicles (3). Seat belts, which reduce the risk for fatal injuries from motor vehicle crashes by approximately 45% and serious injuries by approximately 50% (4), are the most effective intervention for protecting motor vehicle occupants (5). Primary seat belt enforcement laws and enhanced enforcement of such laws have been shown to increase the use of seat belts and reduce death rates (6).
For this report, CDC used 2009 data from NEISS-AIP to provide estimates of the number and rate of nonfatal, motor vehicle--occupant injuries treated in emergency departments among adults aged ≥18 years. CDC also used 2008 BRFSS to analyze state-level information regarding self-reported seat belt use. In addition, trends in motor vehicle--occupant injuries and seat belt use were examined over time.
Methods
NEISS-AIP is a collaborative effort of CDC and the Consumer Product Safety Commission, and an extension of the National Electronic Injury Surveillance System (NEISS), which collects detailed data abstracted from medical records of initial emergency department visits for all types and causes of nonfatal injuries and poisonings treated in the United States. NEISS-AIP data are a nationally representative, stratified probability sample taken annually from approximately 66 hospitals with at least six beds and 24-hour emergency department services.
NEISS-AIP data were accessed via CDC's Web-based Injury Statistics Query and Reporting System (WISQARS) online database, which provides customized reports of injury data (1). Motor vehicle--occupant injuries among adults aged ≥18 years were examined for the period 2001--2009. Nonfatal injury rates were calculated for adult motor vehicle occupants by age group and sex. Bridged race postcensal population estimates from the U.S. Census Bureau were used to calculate injury rates. All injury rates were age-adjusted to the 2000 standard U.S. population. A weighted linear regression was used to analyze the trend in occupant injury rates over time.
BRFSS is an ongoing, state-based, random-digit--dialed telephone survey that collects self-reported data on health-related behaviors and conditions. Data are collected from noninstitutionalized, civilian adults aged ≥18 years in all 50 states, the District of Columbia (DC), and three territories (Guam, Puerto Rico, and U.S. Virgin Islands). In 2008, the median Council of American Survey Research Organizations (CASRO) response rate among states was 53%.
One question on seat belt use is included periodically on the BRFSS survey of each state. Participants are asked "How often do you use seat belts when you drive or ride in a car? Would you say: always, nearly always, sometimes, seldom, never, or don't know?" For this analysis, only those who responded "always" were categorized as seat belt users. Data were examined for the most recent years available: 2002, 2006, and 2008. The prevalence of always wearing seat belts in 2008 was stratified by type of state seat belt enforcement law (primary or secondary) and reported by sex, age group, race/ethnicity, education level, household income, and residential area. Primary enforcement laws allow police officers to stop drivers and issue tickets solely because occupants are unbelted. Secondary enforcement laws only allow police officers to issue tickets for seat belt violations if drivers have been stopped for violating some other law. In 2008, 26 states, DC, and the three territories had primary laws, 23 states had secondary laws, and one state (New Hampshire) had no seat belt law (7).* For this analysis, New Hampshire was grouped with the secondary law states. The t-test was used to determine the trend in seat belt use during 2002--2008.
Results
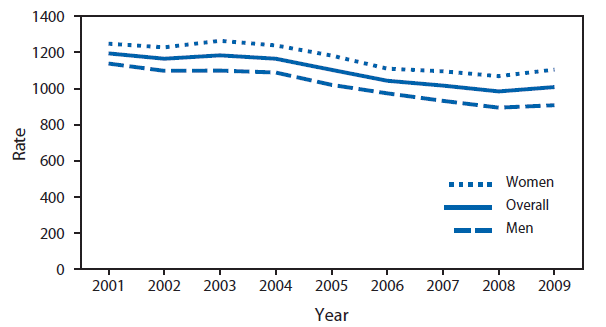
In 2009, an estimated 2,317,000 nonfatal, motor vehicle--occupant injuries occurred among adults in the United States. The motor vehicle--occupant age-adjusted injury rate was highest among persons aged 18--24 years (1,939.2 per 100,000 population), followed by persons aged 25--34 years (1,322.4) (Table 1). From 2001 to 2009, the injury rate declined 15.6% (p<0.001) from 1,193.8 injuries per 100,000 population to 1,007.5 (Figure); this decline represents an estimated 231,000 fewer injuries in 2009 compared with 2001. During the same period, the injury rate also declined for men, from 1,137.5 per 100,000 population in 2001 to 906.6 in 2009 (p<0.001) and for women, from 1,246.9 in 2001 to 1,104.2 in 2009 (p<0.001).
In 2008, the overall prevalence of self-reported seat belt use in the United States was 85.0%, a 5.6% increase from 80.5% in 2002 (p<0.001). Significant increases in seat belt use from 2002 were observed both in states with primary enforcement laws (p<0.001) and states with secondary enforcement laws (p<0.001). In 2008, among states, self-reported seat belt use ranged from 59.2% (North Dakota) to 93.7% (Oregon) (Table 2). In 2008, seven states and territories had ≥90% prevalence of seat belt use (Table 2). After Oregon, the highest prevalence of self-reported seat belt use was in California (93.2%), Washington (92.0%), Hawaii (91.4%), Texas (91.1%), Puerto Rico (91.1%), and New Jersey (90.3%) (Table 2). Overall, the prevalence of self-reported seat belt use in states with primary enforcement laws was 88.2%, compared with 79.2% for states with secondary enforcement laws (Table 2). If the states with secondary laws had achieved 88.2% seat belt use in 2008, an additional 7,345,000 adults would have been belted. Although the states with secondary laws represented 35% of the total U.S. adult population, 49% of unbelted adults lived in these states.
Persons in certain sociodemographic categories were less likely to report seat belt use than others, such as men (compared with women), persons aged 18--24 years (compared with all other age groups), residents of rural areas (compared with urban or suburban areas), and whites, blacks, and American Indian/Alaska Natives (compared with Hispanics or Asians/Hawaiian or Pacific Islanders) (Table 3). However, for every sociodemographic category examined, prevalence of self-reported seat belt use was higher among residents of states with primary enforcement laws, compared with residents of states with secondary enforcement laws (Table 3).
Conclusions and Comment
Self-reported seat belt use has continued to increase, reaching a high of 85.0% in 2008, until it is now the social norm among residents of the United States. In contrast, in 1982, only 11% of U.S. residents reported seat belt use (8), and the first state law mandating seat belt use was not passed until 1984. Despite the upward trend, the overall prevalence of self-reported seat belt use among residents of states with secondary enforcement laws trails that among residents of states with primary enforcement laws (79.2% versus 88.2%). If the overall prevalence of seat belt use in states with secondary enforcement laws had matched the higher prevalence in states with primary enforcement laws, an additional 7.3 million adults would have reported seat belt use in 2008. Further, a disproportionate number of adults who did not report seat belt use (49%) lived in states with secondary enforcement laws, which made up 35% of the total U.S. adult population. The higher levels of seat belt use associated with primary enforcement laws have been demonstrated to reduce serious injuries and deaths (6).
This analysis shows that persons in certain sociodemographic categories are less likely than others to use seat belts (e.g., men, young adults, residents of rural areas, and certain racial/ethnic populations). However, even among these persons, self-reported seat belt use was higher among those in states with primary laws. This finding supports previous research that showed that primary enforcement laws can increase seat belt use, even among those persons less likely to use seat belts and more likely to be killed in motor vehicle crashes (9).
From 2001 to 2009, a period during which 14 additional states passed primary seat belt laws, the nonfatal, motor vehicle--occupant injury rate declined. Motor vehicle--occupant fatality rates also declined during this period (10). The results of this report indicate that rates of nonfatal injury declined with age, a finding consistent with earlier findings that drivers aged 16--24 years had the highest rates of crash-related injury and death (10). This report found no significant difference in the nonfatal, motor vehicle--occupant injury rates for men and women. However, crash-related injuries sustained by men tend to be more severe than those for women, leading to a higher case-fatality rate for men (11).
Increases in seat belt use likely have contributed to the observed declines in motor vehicle--occupant injuries. Seat belt use reduces the likelihood of serious injury in a crash by approximately 50% (4). The National Highway Traffic Safety Administration (NHTSA) investigated the long-term trend of declining nonfatal traffic injuries and found that increases in seat belt use were a major factor in the reduction in injuries (12). Other contributing factors included declines in alcohol-impaired driving and improvements in vehicle safety (e.g., air bags and electronic stability control) (12). NHTSA estimates that, in 2009, nearly 450 additional lives would have been saved, 12,000 nonfatal injuries prevented, and $1.6 billion in societal costs saved if all states had primary seat belt enforcement laws (NHTSA, 2009, unpublished data). Many high-income countries in Europe have achieved high levels of seat belt use with primary enforcement laws that cover all vehicle occupants. Front-seat estimates of seat belt use are >90% in France (98%), Sweden (96%), Germany (95%), Netherlands (94%), Norway (93%), and United Kingdom (91%)] (13). Notably, the traffic fatality rate per 100,000 population in the United States is nearly double that of 21 selected European high-income countries (13).
Primary enforcement laws are strongly recommended by the U.S. Task Force on Community Preventive Services to increase seat belt use (6). Other components of seat belt laws also can increase seat belt use. Enhanced enforcement of seat belt laws has been shown to increase seat belt use and reduce injuries and fatalities (6). In addition, NHTSA has estimated that the prevalence of seat belt use in rear seats is nearly 20 percentage points higher in states with laws requiring belt use in all seating positions versus states with laws requiring belt use only in the front seating positions (14).
The findings in this report are subject to at least six limitations. First, NEISS-AIP provides data at the national level but prevents examination of injury estimates by state. The injury estimates reported likely are underestimates of all nonfatal motor vehicle--occupant injuries because NEISS-AIP does not include physician offices, clinics, urgent-care facilities, or any medical facilities other than hospital emergency departments. Additionally, NEISS-AIP does not collect factors that might relate to the injuries, such as seating position, seat belt use, air bag deployment, or whether injuries occurred in states with primary or secondary enforcement laws. Second, 2008 BRFSS was a landline telephone survey, and as such, excluded a small percentage of households with no telephone and approximately 15% of households with wireless telephones only. Third, the BRFSS response rate was only 53%. Fourth, the BRFSS data are self-reported; however, a recent evaluation of self-reported data on seat belt use found little evidence of overestimation of use because of social desirability bias (15). Fifth, the analysis did not consider other components of enforcement laws that might affect seat belt use (e.g., amount of fine, whether all occupants or only those in the front seat are covered, and the length of time law has been in effect). Finally, the data presented from both surveillance systems are cross-sectional and cannot be used to assess causality regarding seat belt enforcement laws, seat belt use, and nonfatal injuries.
To reduce the number of crash-related injuries, all motor vehicle occupants should wear seat belts (or age-appropriate and size-appropriate restraints for children) on every trip. Although primary enforcement laws are a proven strategy for increasing seat belt use and reducing the number of injuries, as of January 2011, 19 states still do not have such laws in effect. States should consider enacting primary enforcement seat belt laws that are vigorously enforced and that cover all motor vehicle occupants of appropriate age and size, regardless of seating position in the vehicle (6,14).
Reported by
LF Beck, MPH, BA West, MPH, Div of Unintentional Injury Prevention, National Center for Injury Prevention and Control, CDC.
References
- CDC. WISQARS (Web-based Injury Statistics Query and Reporting System). Atlanta, GA: US Department of Health and Human Services, CDC; 2010. Available at http://www.cdc.gov/injury/wisqars. Accessed October 12, 2010.
- Naumann RB, Dellinger AM, Zaloshnja E, Lawrence BA, Miller TR. Incidence and total lifetime costs of motor vehicle-related fatal and nonfatal injury by road user type, United States, 2005. Traffic Inj Prev 2010;11:353--60.
- Beck LF, Dellinger AM, O'Neil ME. Motor vehicle crash injury rates by mode of travel, United States: using exposure-based methods to quantify differences. Am J Epidemiol 2007;166:212--8.
- National Highway Traffic Safety Administration. Final regulatory impact analysis amendment to Federal Motor Vehicle Safety Standard 208. Passenger car front seat occupant protection. Washington, DC: US Department of Transportation, National Highway Traffic Safety Administration; 1984. Publication no. DOT-HS-806-572. Available at http://www-nrd.nhtsa.dot.gov/pubs/806572.pdf. Accessed December 13, 2010.
- National Highway Traffic Safety Administration. Lives saved in 2009 by restraint use and minimum-drinking-age laws. Washington, DC: US Department of Transportation, National Highway Traffic Safety Administration; 2010. Publication no. DOT-HS-811-383. Available at http://www-nrd.nhtsa.dot.gov/pubs/811383.pdf. Accessed December 13, 2010.
- Dinh-Zarr TB, Sleet DA, Shults RA, et al. Reviews of evidence regarding interventions to increase the use of safety belts. Am J Prev Med 2001;21(4 Suppl):48--65.
- Insurance Institute for Highway Safety. Safety belt use laws. Arlington, VA: Insurance Institute for Highway Safety; 2010. Available at http://www.iihs.org/laws/safetybeltuse.aspx. Accessed December 13, 2010.
- Williams AF, Wells JK. The role of enforcement programs in increasing seat belt use. J Safety Res 2004;35:175--80.
- Beck LF, Shults RA, Mack K, Ryan G. Associations between sociodemographics and safety belt use in states with and without primary enforcement laws. Am J Public Health 2007;97:1619--24.
- National Highway Traffic Safety Administration. Traffic safety facts 2008. Washington, DC: US Department of Transportation, National Highway Traffic Safety Administration; 2009. Publication no. DOT-HS-811-170. Available at http://www-nrd.nhtsa.dot.gov/pubs/811170.pdf. Accessed December 13, 2010.
- CDC. Surveillance for fatal and nonfatal injuries---United States, 2001. MMWR 2004;53(No. SS-7).
- National Highway Traffic Safety Administration. Trends in non-fatal traffic injuries: 1996--2005. Washington, DC: US Department of Transportation, National Highway Traffic Safety Administration; 2008. Publication no. DOT-HS-810-944. Available at http://www-nrd.nhtsa.dot.gov/pubs/810944.pdf. Accessed December 13, 2010.
- World Health Organization. Global status report on road safety: time for action. Geneva: World Health Organization, 2009. Available at: http://www.who.int/violence_injury_prevention/road_safety_status/2009.
- National Highway Traffic Safety Administration. Seat belt use in rear seats in 2008. Washington, DC: US Department of Transportation, National Highway Traffic Safety Administration; 2009. Publication no. DOT-HS-811-133. Available at http://www-nrd.nhtsa.dot.gov/pubs/811133.pdf. Accessed December 13, 2010.
- Ibrahimova A. Have self-reported and observed seatbelt use in the United States converged? Presented at the 59th Annual Epidemic Intelligence Service Conference, April 19--23, 2010, Atlanta, GA.
* Arkansas, Florida, Kansas, Minnesota, and Wisconsin subsequently passed primary enforcement laws in 2009 or 2010.
FIGURE. Age-adjusted, nonfatal, motor vehicle--occupant injury rates* among adults aged ≥18 years, by sex --- National Electronic Injury Surveillance System--All Injury Program, United States, 2001--2009
* Per 100,000 population
Alternate Text: The figure above shows age-adjusted, nonfatal, motor vehicle-occupant injury rates among adults aged ≥18 years, by sex in the United States during 2001-2009. From 2001 to 2009, the injury rate overall declined 15.6% from 1,193.8 injuries per 100,000 population to 1,007.5.
Use of trade names and commercial sources is for identification only and does not imply endorsement by the U.S. Department of
Health and Human Services. |
All MMWR HTML versions of articles are electronic conversions from typeset documents.
This conversion might result in character translation or format errors in the HTML version.
Users are referred to the electronic PDF version (http://www.cdc.gov/mmwr)
and/or the original MMWR paper copy for printable versions of official text, figures, and tables.
An original paper copy of this issue can be obtained from the Superintendent of Documents, U.S.
Government Printing Office (GPO), Washington, DC 20402-9371;
telephone: (202) 512-1800. Contact GPO for current prices.
**Questions or messages regarding errors in formatting should be addressed to
mmwrq@cdc.gov.
