|
TABLE 1. Number* and rate† of fatal occupational injuries, by age group, race/ethnicity, sex, and event or exposure --- United States, 1998--2007 |
|||||||||||||||
|---|---|---|---|---|---|---|---|---|---|---|---|---|---|---|---|
|
Persons aged 15--17 yrs |
Persons aged 15--24 yrs |
Persons aged ≥25 yrs |
Rate ratio (RR) of persons aged 15--24 yrs to persons aged ≥25 yrs |
||||||||||||
|
Characteristic |
No. |
(%§) |
Rate |
(95% CI¶) |
No. |
(%) |
Rate |
(95% CI) |
No. |
(%) |
Rate |
(95% CI) |
RR |
(95% CI) |
p value |
|
Total |
374 |
(100) |
2.9 |
(±0.5) |
5,719 |
(100) |
3.6 |
(±0.2) |
51,150 |
(100) |
4.4 |
(<0.1) |
0.8 |
(<0.1) |
<0.001 |
|
Race/Ethnicity** |
|||||||||||||||
|
White, non-Hispanic |
243 |
(65) |
2.5 |
(±0.5) |
3,543 |
(62) |
3.3 |
(±0.2) |
36,894 |
(72) |
4.4 |
(<0.1) |
0.7 |
(<0.1) |
<0.001 |
|
Black, non-Hispanic |
17 |
(5) |
1.4 |
(±1.4) |
420 |
(7) |
2.3 |
(±0.4) |
5,107 |
(10) |
4.1 |
(±0.2) |
0.6 |
(±0.2) |
<0.001 |
|
Hispanic |
102 |
(27) |
6.3 |
(±3.2) |
1,503 |
(26) |
5.6 |
(±0.8) |
6,834 |
(13) |
5.1 |
(±0.2) |
1.1 |
(±0.1) |
0.1 |
|
Other, non-Hispanic |
---†† |
--- |
--- |
--- |
214 |
(4) |
3.0 |
(±0.7) |
1,986 |
(4) |
3.1 |
(±0.1) |
1.0 |
(±0.2) |
0.4 |
|
Sex |
|||||||||||||||
|
Male |
335 |
(90) |
4.9 |
(±0.8) |
5,281 |
(92) |
6.0 |
(±0.4) |
47,240 |
(92) |
7.0 |
(±0.1) |
0.9 |
(<0.1) |
<0.001 |
|
Female |
39 |
(10) |
0.6 |
(±0.2) |
438 |
(8) |
0.6 |
(<0.1) |
3,910 |
(8) |
0.8 |
(<0.1) |
0.8 |
(<0.1) |
<0.001 |
|
Event or exposure§§ |
|||||||||||||||
|
Contact with objects and equipment |
70 |
(19) |
997 |
(17) |
8,469 |
(17) |
|||||||||
|
Falls |
34 |
(9) |
614 |
(11) |
6,771 |
(13) |
|||||||||
|
Bodily reaction and exertion |
---†† |
--- |
--- |
--- |
114 |
(<1) |
|||||||||
|
Exposure to harmful substances or environments |
40 |
(11) |
722 |
(13) |
4,336 |
(8) |
|||||||||
|
Transportation incidents |
178 |
(48) |
2,399 |
(42) |
22,202 |
(43) |
|||||||||
|
Fires and explosions |
6 |
(2) |
192 |
(3) |
1,593 |
(3) |
|||||||||
|
Assaults and violent acts |
45 |
(12) |
788 |
(14) |
7,627 |
(15) |
|||||||||
|
* The number of deaths is derived from the U.S. Department of Labor's Bureau of Labor Statistics (BLS) Census of Fatal Occupational Injuries. Additional information available at http://www.bls.gov/iif/oshcfoi1.htm. † Fatal rates are per 100,000 full-time equivalent (FTE) workers; one FTE = 2,000 hours worked per year and includes hours for all jobs worked by a person; FTE are derived from the BLS Current Population Survey. Additional information available at http://www.bls.gov/cps/home.htm. § Percentages might not sum to 100 because of rounding. ¶ Confidence interval. ** Deaths of workers with race/ethnicity unidentified accounted for <1% of all deaths; workers with Hispanic ethnicity might be of any race. †† Did not meet minimum reporting requirements. §§ Classified according to the BLS Occupational Injury and Illness Classification System (additional information available at http://www.bls.gov/iif/oshoiics.htm); included in the total number of deaths are nonclassifiable fatal injury events and exposures accounting for <0.1% of all deaths; rates are not given for event or exposure characteristics. |
|||||||||||||||
Persons using assistive technology might not be able to fully access information in this file. For assistance, please send e-mail to: mmwrq@cdc.gov. Type 508 Accommodation and the title of the report in the subject line of e-mail.
Occupational Injuries and Deaths Among Younger Workers --- United States, 1998--2007
Younger workers (defined as those aged 15--24 years) represent 14% of the U.S. labor force and face high risk for injury while on the job (1--4). To assess trends and help guide efforts to improve young worker safety, CDC's National Institute for Occupational Safety and Health (NIOSH) analyzed data from the Census of Fatal Occupational Injuries (CFOI) and the National Electronic Injury Surveillance System occupational supplement (NEISS-Work) for the period 1998--2007. This report summarizes the results of that analysis. During the 10-year period, 5,719 younger workers died from occupational injuries. The fatality rate for younger workers was 3.6 deaths per 100,000 full-time equivalent workers (FTE) (one FTE = 2,000 hours worked per year) and was lower than the rate for older workers (defined as aged ≥25 years) (4.4 deaths per 100,000 FTE). The fatality rate decreased an estimated 14% during the 10-year period. For the same period, an estimated 7.9 million nonfatal injuries to younger workers were treated in U.S. hospital emergency departments (EDs). The nonfatal injury rate was 5.0 ED-treated injuries per 100 FTE and was approximately two times higher than among workers aged ≥25 years. The rate of nonfatal injuries among younger workers declined 19%, but the decline was not statistically significant. Public health, labor, and trade organizations should provide guidance to employers to help them in their responsibilities to provide safer workplaces and should identify steps that employers can take to remove or reduce injury hazards. Employers need to ensure that their younger workers have the requisite training and personal protective equipment to perform their jobs safely.
For CFOI, the Bureau of Labor Statistics (BLS) collects data on occupational injury deaths from multiple sources, including death certificates, police reports, and workers' compensation reports.* To be included in CFOI, the decedent must have been employed at the time of incident, working as a volunteer in the same functions as a paid employee, or present at a site as a job requirement (5). CFOI includes deaths of all youths working on family farms and other businesses. The event or exposure causing death is classified according to the Occupational Injury and Illness Classification System (OIICS) (5). To calculate fatality rates, labor force denominator estimates were derived from the U.S. Current Population Survey (CPS)† for workers aged ≥15 years (3). Beginning in 2003, the decedents' industry was reported according to the North American Industry Classification System (NAICS).§ Industry coding before 2003 was not compatible with this system; therefore, for this report, industry information is only given for deaths occurring during 2003--2007.
The NEISS-Work ED-based surveillance system tracks nonfatal work-related injuries and illnesses treated in EDs by using a national stratified probability sample of 67 U.S. hospitals.¶ For NEISS-Work, injuries or illnesses are determined to be work related when the ED chart indicates that the incident occurred to a civilian noninstitutionalized person while working for pay or other compensation, working on a farm, or volunteering for an organized group (2). Trained personnel abstract information regarding worker, injury/illness, and incident characteristics from medical records at each participating hospital. The event or exposure causing injury is classified according to the OIICS (5). Industry data are not available for NEISS-Work.
NEISS-Work cases were assigned statistical weights based on a sampling frame of national hospital ED visits. The weights were summed to provide national estimates of the number of work-related ED-treated injuries and illnesses. For nonfatal injury rates, CPS labor force denominator estimates were used (3). Ninety-five percent confidence intervals (CIs) for number and rate of injury took into account the variance arising from the stratified sample. Variances for rates also took into account the denominator variance by using the BLS approximate standard error formulas derived for the CPS (3). Trends in fatal and nonfatal injury rates were tested for statistical significance by using Poisson regression analysis.
During 1998--2007, a total of 5,719 fatal injuries among younger workers were identified (average of 572 per year) (Table 1). An estimated 10-year decline of 14% (p<0.001) was observed in the rate of deaths, as well as an estimated 19% decline in the rate of nonfatal work injuries among younger workers, although the latter decline was not statistically significant (p=0.3) (Figure). Among younger workers, the highest nonfatal injury rates were experienced by workers aged 18 and 19 years, at 6.3 (CI = ±2.0) and 5.9 (CI = ±1.8) injuries per 100 FTE, respectively. The younger worker nonfatal injury rate was twofold higher than the rate for older workers (5.0 ED-treated injuries per 100 FTE compared with 2.4, respectively) (Table 2).
Younger Hispanic workers had a fatality rate (5.6 per 100,000 FTE [p=0.1]) that was significantly higher than the rate for non-Hispanic white workers (3.3 per 100,000 FTE; p<0.001) and the rate for non-Hispanic black workers (2.3 per 100,000 FTE; p<0.001) (Table 1). In contrast, the rate of nonfatal ED-treated injuries for younger Hispanic workers was not significantly different from younger, non-Hispanic white and black workers (2.3 versus 4.5 per 100 FTE [p=0.06 for white workers] and 2.3 versus 3.8 per 100 FTE [p=0.1 for black workers]) (Table 2). Similar to older workers, younger male workers experienced higher rates of fatal and nonfatal injuries than younger female workers.
Transportation-related deaths, largely highway incidents, were the most frequently recorded events among all age groups (Table 1).** Transportation events included incidents involving all forms of transportation and powered industrial equipment when the incident resulted in an injury from a collision, loss of vehicle control, sudden vehicle stop, or a pedestrian/worker being struck by a vehicle. Highway incidents occurred on public roadways, shoulders, or surrounding areas (excluding incidents off the highway/street or on industrial, commercial, or farm premises or parking lots). For nonfatal injuries, contact with objects or equipment was the most common event for all age groups but accounted for a larger proportion of injuries among younger workers (49%) compared with older workers (40%) (Table 2). The contact injuries largely involved the worker being struck by or against, rubbed or abraded, or caught in or crushed by various tools, equipment, machinery, parts, or materials.
Results for fatal injuries classified by industry indicate that, during 2003--2007, the greatest number of fatal injuries among younger workers occurred in the services (32%), construction (28%), wholesale and retail trade (10%), and agriculture (10%) industry sectors. Younger workers experienced the highest rates of fatal injury in mining (36.5 per 100,000 FTE), agriculture (21.3 per 100,000 FTE), and construction (10.9 per 100,000 FTE).
Reported by
CR Estes, MPH, LL Jackson, PhD, DN Castillo, MPH, Div of Safety Research, National Institute for Occupational Safety and Health, CDC.
Editorial Note
The analysis in this report indicates declines in the rates of fatal and nonfatal ED-treated injuries among younger workers (i.e., those aged 15--24 years) during 1998--2007. The decline in the fatality rate was moderate, 14% over the 10-year period, and the 19% decline in the rate of nonfatal injuries did not reach statistical significance. Healthy People 2010 set a goal to reduce the rate of ED-treated work injuries among persons aged 15--17 years by 30%, to a rate of 3.5 per 100 FTE.†† The rate for the most recent year in this analysis was 4.2 per 100 FTE, short of the goal. Research into the contributors to these declines and barriers to further declines has not been conducted but would be helpful in focusing future efforts. The proposed Healthy People 2020 objective expands the definition of adolescent workers to include workers aged 18--19 years§§ because persons aged 18--19 years have the highest injury rates among younger workers.
Higher rates of nonfatal injuries among younger workers also have been observed in other countries (4). A systematic review found consistent evidence that injuries were associated with increased hazards in workplaces of younger workers (e.g., use of ladders and knives), a perceived work overload (e.g., pressure to complete work more quickly), and minority status (4). Lack of job knowledge, training, and skills might contribute to increased risk among younger workers, who might be less likely to recognize hazards, less likely to speak up regarding safety, and less aware of their legal rights as workers (1). This might be exacerbated for some groups of workers, such as Hispanics (6) and workers in their first jobs.
The finding of lower nonfatal injury rates among Hispanic workers is inconsistent with the patterns of fatality rates observed in this study and findings in other studies using various data sources (7). Hispanic workers might be less likely to report work as the place of injury and to seek hospital care for less severe nonfatal injuries (7).
The primary responsibility for workplace safety lies with employers (8). Thus, reductions in younger worker injuries and deaths will require employers to make changes in work environments and workplace practices. General guidance on using a hierarchy of controls to improve worker safety (8), as well as specific recommendations to employers focused on protecting the youngest workers from injuries, is available (1). Workers also have responsibilities for complying with employer policies and practices for safe work, and ideally can identify unsafe conditions and develop safe solutions (8). Public health and safety practitioners, trade and labor organizations, and researchers also can contribute to younger worker safety by providing recommendations to employers on avoiding risks to these less experienced workers (8).
The findings in this report are subject to at least four limitations. First, NEISS-Work data only include workers treated in EDs, estimated to comprise only one third of work injuries treated among all medical venues (2). Second, large standard errors arising from the NEISS-Work sample design reduce the power to detect statistically significant nonfatal injury trends. Third, for both NEISS-Work and CFOI, inclusion of cases is dependent upon identifying work-relatedness; such determinations can be difficult for certain types of incidents where the work-relationship might not be clear or where workers do not wish to identify the work connection. Finally, both systems include injuries to volunteers. However, volunteers are not included in the CPS denominator, potentially resulting in an overestimation of injury rates.
Employers should assess injury hazards in their workplaces, take steps to remove or reduce the injury potential, and ensure their workers have the requisite training and personal protective equipment to perform their jobs safely. Employers should be aided by health and safety practitioners, as well as others, in providing better guidance and tools to improve young worker safety. NIOSH recently introduced school curricula (9), which can help students identify workplace health and safety hazards, take measures to reduce risk for injury, and understand their rights as workers. The curricula would ensure that younger persons possess basic safety knowledge when they begin their work lives, and increase the potential for them to play active roles in workplace efforts to identify injury hazards and effective control strategies (8). NIOSH is encouraging widespread use of these free curricula in the nation's schools. NIOSH continues to conduct and support surveillance, research, and outreach for younger worker safety (10). One example is the ongoing comprehensive Childhood Agricultural Injury Prevention Initiative, which demonstrates the potential for substantial reductions with dedicated efforts. Periodic surveys of farm operators (CDC, unpublished data, 2010) have continued to show declines in work-related injury rates beyond the 30% reported during 1998--2004 (10).
References
- CDC. NIOSH alert: preventing deaths, injuries, and illnesses of young workers. Cincinnati, OH: US Department of Health and Human Services, CDC, NIOSH; 2003. Available at http://www.cdc.gov/niosh/docs/2003-128/2003128.htm. Accessed April 16, 2010.
- CDC. Nonfatal occupational injuries and illnesses---United States, 2004. MMWR 2007;56:393--7.
- US Department of Labor, Bureau of Labor Statistics. Current population survey, 1998--2007 (microdata files) and labor force, employment, and unemployment from the current population survey. In: BLS handbook of methods. Washington, DC: US Department of Labor, Bureau of Labor Statistics; 2008. Available at http://www.bls.gov/cps/home.htm. Accessed April 16, 2010.
- Breslin FC, Day D, Tompa E, et al. Non-agricultural work injuries among youth---a systematic review. Am J Prev Med 2007;32:151--62.
- US Department of Labor, Bureau of Labor Statistics. Occupational safety and health statistics [Chapter 9]. In: BLS handbook of methods. Washington, DC: US Department of Labor, Bureau of Labor Statistics; 2008. Available at http://www.bls.gov/opub/hom. Accessed April 16, 2010.
- CDC. Work-related injury deaths among Hispanics---United States, 1992--2006. MMWR 2008;57:597--600.
- McGreevy K, Lefkowitz D, Valiante D, et al. Utilizing hospital discharge data (HD) to compare fatal and non-fatal work-related injuries among Hispanic workers in New Jersey. Am J Industr Med 2010;53:146--52.
- Castillo DN, Pizatella TJ, Stout NA. Injuries. In: Levy B, Wegman D, Baron SL, Sokas RK, eds. Occupational and environmental health: recognizing and preventing disease and injury, 5th ed. Philadelphia, PA: Lippincott, Williams, and Wilkins; 2006:471--87.
- CDC. Youth @ work: talking safety. Cincinnati, OH: US Department of Health and Human Services, CDC, NIOSH; 2007. Available at http://www.cdc.gov/niosh/talkingsafety. Accessed April 16, 2010.
- CDC. The NIOSH Traumatic Injury Research and Prevention Program evidence package. Cincinnati, OH: US Department of Health and Human Services, CDC, NIOSH; 2007. Available at: http://www.cdc.gov/niosh/nas/traumainj. Accessed April 16, 2010.
* NIOSH receives a CFOI research file through a Memorandum of Understanding from BLS.
† CPS is the primary source of U.S. labor force statistics. For CPS, the U.S. Census Bureau surveys approximately 50,000 households monthly to collect employment, unemployment, earnings, hours of work, and other indicators.
§ NAICS is the standard for classifying business establishments; additional information available at http://www.census.gov/eos/www/naics.
¶ NIOSH collects NEISS-Work data in collaboration with the Consumer Product Safety Commission (CPSC), which operates the base NEISS hospital system for the collection of data on consumer product--related injuries. The CPSC product-related injury estimates exclude work-related injuries, whereas NEISS-Work estimates include all work-related injuries regardless of product involvement (i.e., NEISS and NEISS-Work cases are mutually exclusive). Because of hospital closures and other nonparticipation/nonresponse factors, the number of reporting hospitals varied during the study period.
** CFOI includes deaths of workers traveling between job sites but not commuting to or from work.
†† Healthy People 2010 objective 20-02h: reduce work-related injuries among adolescent workers (aged 15--17 years). Additional information available at http://www.healthypeople.gov/data/midcourse/html/focusareas/fa20objectives.htm.
§§ Healthy People 2020 occupational safety and health objective HP2020--8c: reduce nonfatal work-related injuries among adolescent workers (aged 15 to 19 years). Additional information available at http://healthypeople.gov/hp2020/objectives/topicareas.aspx.
What is already known on this topic?
Younger workers (those aged 15--24 years) are overrepresented in jobs with injury hazards.
What is added by this report?
Among younger workers, the rates of fatal and nonfatal work injuries declined moderately during 1998--2007, and younger workers experienced nearly twice the risk for nonfatal injury compared with older workers.
What are the implications for public health practice?
Measures to increase employers' knowledge about injury risks for younger workers and the steps that employers can take to improve safety should be more widely disseminated and implemented.
FIGURE. Number and rate of fatal* and nonfatal† occupational injuries among younger workers,§ by year --- United States, 1998--2007
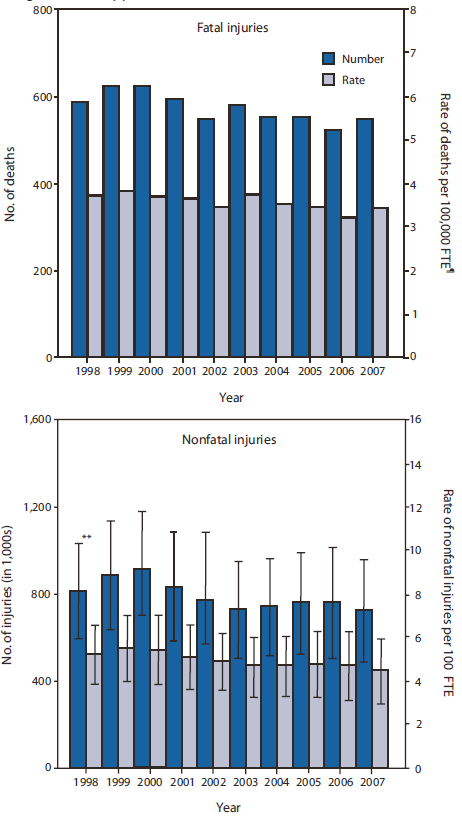
* Fatal occupational injury data are from the U.S. Department of Labor's Bureau of Labor Statistics (BLS) Census of Fatal Occupational Injuries. Additional information available at http://www.bls.gov/iif/oshcfoi1.htm.
† Data for nonfatal occupational injuries treated in U.S. hospital emergency departments are from the National Electronic Injury Surveillance System occupational supplement (NEISS-Work). Additional information available at http://www.cdc.gov/mmwr/preview/mmwrhtml/mm5616a3.htm.
§ Workers aged 15--24 years.
¶ Full-time equivalent workers (FTE); one FTE = 2,000 hrs worked per year; FTE are derived from the BLS Current Population Survey. Additional information available at http://www.bls.gov/cps/home.htm.
** Error bars represent the 95% confidence interval (no error bars are shown for fatality census counts or the fatality rates; confidence intervals for rates were less than ±0.1).
Alternate Text: The figure above shows the number and rate of fatal and nonfatal occupational injuries among younger workers in the United States, by year, during 1998-2007. A total of 5,719 fatal injuries among younger workers were identified (average of 572 per year). An estimated 10-year decline of 14% (p<0.001) was observed in the rate of deaths, as well as an estimated 19% decline in rate of nonfatal work injuries among younger workers, although the latter decline was not statistically significant (p=0.3).
|
TABLE 2. Number* and rate† of nonfatal occupational injuries treated in U.S. hospital emergency departments, by age group, race/ethnicity, sex, and event or exposure --- United States, 1998--2007 |
||||||||||||||||||
|---|---|---|---|---|---|---|---|---|---|---|---|---|---|---|---|---|---|---|
|
Persons aged 15--17 yrs |
Persons aged 15--24 yrs |
Persons aged ≥25 yrs |
Rate ratio (RR) of persons aged 15--24 yrs to persons aged ≥25 yrs |
|||||||||||||||
|
Characteristic |
No. (1,000s) |
(95% CI§)
|
(%¶) |
Rate |
(95% CI) |
No. (1,000s) |
(95% CI)
|
(%) |
Rate |
(95% CI) |
No. (1,000s) |
(95% CI)
|
(%) |
Rate |
(95% CI) |
RR |
(95% CI) |
p value |
|
Total |
598 |
(±117) |
(100) |
4.6 |
(±1.2) |
7,946 |
(±2,256) |
(100) |
5.0 |
(±1.4) |
28,225 |
(±5,480) |
(100) |
2.4 |
(±0.5) |
2.0 |
(±0.3) |
<0.001 |
|
Race/Ethnicity** |
||||||||||||||||||
|
White, non-Hispanic |
386 |
(±109) |
(65) |
4.0 |
(±1.4) |
4,871 |
(±2,044) |
(61) |
4.5 |
(±1.9) |
16,296 |
(±4,763) |
(58) |
1.9 |
(±0.6) |
2.3 |
(±0.5) |
<0.001 |
|
Black, non-Hispanic |
47 |
(±19) |
(8) |
3.9 |
(±2.7) |
674 |
(±260) |
(8) |
3.8 |
(±1.6) |
3,474 |
(±1,511) |
(12) |
2.8 |
(±1.2) |
1.3 |
(±0.6) |
0.1 |
|
Hispanic |
29 |
(±13) |
(5) |
1.8 |
(±1.2) |
631 |
(±275) |
(8) |
2.3 |
(±1.1) |
2,052 |
(±1,107) |
(7) |
1.5 |
(±0.8) |
1.5 |
(±0.7) |
<0.1 |
|
Sex |
||||||||||||||||||
|
Male |
376 |
(±75) |
(63) |
5.5 |
(±1.9) |
5,527 |
(±1,635) |
(70) |
6.2 |
(±1.9) |
19,236 |
(±3,830) |
(68) |
2.8 |
(±0.6) |
2.2 |
(±0.4) |
<0.001 |
|
Female |
222 |
(±44) |
(37) |
3.6 |
(±1.2) |
2,418 |
(±634) |
(30) |
3.4 |
(±0.9) |
8,983 |
(±1,693) |
(32) |
1.8 |
(±0.3) |
1.8 |
(±0.3) |
<0.001 |
|
Event or exposure†† |
||||||||||||||||||
|
Contact with objects and equipment |
309 |
(±67) |
(52) |
3,898 |
(±1,173) |
(49) |
11,267 |
(±2,271) |
(40) |
|||||||||
|
Falls |
80 |
(±16) |
(13) |
904 |
(±230) |
(11) |
4,376 |
(±844) |
(16) |
|||||||||
|
Bodily reaction and exertion |
83 |
(±20) |
(14) |
1,710 |
(±580) |
(22) |
7,120 |
(±1,759) |
(25) |
|||||||||
|
Exposure to harmful substances or environments |
85 |
(±17) |
(14) |
754 |
(±155) |
(9) |
2,421 |
(±397) |
(9) |
|||||||||
|
Transportation incidents |
---§§ |
--- |
154 |
(±49) |
(2) |
769 |
(±176) |
(3) |
||||||||||
|
Fires and explosions |
--- |
--- |
48 |
(±14) |
(1) |
214 |
(±56) |
(1) |
||||||||||
|
Assaults and violent acts |
18 |
(±4) |
(3) |
294 |
(±99) |
(4) |
1,246 |
(±221) |
(4) |
|||||||||
|
* The number of nonfatal injuries treated in hospital emergency departments is derived from the National Electronic Injury Surveillance System occupational supplement (NEISS-Work). Additional information available at http://www.cdc.gov/mmwr/preview/mmwrhtml/mm5616a3.htm. † Nonfatal rates are per 100 full-time equivalent (FTE) workers; one FTE = 2,000 hours worked per year and includes hours for all jobs worked by a person; FTE are derived from the Current Population Survey. (Additional information available at http://www.bls.gov/cps/home.htm. § Confidence interval. ¶ Percentages might not sum to 100 because of rounding. ** Injured workers with other, non-Hispanic race/ethnicity accounted for nearly 2% of all injured workers; injured workers with unidentified race/ethnicity accounted for nearly 21% of all injured workers; workers with Hispanic ethnicity might be of any race. †† Classified according to the U.S. Department of Labor's Bureau of Labor Statistics (BLS) Occupational Injury and Illness Classification System (additional information available at http://www.bls.gov/iif/oshoiics.htm); included in the total number of injuries are nonclassifiable injury events and exposures accounting for <3% of all injuries; rates are not given for event or exposure characteristics. §§ Did not meet minimum reporting requirements. |
||||||||||||||||||
Use of trade names and commercial sources is for identification only and does not imply endorsement by the U.S. Department of
Health and Human Services.
References to non-CDC sites on the Internet are
provided as a service to MMWR readers and do not constitute or imply
endorsement of these organizations or their programs by CDC or the U.S.
Department of Health and Human Services. CDC is not responsible for the content
of pages found at these sites. URL addresses listed in MMWR were current as of
the date of publication.
All MMWR HTML versions of articles are electronic conversions from typeset documents.
This conversion might result in character translation or format errors in the HTML version.
Users are referred to the electronic PDF version (http://www.cdc.gov/mmwr)
and/or the original MMWR paper copy for printable versions of official text, figures, and tables.
An original paper copy of this issue can be obtained from the Superintendent of Documents, U.S.
Government Printing Office (GPO), Washington, DC 20402-9371;
telephone: (202) 512-1800. Contact GPO for current prices.
**Questions or messages regarding errors in formatting should be addressed to
mmwrq@cdc.gov.
