
Engineering Controls Database
Guidelines for the Control and Monitoring of Methane Gas on Continuous Mining Operations – Methane Monitoring – Methane Sampling Strategy, Sampling on the Mining Machine
|
The introduction of conventional mining methods, which increased the rate of mining, was an important step in the mechanization of mining. The intermittent nature of the conventional mining process halted the extraction process for ore-loading and usually allowed time for methane gas to be dispersed. However, the introduction of continuous mining machines in the 1940s produced a constant flow of ore from the working face of the mine and resulted in an increase in methane levels. The number of face ignitions increased as more continuous mining machines were placed underground. Methane levels were found to be dangerously high. In some cases, methane concentrations measured 20 ft from the mining face exceeded the lower explosive limit (5% by volume) [USBM 1958]. The need for better face area ventilation was recognized to reduce the potential for explosions. |
|
|
Excessive levels of methane gas can affect the safety of the underground work force. Available methane control systems have been challenged in recent years by mining developments which include the use of continuous mining machines. Most mining accidents today generally involve only a few individuals. However, the infrequent occurrence of gas explosions puts the lives of the entire underground workforce at risk. In the past 10 years, explosions have led to 65 fatalities and 18 injuries with major explosions occurring at the Sago Mine in West Virginia in 2006 (12 fatalities and 1 injury), the Darby No. 1 Mine in Kentucky in 2006 (5 fatalities and 1 injury) and, most recently, at the Upper Big Branch Mine in West Virginia in 2010 (29 fatalities) [NIOSH 2011]. |
|
|
The U.S. Bureau of Mines (USBM) was formed in 1910 following a series of underground explosions that resulted in many fatalities and injuries [Kirk 1996]. The agency was responsible for conducting scientific research and disseminating information on the extraction, processing, use, and conservation of mineral resources. The USBM research program for mining health and safety was transferred to NIOSH in 1996. Since that time, NIOSH has established a ventilation test gallery where techniques for methane control and monitoring are evaluated under a variety of conditions that simulate airflow near the working face of a continuous mining section. Airflow patterns and methane concentrations are studied in a detailed manner that is not possible in a working underground mine. Effect of Water Sprays on Face Airflow and Methane Engineering controls such as water sprays and scrubbers help maintain safe methane levels in coal mines. Methane monitoring is required to ensure that engineering controls are effective and that methane concentrations do not exceed regulatory standards. NIOSH research examined instruments and sampling strategies used for methane sampling and developed methods for evaluating performance. The research included monitors using both catalytic heat of combustion and infrared absorption sensors. Methane Sampling Strategy, Sampling on the Mining Machine Methane measurements are made on the mining machine to estimate face methane oncentrations. Frictional ignitions are most likely to occur at the face where it is not possible to measure methane concentrations during mining. As long as methane concentrations measured on the machine are less than 1%, methane concentrations at the face are assumed to be less than 5%, the lower explosive limit for methane. Whenever concentrations measured on the machine exceed 1%, the protection provided to the worker is reduced. Sampling location on the mining machine is one of the most important factors affecting the estimates of face methane concentration and protection provided to the worker. Federal regulations require that “…the [methane] sensing devices of methane monitors shall be installed as close to the working face as practicable [30 CFR 75.342(a)(3)].” The mining company, with the approval of MSHA, usually selects the location for mounting the methanometer sensor. Common guidelines for sensor placement include locating the sensor • Six to 8 ft from the face where damage to the head due to falling rock and moisture is less. • On the return air side of the mining machine (side opposite the ventilation tubing or curtain) where methane concentrations are usually highest. Tests were conducted in the ventilation test gallery to compare methane concentrations measured at several locations on the machine with methane concentrations measured concurrently at locations 1 ft from the face. For these tests, the mining machine was located at the center of a 16½-ft wide entry. Blowing tubing, positioned 2 to 10 ft behind the mining machine, directed intake air (4,000 or 7,000 ft3/min) down the left (intake air) side of the entry. Machine-mounted sprays and a scrubber were operated during these tests. Methane sampling locations were 5.5, 6.5, and 26 ft from the face, on both sides of the model mining machine. In addition, there were three sampling locations 1 ft from the face (Figure 1). 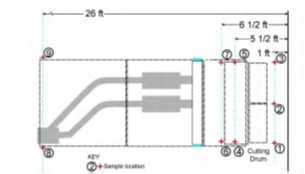 Concentrations were monitored at all locations on the machine and at the face for eight different face ventilation conditions and tests were repeated once. For each test, the highest of the three face concentrations was plotted versus the average concentration measured at each of the six machine sampling locations. Scatter plots with the linear lines of best fit for each sampling location are given in Figure 2. 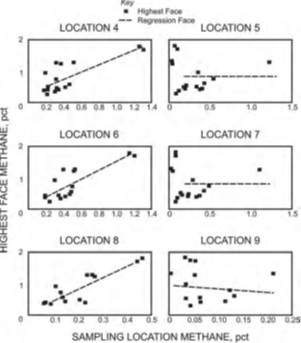 The “student’s t” distribution was used to determine if the slope of each line was statistically different from zero (95% confidence). Statistically, the relationships between machine and face concentrations were significant only when the slope of the least squares line was greater than zero. Analysis of the data showed • The relationships were significant only for the three sampling locations on the right (return air) side of the machine (locations 4, 6 and 8): airflow moved away from the face, passing over the three locations (4, 6, and 8) on the right (return air) side of the face. In theory, all three locations on the right (return air) side of the machine could be used for sampling, but • Location 8 would probably not be chosen because it is 26 ft from the face. • Location 4 would probably not be chosen because it is in a location (5.5 ft from the face) where damage to the sensor is likely. • Location 6 is relatively close to the face (6.5 ft) but far enough to provide protection for the sampling instruments. The relative protection provided to the worker was evaluated by sampling at two locations on the return air side, 5 and 6.5 ft from the face (locations 4 and 6, respectively). First, it was assumed that, since location 4 was closest to the face, measurements made at this location provide the best estimate of face concentration. The 95% prediction limits were added to the line of best fit for location 4 (Figure 3). Based on this data, if the measured concentration is 1%, the chance of the highest face concentration exceeding 2.3% is less than 5%. If this is an acceptable level of risk, an equivalent level of risk can be determined for measurements made at location 6. 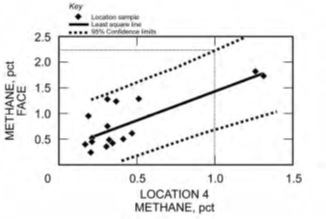 Assuming there is a linear relationship between concentrations measured at locations 4 and 6, a concentration of 1.0% measured at location 4 corresponds to a concentration of 0.96% measured at location 6 (Figure 4). Equivalent levels of protection would be provided if the maximum allowable concentrations at locations 4 and 6 were 1.0% and 0.96%, respectively. 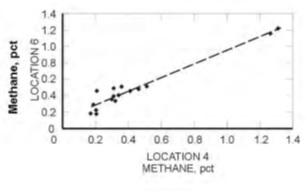 NOTE: The above control information is taken directly from the following publication: NIOSH [2010]. Information circular 9523. Guidelines for the control and monitoring of methane gas in continuous mining operations. Morgantown, WV: U.S. Department of Health and Human Services, Centers for Disease Control and Prevention, National Institute for Occupational Safety and Health, DHHS (NIOSH) Publication No. 2010-141. |
|
|
CFR. Code of Federal Regulations. Washington, DC: U.S. Government Printing Office, Office of the Federal Register. Kirk WS [1996]. The history of the Bureau of Mines. In: U.S. Bureau of Mines Minerals Yearbook, 1994. Washington, DC: U.S. Bureau of Mines. NIOSH [2011]. Ventilation and explosion prevention highlights. [http://www.cdc.gov/niosh/mining/highlights/programareahighlights16.html] USBM [1958]. Auxiliary ventilation of continuous miner places. By Stahl RW. Washington, DC: U.S. Bureau of Mines, Report of Investigations, No. 5414. |
|
|
coal mining continuous mining operations deep-cut mining miners |