COVID-19 Science Update released: November 10, 2020 Edition 64

The COVID-19 Science Update summarizes new and emerging scientific data for public health professionals to meet the challenges of this fast-moving pandemic. Weekly, staff from the CDC COVID-19 Response and the CDC Library systematically review literature in the WHO COVID-19 databaseexternal icon, and select publications and preprints for public health priority topics in the CDC Science Agenda for COVID-19 and CDC COVID-19 Response Health Equity Strategy.
***This week and next week the CDC COVID-19 Science Update will only be produced on Tuesday, 11/10 and Tuesday, 11/17. The CDC COVID-19 Science Update will not be produced on Friday, 11/13, or Friday, 11/20.***
Here you can find all previous COVID-19 Science Updates.
PEER-REVIEWED
COVID-19 test result turnaround time for residents and staff in US nursing homesexternal icon. McGarry et al. JAMA Internal Medicine (October 30, 2020).
Key findings:
- From August 16 to September 16, 2020:
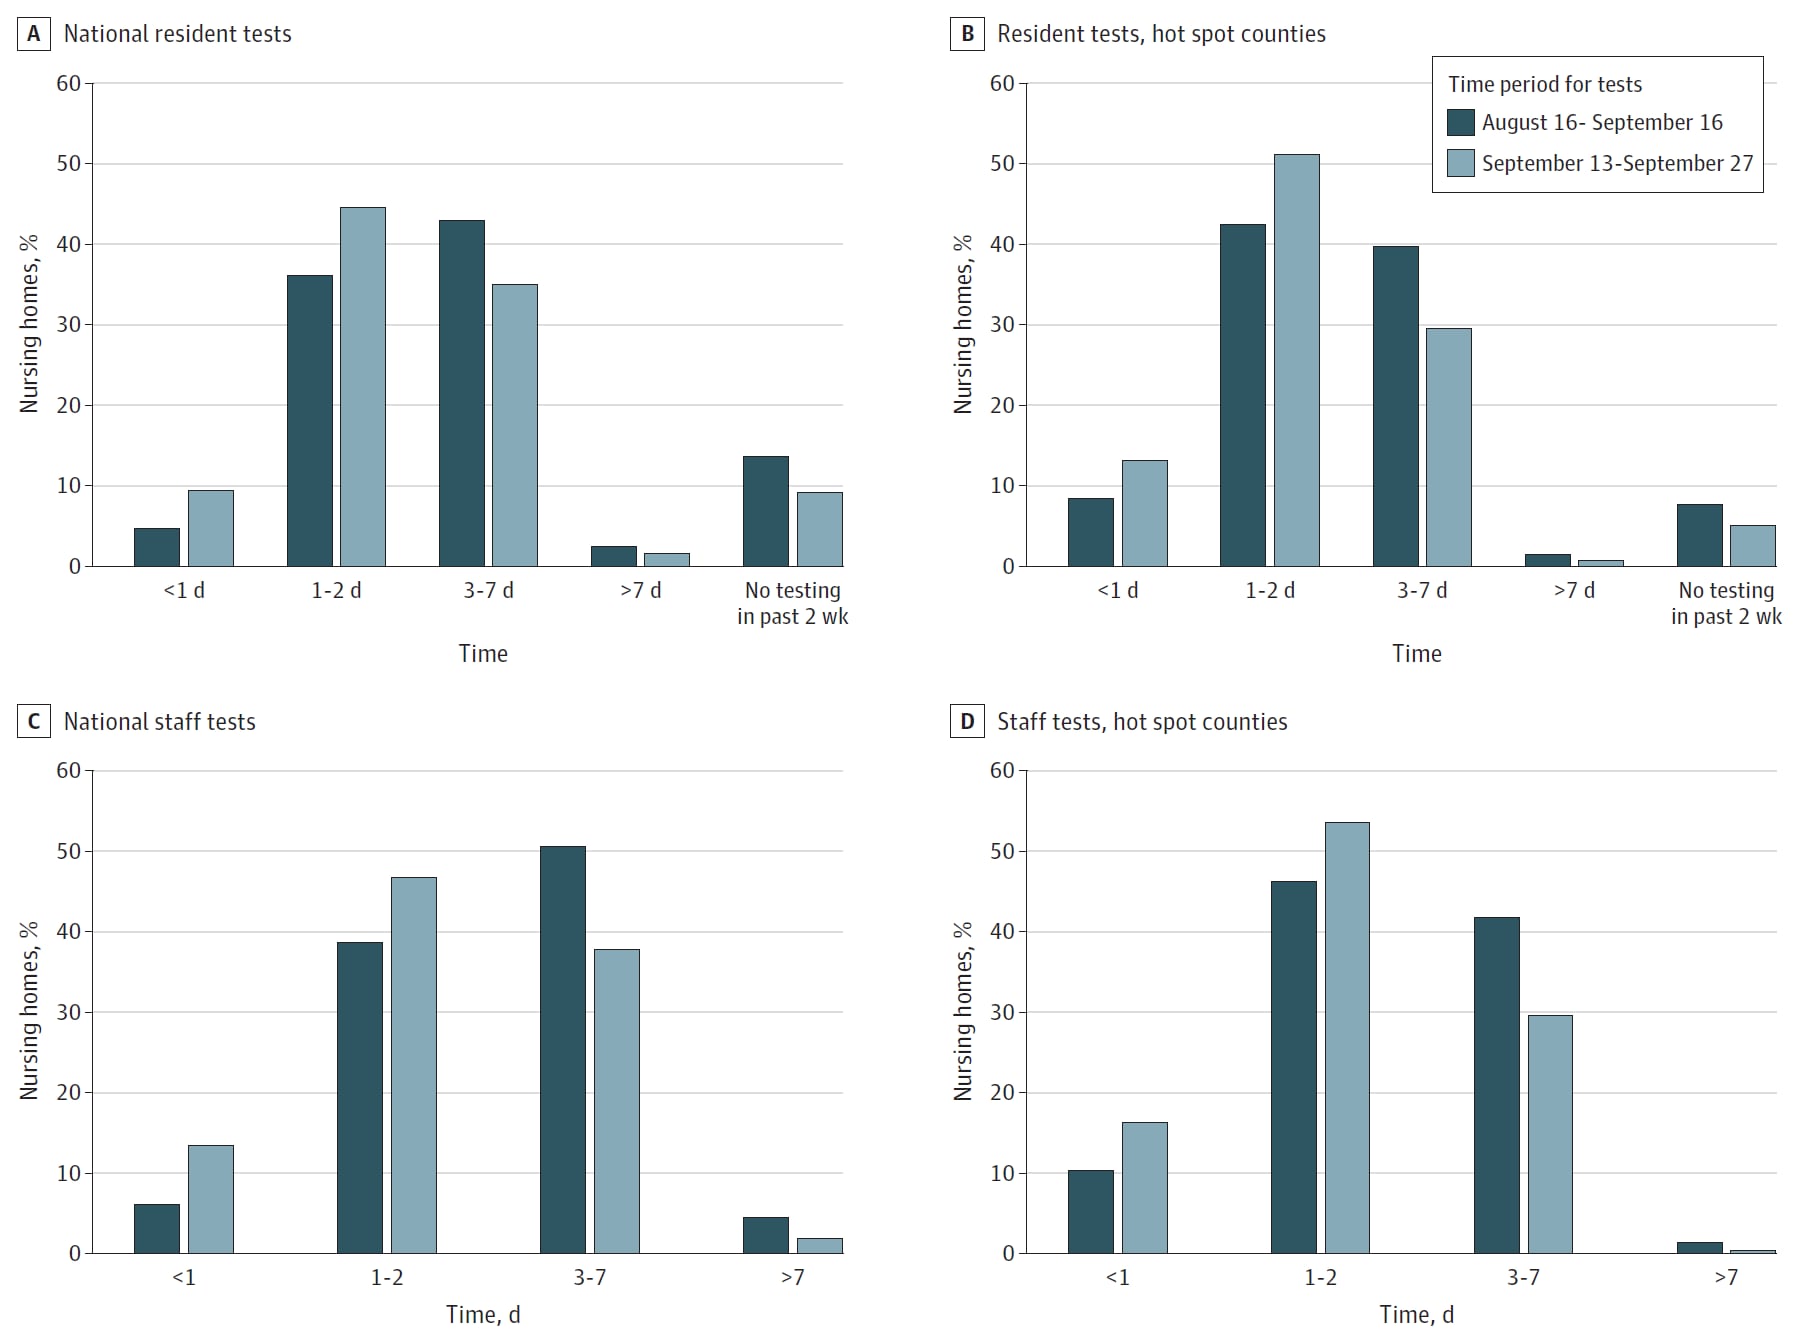
- Only 6.2% of skilled nursing facilities (SNF) had one-day turn-around times for SARS-CoV-2 tests for staff (Figure).
- Only 4.8% of SNF had one-day turn-around times for SARS-CoV-2 tests for residents (Figure).
- From September 13 to September 27, 2020:
- Only 13.5% of SNF had one-day test turn-around times for staff (Figure).
- Only 9.5% of SNF had one-day test turn-around times for residents (Figure).
- For SNF in hotspot areas, 43.3% and 41.3% had turn-around times ≥3 days for residents and staff, respectively (Figure).
Methods: Cross-sectional study of 15,065 SNF evaluating SARS-CoV-2 test turn-around times for residents and staff during two time-frames. Hotspot was defined as location in a county with recent increases in confirmed or suspected cases or with in inadequate testing. Limitations: Test turn-around time was reported by facilities; inability to differentiate between one- and two-day test turn-around time; lack of data on test type.
Implications: Testing in SNF does not meet the turn-around time of less than one day that modeling suggests is needed to prevent COVID-19 outbreaks, even in hotspot areas.
Figure:
Note: From McGarry et al. National distribution of staff and resident testing turn-around times in SNF from August 16 to September 16, 2020 and September 13 to September 27, 2020. Estimates are weighted by facility bed size. Reproduced with permission from JAMA Internal Medicine. McGarry et al. COVID-19 test result turnaround time for residents and staff in US nursing homes. DOI: 10.1001/jamainternmed.2020.7330. Copyright©2020 American Medical Association. All rights reserved.
A large national outbreak of COVID-19 linked to air travel, Ireland, summer 2020external icon. Murphy et al. Eurosurveillance. (October 22, 2020).
Key findings:
- 13 cases of COVID-19 were associated with a 7-hour, 17% occupancy flight to Ireland in the summer of 2020.
- The plausible in-flight attack rate ranged from 9.8%–17.8%.
- Secondary transmission to 46 non-passengers occurred in 6 of 8 regions of Ireland, for 59 total cases in this cluster (Figure).
- Genome sequencing of isolates from five cases traveling from three continents suggested the flight as a single point source of infection.
Methods: Investigation of a national outbreak associated with an airline flight. Close contact passengers were identified based on pre-flight contacts and airline seating arrangements. Limitations: Unable to determine with certainty the number of persons infected during the flight vs after the flight; unable to contact 11 passengers; seating chart may not reflect where passengers sat during the flight; the source case was not identified.
Implications: Rapid acquisition of flight manifests and inclusion of passenger transiting information may help limit transmission of infection from cases associated with airline travel.
Figure:
Note: From Murphy et al. Chains of transmission of 59 flight-related COVID-19 cases, Ireland, summer 2020. Regions are health regions within Ireland. Licensed under CC 4.0.
Residential context and COVID-19 mortality among adults aged 70 years and older in Stockholm: A population-based, observational study using individual-level data.external icon Brandén et al. Lancet Healthy Longevity (October 27, 2020).
Key findings:
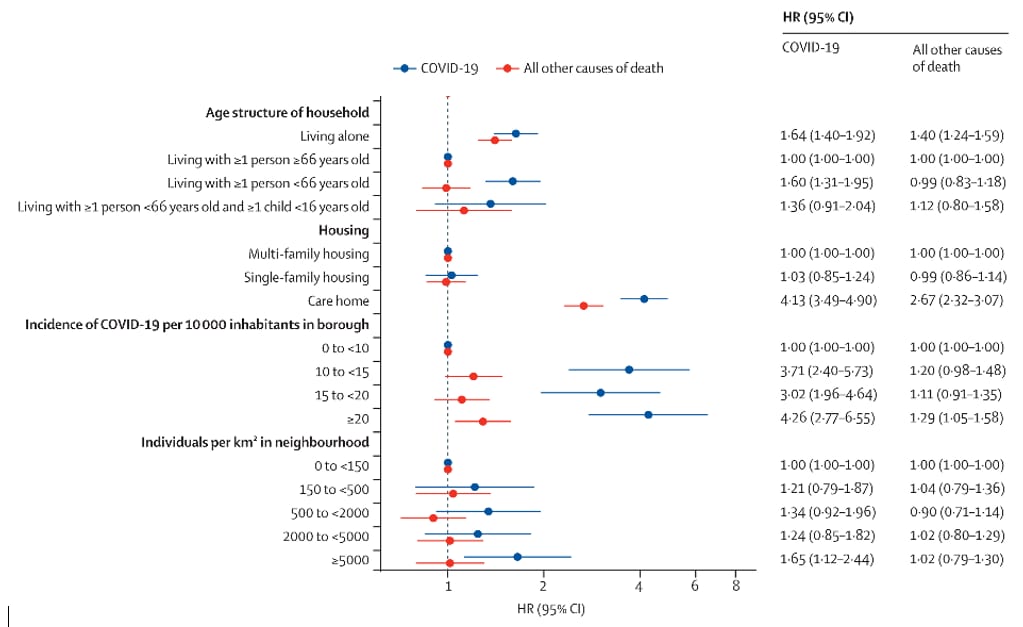
- Adults ≥70 years of age had increased risk for mortality from COVID-19 when (Figure):
- Living with working adults <66 years of age (hazard ratio [HR] 1.6, 95% CI 1.3-2.0).
- Living in elder care-homes (HR 4.1, 95% CI 3.5-4.9).
- Living in neighborhoods with population density ≥5,000 individuals per km² (HR 1.7, 95% CI 1.1-2.4).
- Living in neighborhoods with the highest numbers of confirmed COVID-19 cases (HR 4.3, 95% CI 2.3-6.6).
Methods: National data on total and COVID-19-related deaths (3,386 and 1,301, respectively) among 274,712 residents ≥70 years of Stockholm, Sweden between March 12 and May 8, 2020 were evaluated with housing type and size and neighborhood information. Limitations: Possibility of misclassifications in national database.
Implications: Neighborhood and living situation may impact COVID-19 risk for older adults, particularly living with younger family members and in neighborhoods with high incidence of COVID-19. As noted in a recent editorialexternal icon, sheltering older adults with working age family members, in multigenerational households, or in high incidence neighborhoods may not offer adequate protection from COVID-19.
Figure:
Note: Adapted from Brandén et al. Cox proportional hazard regression for death from COVID-19 and from all other causes among individuals ≥70 years. Licensed under CC 4.0.
Association between SARS-CoV-2 infection, exposure risk and mental health among a cohort of essential retail workers in the USAexternal icon. Lan et al. Occupational and Environmental Medicine (October 30, 2020).
Key findings:
- 20% of retail workers surveyed tested positive for SARS-CoV-2 by RT-PCR.
- The majority (76%) of positive workers were asymptomatic at the time of testing.
- Workers with direct customer exposure were more likely to test positive (OR 1, 95% CI 1.1-24.8).
- There was an inverse relationship between practicing social distancing consistently at work and both anxiety (OR 0.3, 95% CI 0.1-0.9) and depression (OR 2, 95% CI 0.03-0.99).
- Workers suffering from depression were more likely to commute by public transportation or share rides compared with those without depression (OR 0.1, 95% CI 0.02-7).
Methods: Survey of 104 adults employed at a single grocery retail store that included basic demographic information, SARS-CoV-2-related exposure, personal protective equipment usage and mental health status. Participants underwent clinical evaluation and nasopharyngeal swab testing in early May 2020. Limitations: Small sample size.
Implications: This study offers insight on the potential occupational risks of infection and mental health impact of COVID-19 on workers with customer interaction during early onset of the pandemic.
PEER-REVIEWED
Effectiveness of face masks in preventing airborne transmission of SARS-CoV-2.external icon Ueki et al. mSphere (October 21, 2020).
Key findings:
- Increasing distance between spreader and receiver decreased the number of infectious particles inhaled. (Figure 1).
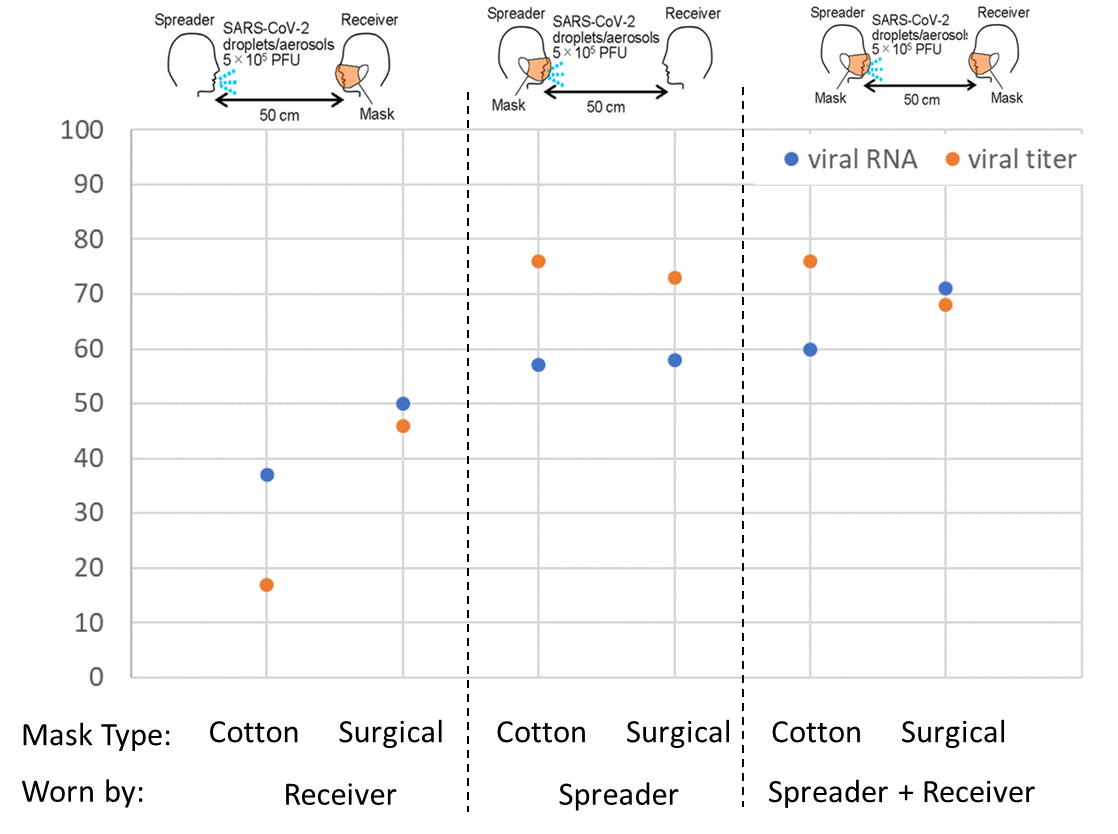
- Cloth and surgical mask-wearing (respectively) at a distance of 50 cm (1.6 feet) resulted in (Figure 2):
- 57%–58% and 73%–76% decrease in viral load and infectious virus titer, respectively, received when the spreader was masked.
- 37%–50% and 17%–47% decrease in viral load and infectious virus titer, respectively, received when the receiver was masked.
- 60%–71% and 68%–76% decrease in viral load and infectious virus titer, respectively, received when both the spreader and the receiver were masked.
Methods: Laboratory experiment using nebulized mist containing SARS-CoV-2 and human head models, one as spreader unit to simulate mild cough and one as receiver unit to simulate inhalation. Units were situated various distances apart and wore masks of different types in various combinations. Virus “inhaled” into the receiver unit was quantified by plaque assay (live virus) and qRT-PCR (viral RNA). Limitations: Limited number of conditions tested; mask fitting to head forms does not completely replicate fitting of masks to a human face.
Implications: Mask wearing by both those who are potentially transmitting infection and by those uninfected appears to provide the most protection from SARS-CoV-2, with surgical masks providing slightly better protection than cotton masks.
Figure 1
Note: Adapted from Ueki et al. Percentage reduction of viral titer and viral RNA by distance from spreader to receiver compared with 25 cm. Licensed under CC 4.0.
Figure 2
Note: Adapted from Ueki et al. Percentage reduction in viral titer and viral RNA with cotton or surgical masks worn by “receiver” alone, “spreader” alone, or both “receiver” and “spreader,” compared with no masks. Licensed under CC 4.0.
PREPRINTS (NOT PEER-REVIEWED)
Association of county-wide mask ordinances with reductions in daily COVID-19 incident case growth in a Midwestern region over 12 weeks.external icon Shacham et al. MedRxiv (October 30, 2020).
Key findings:
- The two counties with mandatory mask policies (M[+]) had lower rates of new COVID-19 cases than the three that did not (M[-]).
- In the three weeks preceding the mandatory mask policies, the average daily percent growth (ADPG) of reported COVID-19 cases was similar [0.90% for M(+) vs 1.27% for M(-), p = 0.269].
- At three weeks after implementation, the ADPG of COVID-19 cases was 1.08% for M(+) counties vs. 2.44% for M(-) counties.
- At 12 weeks after implementation, the ADPG of COVID-19 cases was 1.36% for M(+) counties vs. 2.42% for M(-) counties (p <0.001).
Methods: Longitudinal study in five metropolitan counties in St. Louis, MO, of COVID-19 cases diagnosed between June 12 and September 25, 2020. During the study period, two counties instituted mandatory mask policies while the other three did not. Limitations: This study may not be generalizable to other areas of the US; compliance with the mask policies unknown.
Implications: Mandatory mask wearing in public areas is an effective way to reduce COVID-19 transmission.
PEER-REVIEWED
SARS-CoV-2 seroprevalence and transmission risk factors among high-risk close contacts: A retrospective cohort studyexternal icon. Ng et al. Lancet Infectious Diseases (November 2, 2020).
Key findings:
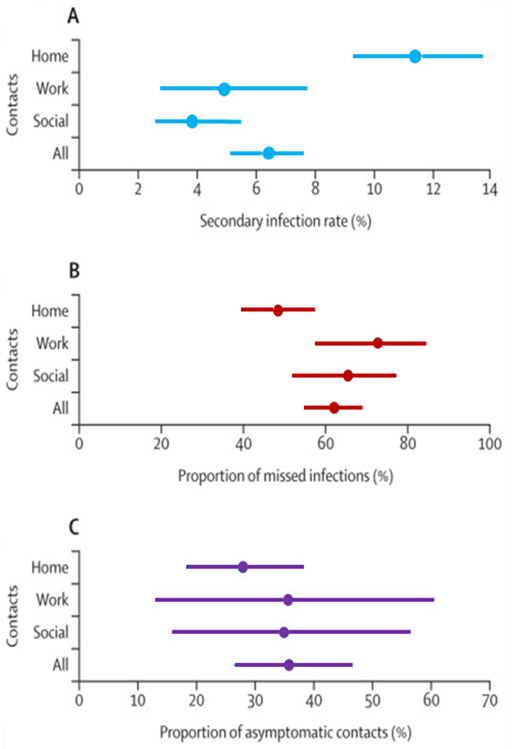
- Secondary infection rate was 11 (95% credible interval [CrI] 9–14) per 100 household contacts, 4 (95% CrI 3–5) per 100 social contacts, and 5 (95% CrI 3–8) per 100 work contacts (Figure).
- Symptom-based testing missed 62% (95% CrI 55%–69%) of COVID-19 infections overall with 48% (95% CrI 39%–57%) of COVID-19 infections missed in household contacts alone.
- 36% of confirmed COVID-19 cases in household contacts were asymptomatic.
Methods: Retrospective cohort study of 7,518 close contacts (1,779 household, 2,231 work, and 3,508 social contacts) of 1,114 COVID-19 RT-PCR-positive index cases, in Singapore, between January 23, 2020 and April 3, 2020. All index cases were hospitalized, and all close contacts were quarantined for 14 days and assessed for symptoms three times per day; PCR testing was performed if contacts reported symptoms. Limitations: Variable times from symptom onset to testing of close contact groups; <15% of contacts without a COVID-19 diagnosis consented to serologic testing and questionnaire completion at the end of quarantine.
Implications: Additional precautions are needed to the overcome increased transmission risk in household settings. Asymptomatic close contacts of confirmed COVID-19 cases should be routinely tested as this group may have SARS-CoV-2 infection and unknowingly contribute to ongoing secondary infections.
Figure:
Note: Adapted from Ng et al. Estimates of secondary infection rates, proportion of missed infections, and proportion of asymptomatic contacts among three subsets of close contacts (home/household, work, and social) of confirmed COVID-19 cases. Dots represent the mean and the lines show the 95% CrI for each category. Reprinted from The Lancet Infectious Diseases, Ng et al. SARS-CoV-2 seroprevalence and transmission risk factors among high-risk close contacts: A retrospective cohort study. DOI: https://doi.org/10.1016/S1473-3099(20)30833-1. Copyright (2020), with permission from Elsevier.
PEER-REVIEWED
SARS-CoV-2 neutralizing antibody LY-CoV555 in outpatients with COVID-19external icon. Chen et al. NEJM (October 28, 2020).
Key findings:
- Decreases from baseline in SARS-CoV-2 log viral load were:
- Greater in participants who received 2800 mg of LY-CoV555 than in those who received placebo (−0.53, 95% CI -0.98 to -0.08).
- Not significantly different between participants who received 700 mg or 7000 mg of LY-CoV555 and those who received placebo.
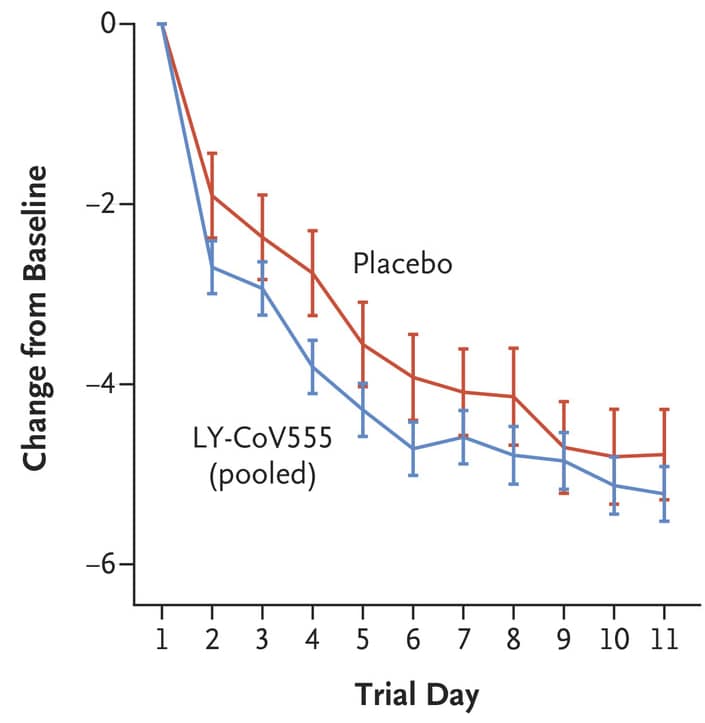
- Participants who received LY-CoV555 had less severe symptoms than those who received placebo (Figure).
- 1.6% of participants in the LY-CoV555 group and 6.3% in the placebo group had a COVID-19–related hospitalization or emergency department visit.
- No deaths were reported; one serious adverse event was reported in the placebo group.
Methods: Interim analysis of a phase 2 randomized, placebo-controlled trial evaluating neutralizing monoclonal antibody LY-CoV555 at 700 mg (n = 101), 2800 mg (n = 107), or 7000 mg (n = 101) vs placebo (n = 143) in outpatients with recently-diagnosed mild or moderate COVID-19. The primary outcome was change in RT-PCR viral load from baseline to Day 11. Secondary outcomes included reported symptom severity, COVID-19-related hospitalization or emergency department visit, and death. Limitations: SARS-CoV-2 viral load declines over time in most patients with COVID-19 and might not predict clinical disease course or of treatment effectiveness.
Implications: While another trial of LY-CoV555 was recently stopped given apparent lack of clinical benefit in hospitalized COVID-19 patientsexternal icon, LY-CoV555, known as banlanivimab, effects on early mild or moderate COVID-19 were effective enough for an FDA emergency use authorizationexternal icon issued November 9, 2020.
Figure:
Note: from Chen et al. Symptom scores from Day 2 to 11 in the LY-CoV555 group and the placebo group. The 𝙸 bars represent 95% CIs. From NEJM, Chen et al. SARS-CoV-2 neutralizing antibody LY-CoV555 in outpatients with COVID-19.DOI: 10.1056/NEJMoa2029849. Copyright © 2020 Massachusetts Medical Society. Reprinted with permission from Massachusetts Medical Society.
PEER-REVIEWED
Robust neutralizing antibodies to SARS-CoV-2 infection persist for months.external icon Wajnberg et al. Science (October 28, 2020).
Key findings:
- 30,082 (41%) potential convalescent plasma (CP) donors had detectable antibodies to the SARS-CoV-2 spike protein at titers of ≥1:80.
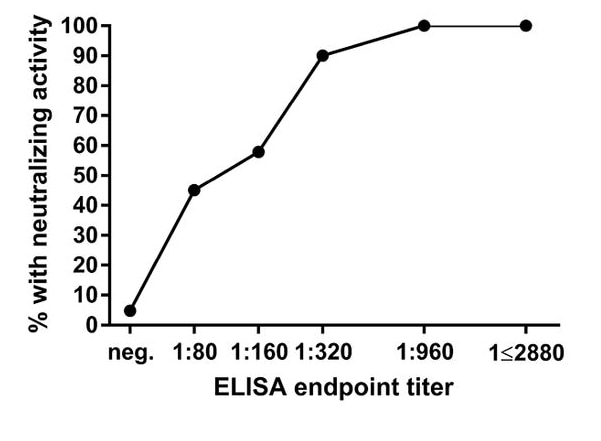
- Approximately 50% of sera with a titer of 1:80 or 1:160, 90% with a titer of 1:320, and all sera with a titer of ≥1:960 had neutralizing activity against SARS-CoV-2 (Figure 1).
- Among 121 CP donors, titers decreased from a geometric mean titer (GMT) of 764 at initial collection to 690 at the first follow-up collection and 404 at the second follow-up (Figure 2).
- Only three individuals had no detectable titers at a follow-up time point.
- All three had baseline titers of 1:80.
Methods: Serum samples from 72,401 potential CP donors were screened for antibodies to the SARS-CoV-2 spike protein and 120 samples were tested for neutralizing activity Limitations: Proportion of CP donors with confirmed SARS-CoV-2 infection unknown (potential donors had RT-PCR-confirmed SARS-CoV-2, exposure to someone with confirmed SARS-CoV-2 infection, or suspected COVID-19).
Implications: Antibody responses to SARS-CoV-2 might be durable for at least three to five months. Antibody titers of ≥1:320 against the SARS-CoV-2 spike protein might correlate with protection from SARS-CoV-2, which could serve as a measurable outcome to assist in vaccine development.
Figure 1
Note: From Wajnberg et al. Figure 1. Proportion of sera with any neutralizing activity stratified by enzyme-linked immunosorbent assay (ELISA) titer for detectible antibodies to the SARS-CoV-2 spike protein
Figure 2
Note: Adapted from Wajnberg et al. . GMT of sera from initial (at approximately 30 days post symptom onset) and follow-up collection. From Wajnberg et al., Robust neutralizing antibodies to SARS-CoV-2 infection persist for months, Science. Reprinted with permission from AAAS
Repeat COVID-19 molecular testing: Correlation of SARS-CoV-2 culture with molecular assays and cycle thresholdsexternal icon. Gniazdowski et al. Clinical Infectious Diseases (October 27, 2020).
Key findings:
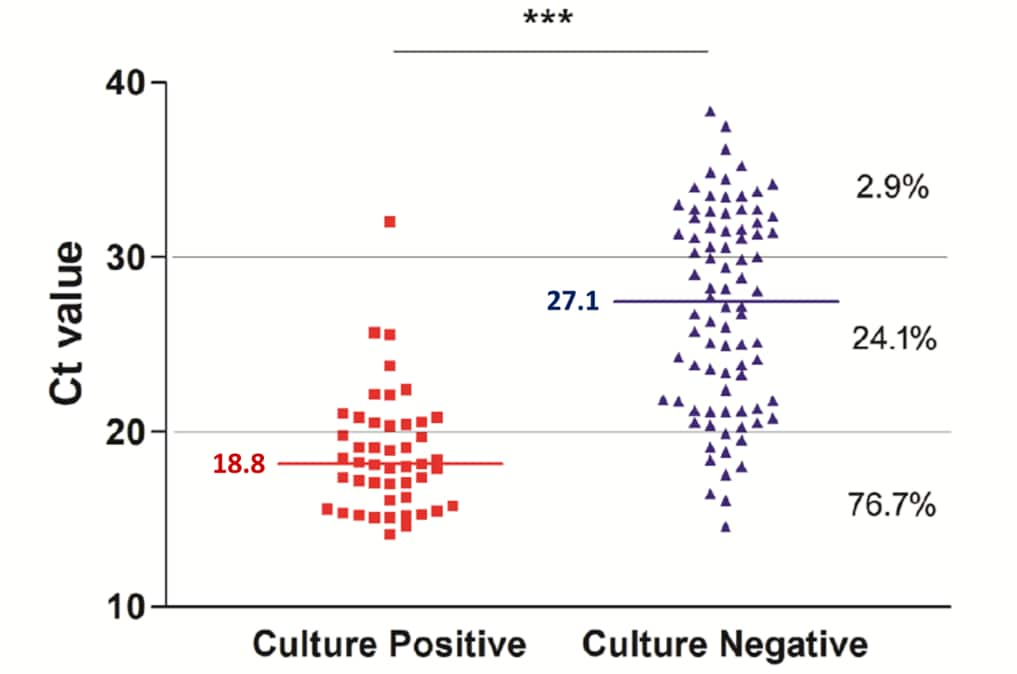
- The proportion of specimens from which SARS-CoV-2 was isolated was lower with increasing mean Ct values (Figure).
- Mean Ct values were significantly lower for specimens with virus growth in culture than for specimens without virus growth (18.8 vs 27.1, p <0.0001).
- In 29 patients with multiple specimens, Ct values increased over time, indicating decreasing viral load.
- Infectious virus was recovered from 4 (13.8%) specimens 22 days after the first positive result.
- 124 patients with a negative PCR test had a subsequent positive test, but with high Ct values (≥29.5) and no culturable virus.
Methods: Retrospective review of data from patients with known or suspected COVID-19 who underwent SARS-CoV-2 testing from March 11 to May 11, 2020. Remnant NP swab specimens were selected for further testing, including PCR and cell culture. Multiple specimens were taken up to 23 days after initial test in subset. Limitations: Small, retrospective, single-center study.
Implications: Lower Ct values, which indicate a higher viral load and increased likelihood of viral growth, might be used to predict the likelihood that a patient is infectious. Caution is needed however given virus grew in cell culture from specimens with Ct values as high as 32.1. Repeated testing in patients without new symptoms is unlikely to identify individuals likely to be infectious as defined by the presence of culturable live virus.
Figure:
Note: From Gniazdowski et al. Correlation between Ct values and presence or absence of SARS-CoV-2 growth on cell culture. The percent of samples with viral growth with the given Ct range is shown on the right. Horizonal bars and numbers show median Ct values in culture-positive and culture-negative specimens. Licensed under CC-BY-NC-ND.
- Hodgson et al. What defines an efficacious COVID-19 vaccine? A review of the challenges assessing the clinical efficacy of vaccines against SARS-CoV-2external icon. Lancet Infectious Diseases. Outlines the myriad ways a vaccine can prevent deaths from COVID-19.
Figure:
Note: From Hodgson et al. X marks places on the transmission path where a vaccine may interrupt the spread of SARS-CoV-2 and prevent COVID-19 deaths. Reprinted from The Lancet Infectious Diseases, Hodgson et al. What defines an efficacious COVID-19 vaccine? A review of the challenges assessing the clinical efficacy of vaccines against SARS-CoV-2. DOI: https://doi.org/10.1016/S1473-3099(20)30773-8. Copyright (2020), with permission from Elsevier.
- Meyers et al. Lowering the transmission and spread of human coronavirus.external icon Journal of Medical Virology. A 1% baby shampoo nasal rinse solution (two-minute contact time) and several mouthwashes (30-second contact time) inactivated human coronavirus infectivity >99.9%.
- Bedford et al. Viral genome sequencing places White House COVID-19 outbreak into phylogenetic context.external icon MedRxiv. Sequencing of isolates from two individuals with exposures linked to the White House COVID-19 outbreak identified a constellation of mutations that may make it possible to identify infections that likely descend from this cluster.
- Krause et al. Maintaining confidentiality of emerging results in COVID-19 vaccine trials is essentialexternal icon. Lancet. Editorial discussing that emerging data from trials of candidate COVID-19 vaccines cannot be disclosed in ways that influence the design or conduct of trials and potentially bias the results.
- Halabi et al. No-fault compensation for vaccine injury — The other side of equitable access to COVID-19 vaccinesexternal icon. NEJM. Discusses options for compensating individuals adversely affected by COVID-19 vaccines by modifying various systems already in place by WHO and certain countries.
- Holt, E. Slovakia to test all adults for SARS-CoV-2external icon. Lancet. Slovakia plans to respond to the recent rapid rise in positive cases by testing all adults for SARS-CoV-2; the logistical and technical challenges of this are discussed.
- Pang et al. Cold-chain food contamination as the possible origin of COVID-19 resurgence in Beijing.external icon National Science Review. An epidemiological investigation of a June 2020 outbreak in a covered wholesale food market in Beijing traced the source to a booth selling salmon, suggesting frozen seafood as a potential fomite for reintroducing SARS-CoV-2 into a community.
- Li & Cheung. The proportion of adult Americans at risk of severe COVID-19 illness.external icon Journal of General Internal Medicine. Based on the prevalence of risk factors such as obesity, hypertension, diabetes mellitus, chronic kidney disease, or chronic obstructive pulmonary disorder, >75% of Americans are at risk of severe COVID-19.
Disclaimer: The purpose of the CDC COVID-19 Science Update is to share public health articles with public health agencies and departments for informational and educational purposes. Materials listed in this Science Update are selected to provide awareness of relevant public health literature. A material’s inclusion and the material itself provided here in full or in part, does not necessarily represent the views of the U.S. Department of Health and Human Services or the CDC, nor does it necessarily imply endorsement of methods or findings. While much of the COVID-19 literature is open access or otherwise freely available, it is the responsibility of the third-party user to determine whether any intellectual property rights govern the use of materials in this Science Update prior to use or distribution. Findings are based on research available at the time of this publication and may be subject to change.

