COVID-19 Science Update released: August 13, 2021 Edition 102

The COVID-19 Science Update summarizes new and emerging scientific data for public health professionals to meet the challenges of this fast-moving pandemic. Weekly, staff from the CDC COVID-19 Response and the CDC Library systematically review literature in the WHO COVID-19 databaseexternal icon, and select publications and preprints for public health priority topics in the CDC Science Agenda for COVID-19 and CDC COVID-19 Response Health Equity Strategy.
Section headings in the COVID-19 Science Update align with the CDC Science Agenda for COVID-19.
Section headings in the COVID-19 Science Update have been changed to align
with the CDC Science Agenda for COVID-19.
Here you can find all previous COVID-19 Science Updates.
PREPRINTS (NOT PEER-REVIEWED)
Vaccinated and unvaccinated individuals have similar viral loads in communities with a high prevalence of the SARS-CoV-2 delta variantexternal icon. Riemersma et al. medRxiv (July 31, 2021).
Key findings:
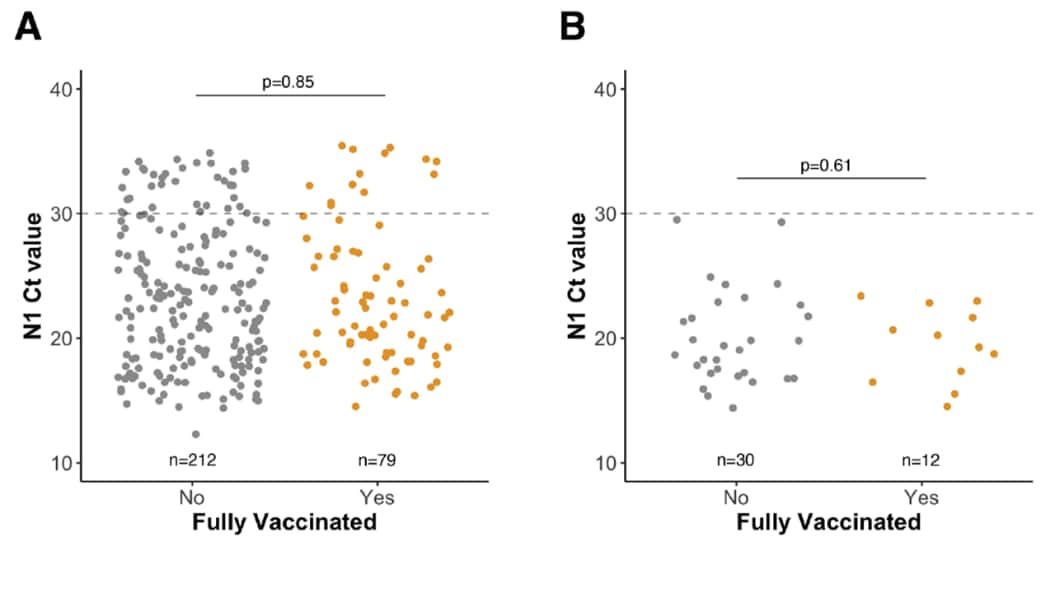
- Analysis of RT-PCR positive specimens collected across Wisconsin from June 28–July 24, 2021 showed that fully vaccinated and unvaccinated individuals had similar mean Ct values, with 84% (42/50) of sequenced specimens confirmed as Delta (B.1.617.2) (Figure).
- 28.5% (83/291) of specimens were from Dane County, where 88% (14/16) of specimens sequenced were confirmed as Delta. Even in this highly vaccinated community, no significant difference in Ct value was found between vaccinated and unvaccinated individuals.
Methods: Ct values were determined for 291 patient specimens (n = 212 unvaccinated; n = 79 vaccinated) across 11 Wisconsin counties, including many from Dane County, where vaccination and testing rates are among the highest in the United States. Limitations: Vaccination status was self-reported.
Implications: Non-pharmaceutical interventions, such as masking and distancing, are needed to help prevent transmission of the Delta variant from both vaccinated and unvaccinated individuals.
Figure:
Note: Adapted from Riemersma et al. Viral loads by vaccination status. A) N1 Ct values for all SARS-CoV-2-positive specimens. B) N1 Ct values for subset of SARS-CoV-2-positive specimens confirmed to be Delta variants. (Not fully vaccinated; fully vaccinated). Dashed lines represent the threshold for consistent recovery of infectious virus and Ct cutoff for sequencing. Licensed under CC-BY-NC 4.0.
Correlation of SARS-CoV-2 breakthrough infections to time-from-vaccine; preliminary studyexternal icon. Mizrahi et al. medRxiv (July 31, 2021). Published in Nature Communications as Correlation of SARS-CoV-2-breakthrough infections to time-from-vaccineexternal icon (November 4, 2021).
Key findings:
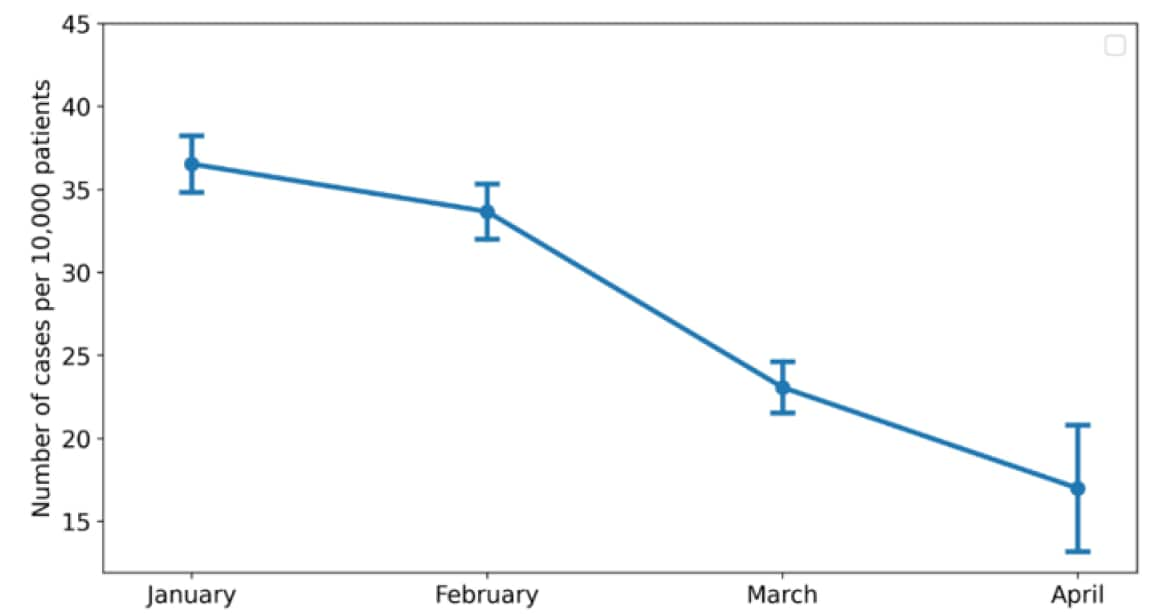
- After Delta variants became predominant in Israel in June 2021, persons fully vaccinated with BNT162b2 in January 2021 had higher incidence (36.50 per 10,000) and significantly increased odds of SARS-CoV-2 breakthrough infections (Figure) compared with persons vaccinated in later months:
- February: 33.65 per 10,000 (adjusted odds ratio [aOR] 1.33, 95% CI 1.21-1.46).
- March: 23.06 per 10,000 (aOR 1.65, 95% CI 1.44-1.89).
- April: 16.98 per 10,000 (aOR 2.26, 95% CI 1.70-3.01).
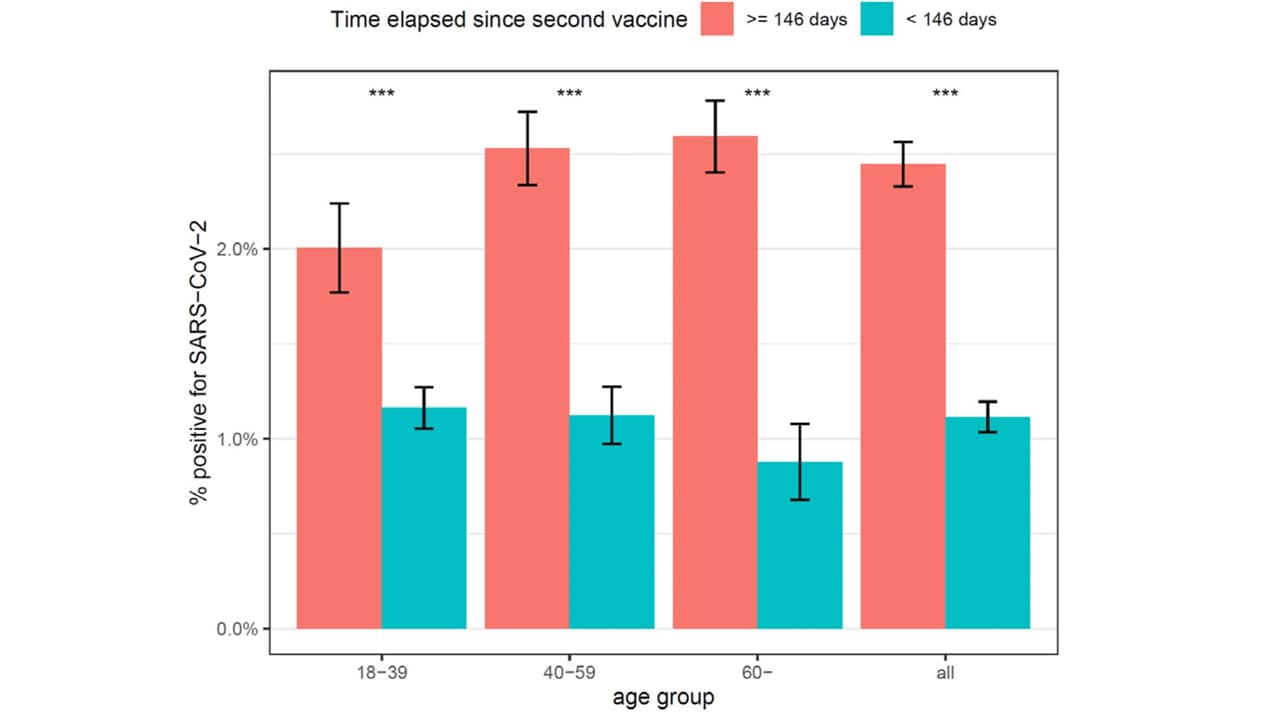
- In age-stratified analyses of early versus late vaccinees, similar results were seen across all age groups.
Methods: Retrospective cohort study in Israel comparing incidence of breakthrough infections (positive PCR test result for SARS-CoV-2 from June 1–July 27, 2021) among 1,352,444 fully vaccinated persons (BNT162b2, Pfizer/BioNTech) aged ≥16 years in a large health maintenance organization, by month of vaccination. Cohort matched 1:1 by age and other demographics; analyses adjusted for comorbidities. Limitations: Potential unmeasured or residual confounders; disease severity not assessed.
Implications: Risk of infection with the Delta variant might be higher with longer time since initial vaccination. Additional analyses are needed to assess effect of time since vaccination on risk of symptomatic infection, hospitalization, or death, and to define any populations at risk for severe outcomes.
Figure:
Note: Adapted from Mizrahi et al. Breakthrough SARS-CoV-2 infections by month of administration of the 2nd dose of BNT162b2 vaccine in Israel. Bars indicate 95% confidence intervals. Licensed under CC-BY-NC-ND 4.0.
Note: Adapted from Israel et al. Breakthrough SARS-CoV-2 infections, by time elapsed since 2nd BNT162b2 vaccine dose in Israel. (≥146 days, <146 days). ***p<0.001. Licensed under CC-BY-NC-ND 4.0.
Virological and serological kinetics of SARS-CoV-2 Delta variant vaccine-breakthrough infections: a multi-center cohort studyexternal icon. Chia et al. medRxiv (July 31, 2021). Published in Clinical Microbiology and Infectionexternal icon (November 23, 2021).
Key findings:
- Among 218 adults infected with Delta (B.1.617.2) in Singapore, 71 (33%) were fully vaccinated.
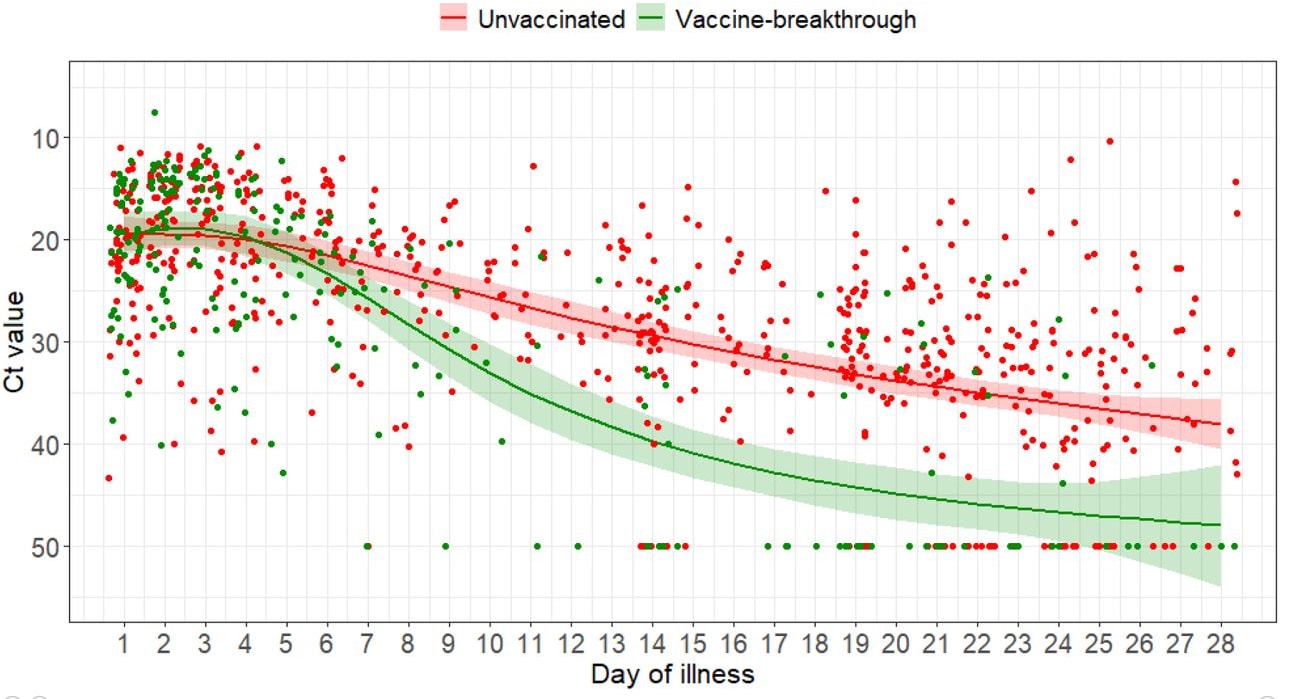
- Ct values were initially similar between vaccinated and unvaccinated individuals, and improved faster among vaccinated individuals as infection progressed (Figure).
- Vaccinated individuals had reduced odds of severe COVID-19 (aOR 0.073) compared with unvaccinated individuals.
Methods: Adults with confirmed Delta infection hospitalized in Singapore (April–June 2020) were evaluated. Breakthrough infection defined as PCR-confirmed SARS-CoV-2 infection ≥14 days after 2nd dose of BNT162b2 (Pfizer/BioNTech) or mRNA-1273 (Moderna) mRNA COVID-19 vaccine. Limitations: Small study; all participants were symptomatic and hospitalized; vaccinated group was older than unvaccinated group.
Implications: Fully vaccinated adults infected with the Delta variant had a faster decline in viral load, implying a shorter duration of viral shedding during hospitalization, compared with unvaccinated adults.
Figure:
Note: Adapted from Chia et al. SARS-CoV-2 Ct values over time in vaccinated (breakthrough) and unvaccinated hospitalized adults in Singapore. Shading indicates 95% confidence interval around regression line. Licensed under CC-BY-NC-ND 4.0.
PREPRINTS (NOT PEER-REVIEWED)
REACT-1 round 13 final report: exponential growth, high prevalence of SARS-CoV-2 and vaccine effectiveness associated with Delta variant in England during May to July 2021pdf iconexternal icon. Elliott et al. Imperial College London Working Paper (August 4, 2021).
Key findings:
- In England, a 4-fold increase in SARS-CoV-2 prevalence from 0.15% in round 12 (May 20–June 7, 2021) to 0.63% in round 13 (June 24–July 12, 2021) was driven by at least 2 factors:
- Rise in Delta (B.1.617.2) variant to 100% of specimens in round 13.
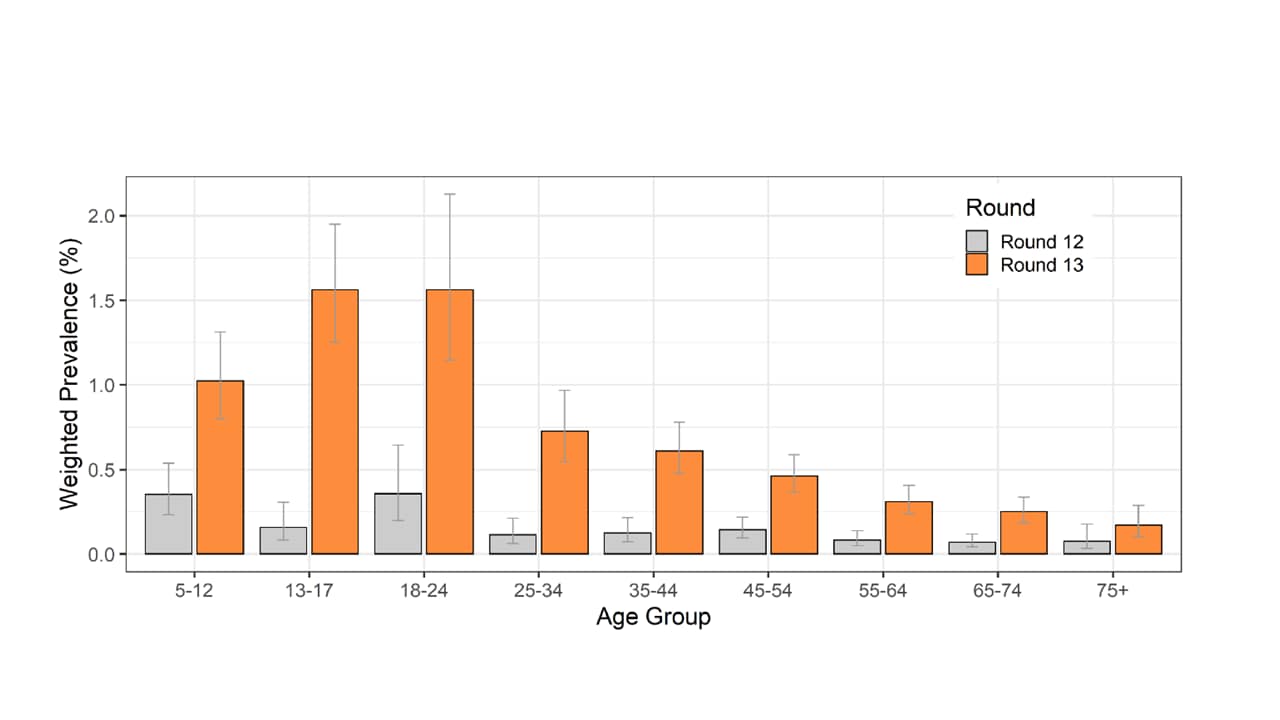
- Increased infections among younger, less vaccinated age groups; for example, from 0.16% to 1.56% among children aged 13–17 years (Figure).
- Of all infections, 29% occurred in fully vaccinated persons in round 12 vs. 44% in round 13.
- Estimated 2-dose vaccine effectiveness among adults aged 18–64 years decreased from 64% to 49% from round 12 to 13; however, median Ct values remained higher for vaccinated persons compared with unvaccinated persons (27.6 vs. 23.1, respectively).
Methods: REACT (REal-time Assessment of Community Transmission) is a series of cross-sectional population studies across England, where vaccine uptake is high. Valid RT-PCR results were obtained from 108,911 participants in round 12 and 98,233 participants in round 13 recruited as non-overlapping random samples aged 5 years and above. Limitations: Vaccination status was self-reported.
Implications: Reduced vaccine effectiveness may result in increased breakthrough infections when social mixing increases in the presence of the Delta variant. Vaccination of younger age groups could substantially reduce transmission. Higher Ct values among vaccinated people might reflect their immune response to Delta over the days following infection. In contrast to other studies (e.g., Riemersma et al.external icon, Brown et al.) that tended to sample closer to symptom onset, when both vaccinated and unvaccinated people have high viral loads with Delta, Elliott et al. sampled the population randomly, so results reflect different points in the course of infection.
Figure:
Note: Adapted from Elliot et al. SARS-CoV-2 weighted prevalence by age group for survey round 12 and round 13 in England. Bars show 95% confidence intervals. Permission request in process.
Comparable neutralization of SARS-CoV-2 Delta AY.1 and Delta in individuals sera vaccinated with BBV152external icon. Yadav et al. bioRxiv (Aug 1, 2021). Published in Journal of Travel Medicineexternal icon (September 28, 2021).
Key findings:
- Antibody neutralization of B.1.617.2, AY.1, and B.1.617.3, respectively, was lower among vaccinated COVID-naïve (1.3, 1.5, 1.9-fold reduction), COVID-recovered (2.5, 3.5, 3.8-fold), and breakthrough cases (1.9, 2.8, 3.5-fold), compared with the earlier B.1 variant. (Figure)
Methods: Neutralizing antibody responses to SARS-CoV-2 Delta variants (B.1.617.2, AY.1) and B.1.617.3 were examined in sera of persons fully vaccinated with BBV152 (a whole-virion inactivated SARS-CoV-2 vaccine used for mass vaccination in India) who were COVID naïve (n = 42), COVID recovered (n = 14) or a breakthrough case (n = 30). Antibody responses were determined 2–70 weeks post-2nd vaccine dose and compared with responses to the B.1 variant. Limitations: Small sample sizes.
Implications: BBV152-induced antibody response was reduced against SARS-CoV-2 Delta variants compared to against B.1, but neutralizing titers appeared sufficiently high to neutralize the Delta variants.
Figure:
Note: Adapted from Yadav et al. Antibody neutralization of SARS-CoV-2 B.1, Delta, Delta AY.1, and B.1.617.3 strains from sera of persons vaccinated with 2 doses of BBV152 who were either A) COVID naïve, B) COVID-recovered, or C) breakthrough case. PRNT50 = geometric mean neutralization titer. Dotted line indicates the assay limit of detection. Licensed under CC-BY-NC-ND 4.0.
PEER-REVIEWED
Illness duration and symptom profile in symptomatic UK school-aged children tested for SARS-CoV-2external icon. Molteni et al. The Lancet Child & Adolescent Health (August 3, 2021).
Key findings:
- Children aged 5–17 years experienced median illness duration of 6 days (5 days in ages 5–11 years; 7 days in ages 12–17 years). Most common symptoms were headache (62.2%) and fatigue (55.0%).
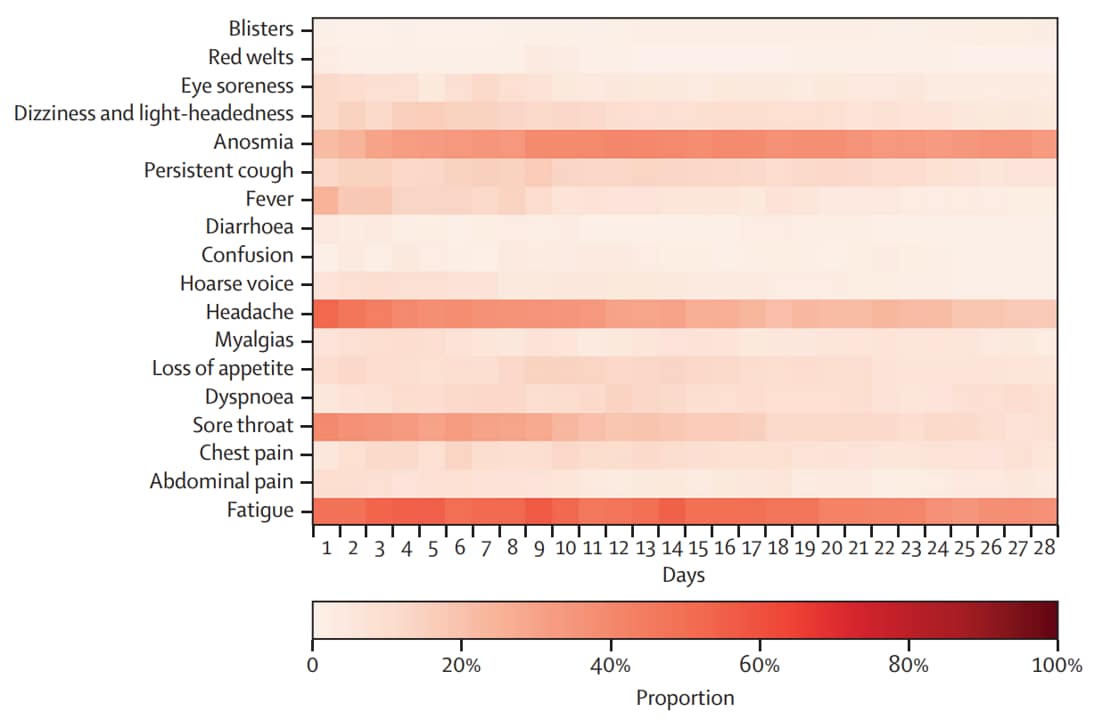
- Among children with symptoms lasting ≥28 days (4.4%), most reported headache (77.9%) and sore throat (74.0%) early, anosmia (77.9%) later, and persistent fatigue (84.4%) during illness progression (Figure). Most symptoms resolved within 8 weeks.
Methods: In a prospective cohort study of 258,790 children in 4 countries in the United Kingdom, 1,734 children with a positive SARS-CoV-2 test result during September 2020–February 2021 reported symptoms beginning 1 week before through 2 weeks after positive PCR or lateral flow antigen test result. Limitations: Voluntary participation in citizen science; adult proxy reporting of symptoms.
Implications: Although COVID-19 duration is usually short in children, some children experience prolonged illness.
Figure:
Note: Adapted from Molteni et al. Signs and symptoms reported in children tested for SARS-CoV-2 with symptoms lasting ≥28 days. Darker red indicates higher proportion of children. Licensed under CC BY.
PEER-REVIEWED
Outbreaks of COVID-19 variants in US prisons: a mathematical modelling analysis of vaccination and reopening policiesexternal icon. Ryckman et al. The Lancet (August 6, 2021).
Key findings:
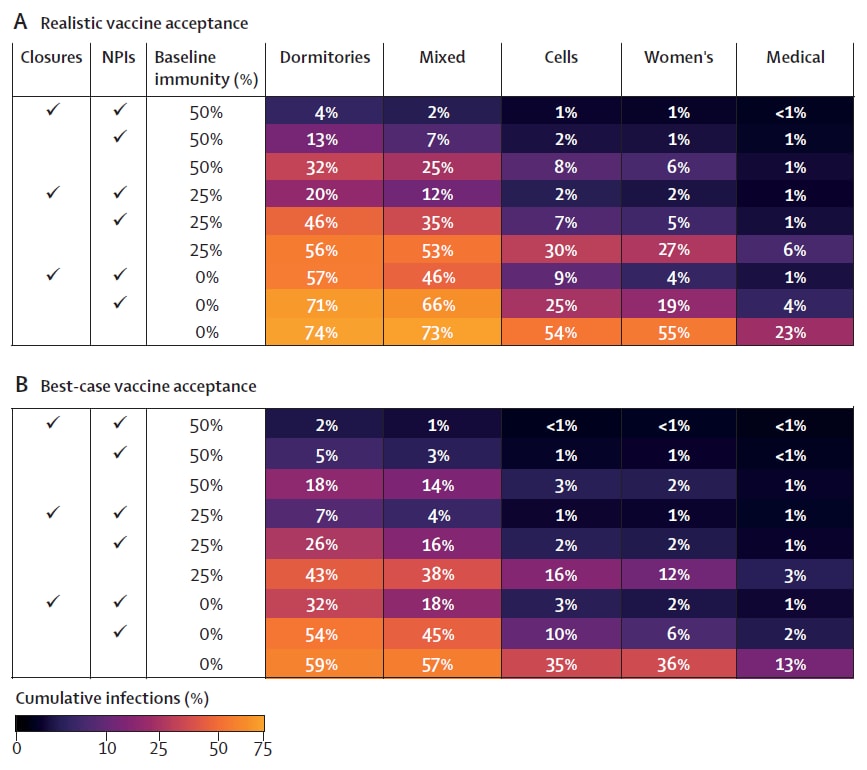
- In a simulation model of SARS-CoV-2 transmission in a prison assuming moderate vaccination coverage (36%–76% for residents, 40% for staff), no non-pharmaceutical intervention (NPI), and no baseline immunity, 200-day cumulative risk of infection after introduction of a new variant would be 74% for dormitories and 54% for cells (Figure).
- Layering NPIs assumed to be 75% effective would reduce cumulative risk of infection to 71% for dormitories and 25% for cells.
- Achieving a best-case scenario of 90% vaccination along with 75% effective NPIs would further reduce cumulative risk of infection to 54% for dormitories and 10% for cells.
- Hospitalization rate per 1,000 residents in prisons with moderate vaccination coverage, no NPIs, and no baseline immunity by occupancy type would be 12 for dormitories and 5 for cells.
- 90% vaccination would reduce hospitalization rate to 6 for dormitories and 2 for cells.
Methods: Data from the California Department of Corrections and Rehabilitation, including occupancy type (e.g., cells and dormitories) and daily resident information from January 2020–May 2021 were used to model how key factors including vaccination coverage, baseline immunity, NPIs, and activity closure (e.g., work, schooling, and visitation) would impact 200-day cumulative risk of infection, hospitalization and death from COVID-19 after introduction of a single SARS-CoV-2 variant infection. Limitations: New admissions, releases, transfers, and waning immunity were not assessed; findings might not be generalizable.
Implications: SARS-CoV-2 variants could spread rapidly in group settings such as correctional facilities. High vaccination coverage and effective NPIs, along with ongoing screening and testing, might slow transmission.
Figure:
Note: Adapted from Ryckman et al. Cumulative infections among prison residents by occupancy type across 500 model simulations over 200 days after introduction of a single variant infection, by in-person activity status, use of NPIs, and baseline immunity. A) More realistic scenario assuming lower vaccine coverage (36%–76% for residents, 40% for staff) and NPIs assumed to be 75% effective. B) Best-case scenario assuming 90% vaccine coverage for residents. Licensed under CC-BY-NC-ND.
Vaccines
- Thrombosis and thrombocytopenia after vaccination against and infection with SARS-CoV-2: a population-based cohort analysis.external icon Burn et al. medRxiv (Preprint; August 2, 2021). In the United Kingdom, pulmonary embolism was more common (standardized incidence ratio [SIR] 15.3) with SARS-CoV-2 infection (n = 299,311) than after vaccination (SIR 1.2) after BNT162b2 (Pfizer/BioNTech) (n = 1.7 M) or ChAdOx1 (Oxford/AstraZeneca) (n = 1.9 M). Rates of deep vein thrombosis and arterial thrombosis were similar among vaccinated persons and the general population.
- COVID-19 vaccine type and humoral immune response in patients receiving dialysis.external icon Garcia et al. medRxiv (Preprint; August 4, 2021). Published in Journal of the American Society of Nephrologyexternal icon (January 2022). Of 2,099 fully vaccinated patients receiving dialysis, 62% received mRNA-1273 (Moderna), 20% BNT162b2 (Pfizer/BioNTech), and 18% Ad26.COV2.S (Johnson & Johnson/Janssen) COVID-19 vaccines. At 28–60 days post-vaccination, 7% of patients had not seroconverted, including 33% who received Ad26.COV2.S vaccine.
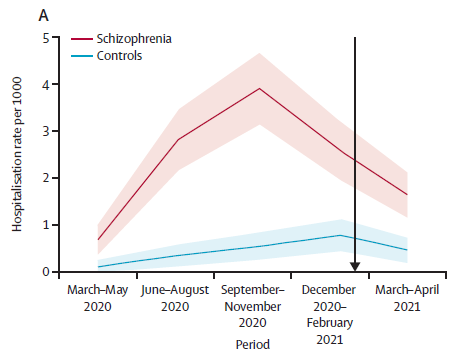
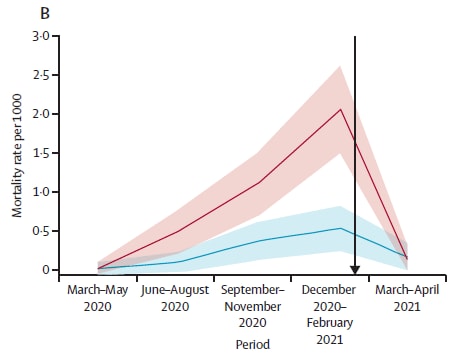
- COVID-19 hospitalisation, mortality, vaccination, and postvaccination trends among people with schizophrenia in Israel: a longitudinal cohort study. external iconBitan et al. The Lancet Psychiatry (August 5, 2021). In a longitudinal cohort study (n = 51,078) through April 2021, people with schizophrenia had increased risks of hospitalization (hazard ratio [HR] 4.81, 95% CI 3.57-6.48) and death (HR 2.52, 95% CI 1.64-3.85) compared with controls. Fewer people with schizophrenia (50.6%) than controls (52.8%) were fully vaccinated.
Note: Adapted from Bitan et al. A) Hospitalization and B) mortality per 1,000 people with schizophrenia or controls. Shaded areas are 95% CI. Black arrow represents COVID-19 vaccination plan start in Israel. Reprinted from The Lancet Psychiatry, online August 5, 2021, Bitan et al., COVID-19 hospitalisation, mortality, vaccination, and postvaccination trends among people with schizophrenia in Israel: a longitudinal cohort study. Copyright 2021, with permission from Elsevier.
Variants
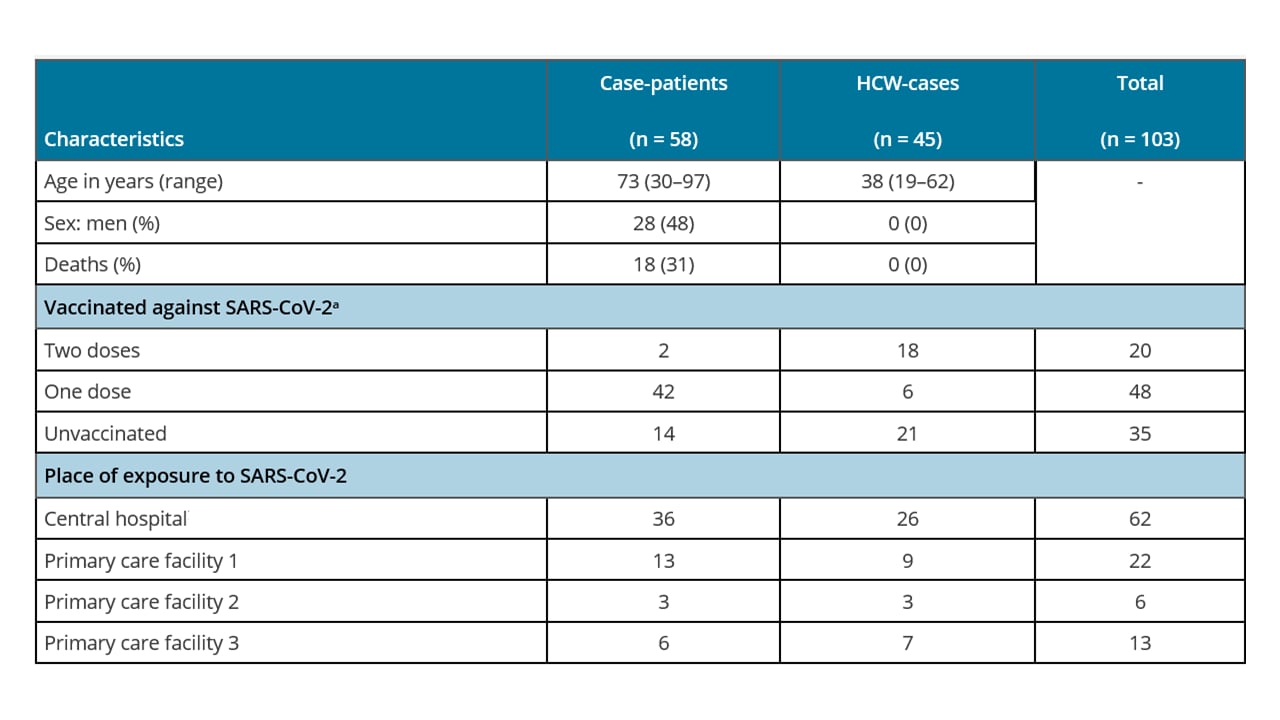
- An outbreak caused by the SARS-CoV-2 Delta variant (B.1.617.2) in a secondary care hospital in Finland, May 2021external icon. Hetemäki et al. Euro Surveillance (July 29, 2021). In May 2021, an outbreak in a Finnish hospital linked to a single patient with Delta (B.1.617.2) spread to 3 other healthcare facilities, resulting in 103 infections among 58 patients and 45 healthcare workers (HCW), with 18 deaths. Despite reported use of personal protective equipment (PPE), breakthrough infections occurred among 24 fully or partially vaccinated HCWs, >90% with BNT162b2 (Pfizer/BioNTech) vaccine. Findings suggest the need to bolster prevention strategies in healthcare settings, including vaccination as well as correct and consistent use of PPE.
Note: Adapted from Hetemäki et al. Characteristics of infected patients and healthcare workers in a hospital outbreak of Delta (B.1.617.2) in Finland, May 2021. a >90% vaccinated with BNT162b2 vaccine. Licensed under CC BY 4.0.
Natural History, Reinfection, and Health Impact
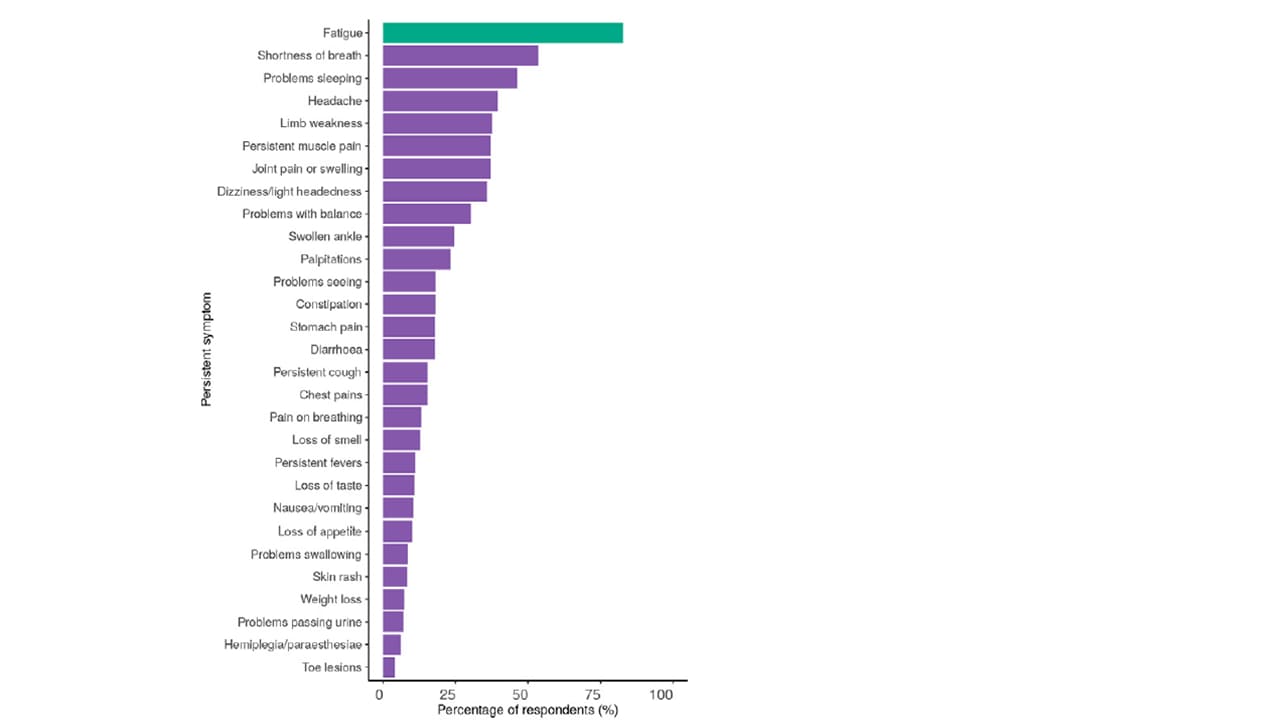
- Long Covid in adults discharged from UK hospitals after COVID-19: A prospective, multicentre cohort study using the ISARIC WHO Clinical Characterisation Protocol.external icon Sigfrid et al. The Lancet Regional Health – Europe (August 5, 2021). Among 327 SARS-CoV-2 adults hospitalized in the United Kingdom in January–October 2020, 55% did not feel fully recovered ≥3 months post-discharge, and 93% reported new or persistent symptoms. Being female, younger age, and having in-hospital severe acute disease were the strongest predictors of poor long-term outcome. Females aged <50 years were 5 times less likely than males of the same age (aOR09, 95% CI 1.64-15.74) to report feeling recovered.
Note: Adapted from Sigfrid et al. Fatigue and other persistent reported symptoms in adults ≥3 months post-hospital discharge for COVID-19. Licensed under CC BY.
- Risk factors for COVID-19-related in-hospital mortality in a high HIV and tuberculosis prevalence setting in South Africa: a cohort study.external icon Jassat et al. The Lancet HIV (August 4, 2021). Among 219,265 people hospitalized for COVID-19 in South Africa from March 2020–March 2021, 23.3% died. Risk factors for in-hospital death included HIV (aOR 1.34, 95% CI 1.27-1.43), past tuberculosis (aOR 1.26, 95% CI 1.15-1.38) current tuberculosis (aOR 1.42, 95% CI 1.22-1.64), or other known risk factors for COVID-19. People with HIV not on antiretroviral therapy (ART) (aOR 1.45, 95% CI 1.22-1.72) were more likely to die in hospital than people with HIV on ART.
Prevention Strategies and Non-Pharmaceutical Interventions
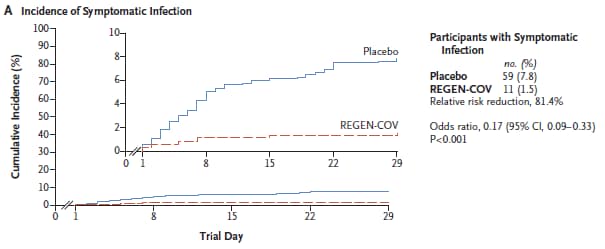
- Subcutaneous REGEN-COV antibody combination to prevent COVID-19.external icon O’Brien et al. NEJM (August 4, 2021). In a randomized, double-blind, placebo trial of REGEN-COV (a combination of the monoclonal antibodies casirivimab and imdevimab) in 753 household contacts of persons with SARS-CoV-2, subcutaneous REGEN-COV administered within 36 hours prevented SARS-CoV-2 infection (relative risk reduction 66.4%) and symptomatic COVID-19 (relative risk reduction 81.4%). REGEN-COV treated contacts who became infected had faster symptom resolution (median 1.2 vs. 3.2 weeks), lower and shorter duration viral load (0.4 vs. 1.3 weeks) than those who received placebo. No dose-limiting toxic effects were noted.
Note: Adapted from O’Brien et al. Cumulative incidence of symptomatic severe acute SARS-CoV-2 infection after REGEN-COV or placebo during the 28-day efficacy assessment period. Relative risk reduction calculated as 1 minus the relative risk. Inset shows the same data on an enlarged y axis. From the New England Journal of Medicine, O’Brien et al., Subcutaneous REGEN-COV antibody combination to prevent COVID-19. August 4, 2021, online ahead of print. Copyright © 2021 Massachusetts Medical Society. Reprinted with permission from Massachusetts Medical Society.
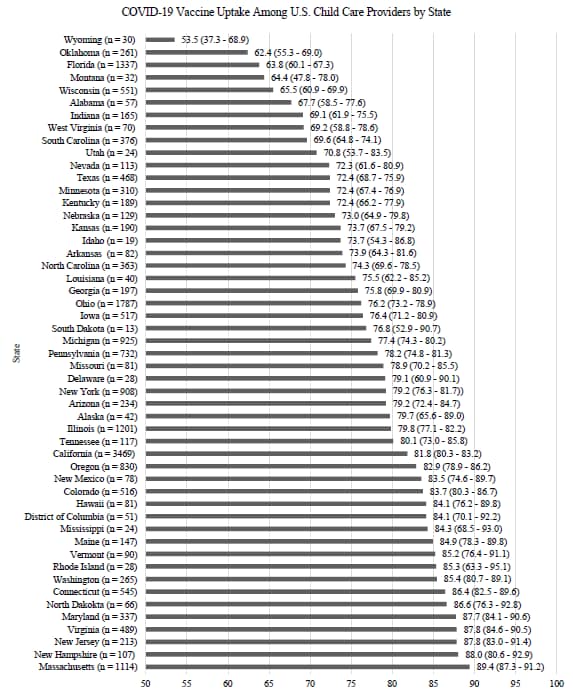
- COVID-19 vaccine uptake among U.S. childcare providers.external icon Patel et al. medRxiv (Preprint; August 1, 2021). Published in Pediatricsexternal icon (November 1, 2021). Among 20,000 respondents to an online survey of childcare workers (May 26─June 23, 2021), 78.1% reported being vaccinated (92.6% with mRNA COVID-19 vaccines). Lower vaccine uptake was reported by childcare providers residing in the Mountain West or South regions of the United States, among childcare providers in home-based childcare programs, and among childcare providers who were younger, lower income, and of Black or African American race. Among unvaccinated respondents, the most commonly reported reason was concern about potential side effects and safety (79.9%); few reported structural barriers such as inability to take time off work (5.4%), being too busy (3.5%), or having difficulty scheduling a vaccine appointment (2.7%).
Note: Adapted from Patel et al. COVID-19 vaccine uptake (90% CI) among U.S. childcare providers in May–June 2021. Used by permission of authors.
Health Equity
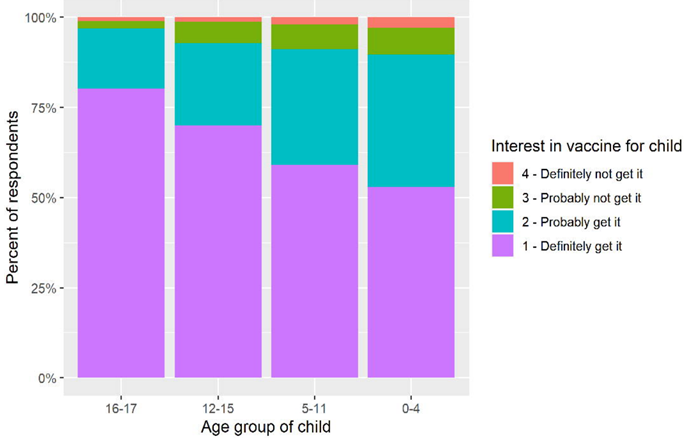
- High parental vaccine motivation at a neighborhood-based vaccine and testing site serving a predominantly Latinx community.external icon Naso et al. medRxiv (Preprint; August 3, 2021). Published in Health Equityexternal icon (December 13, 2021). In April 2021, >90% of Latinx parents in San Francisco at a community-based vaccination/testing site (n = 1033) definitely or probably intended to vaccinate their children against COVID-19. Motivation to vaccinate “as soon as possible” was higher for children aged 12–18 years. Parents not motivated to vaccinate (n = 91) cited fear of immediate (n = 55) or long-term adverse effects (n = 37), fear of effects on fertility (n = 17), and belief that children are not at risk for severe disease (n = 7).
Note: Adapted from Naso et al. Percentage of Latinx parents in San Francisco definitely, probably, probably not, or definitely not intending to vaccinate children against COVID-19. Licensed under CC-BY-NC-ND 4.0.
Social, Behavioral, and Communication Science
- The misunderstanding of vaccine efficacy. external iconTentori et al. Social Science & Medicine (July 27, 2021). In an online behavioral experiment highlighting the general public’s confusion about the meaning of the term “vaccine efficacy” (VE), 92% of participants (n = 600) did not understand that VE is a relative risk reduction. The most popular of 5 incorrect definitions, selected by 32% of participants, explained VE as an absolute risk reduction.
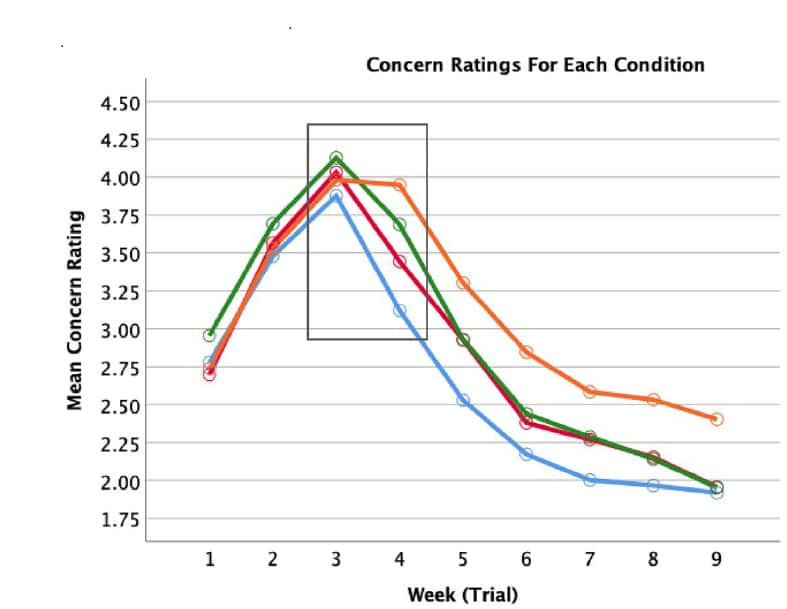
- Interpreting time-series COVID data: reasoning biases, risk perception, and support for public health measures.external icon Harman et al. Scientific Reports (August 2, 2021). In an experiment designed to assess risk perception biases, U.S. and Canadian university students (n = 551) randomly assigned to view 1 of 4 different simulated data visualizations representing COVID-19 cases in their own city were asked to rate their own risk of COVID-19 in each of 9 weeks. Participants who were shown both total active and daily case counts with graphs assessed their risk more accurately than participants shown daily cases only and not accumulated cases. Students who perceived lower risk were less supportive of public health behaviors.
Note: Adapted from Harman et al. Assessment of COVID-19 risk was more accurate among students shown both total active cases and daily case incidence on the same graph and table than among students shown active cases graphically, active cases as numbers alone, or daily case counts (control) only. Black box represents time of highest risk (highest active case counts but falling daily incidence), and also where risk assessment was generally poorest. Concern ratings were based on a 5-point Likert-type scale. Licensed under CC BY 4.0.
Disclaimer: The purpose of the CDC COVID-19 Science Update is to share public health articles with public health agencies and departments for informational and educational purposes. Materials listed in this Science Update are selected to provide awareness of relevant public health literature. A material’s inclusion and the material itself provided here in full or in part, does not necessarily represent the views of the U.S. Department of Health and Human Services or the CDC, nor does it necessarily imply endorsement of methods or findings. While much of the COVID-19 literature is open access or otherwise freely available, it is the responsibility of the third-party user to determine whether any intellectual property rights govern the use of materials in this Science Update prior to use or distribution. Findings are based on research available at the time of this publication and may be subject to change.

