COVID-19 Science Update released: August 7, 2020 Edition 37

The COVID-19 Science Update summarizes new and emerging scientific data for public health professionals to meet the challenges of this fast-moving pandemic. Weekly, staff from the CDC COVID-19 Response and the CDC Library systematically review literature in the WHO COVID-19 databaseexternal icon, and select publications and preprints for public health priority topics in the CDC Science Agenda for COVID-19 and CDC COVID-19 Response Health Equity Strategy.
Here you can find all previous COVID-19 Science Updates.
PEER-REVIEWED
Prevalence of SARS-CoV-2 infection among asymptomatic health care workers in the greater Houston, Texas, Areaexternal icon. Vahidy et al. JAMA Network Open (July 27, 2020).
Key findings:
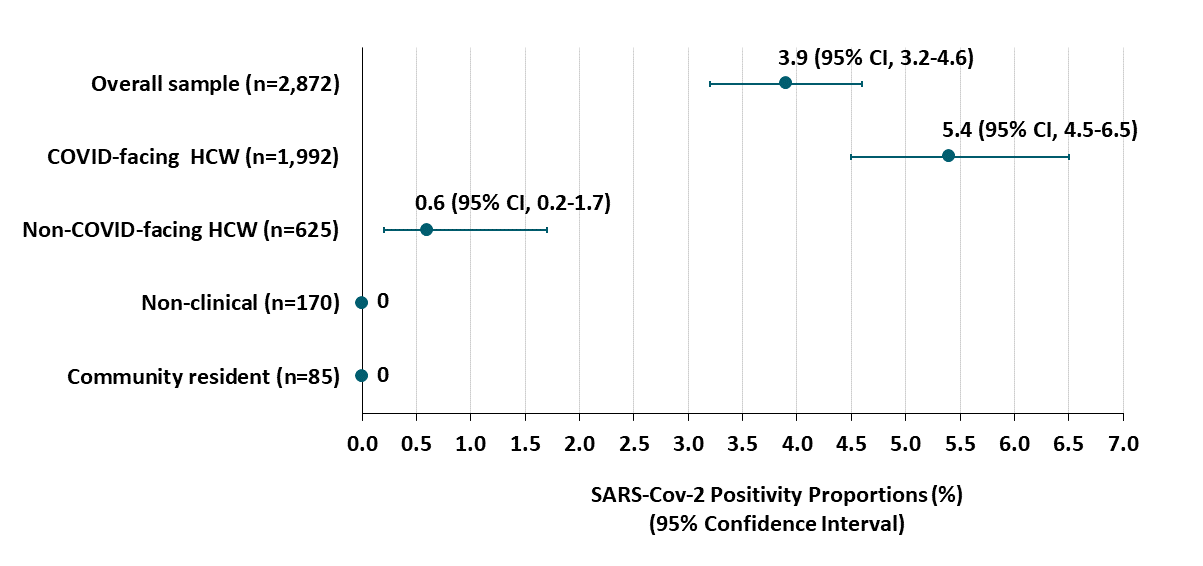
- Overall test positivity across 5 weeks was 3.9% (95% CI 3.2%-4.7%).
- Among 2,617 clinical healthcare workers (HCW), SARS-CoV-2 infection was associated with working with COVID-19 patients (Figure):
- Staff working on COVID-19 wards (n = 1,992) had test positivity of 5.4% (95% CI 4.5%-6.5%).
- Staff working on non-COVID-19 wards (n = 625) had test positivity of 0.6% (95% CI 0.2%-1.7%).
Methods: Cross-sectional study in 2,787 staff from one academic medical center and 5 hospitals and 85 community residents in Houston, TX who reported no symptoms of COVID-19. NP swabs were collected from study participants and tested by PCR. Staff were categorized as clinical HCW working in COVID-19 wards (n = 1,992) or other wards (n = 625), or as non-clinical (n = 170). Limitations: Potential ascertainment bias from convenience sampling.
Implications: Higher infection rates among COVID-19–facing clinical HCWs suggest nosocomial infection and highlight the need for consistent infection control and testing throughout hospital systems.
Figure:
Note: Adapted from Vahidy et al. SARS-Cov-2 rates among asymptomatic clinical health care workers (HCW), non-clinical HCW, and community residents, stratified by the degree to which they interact with patients hospitalized with COVID. Licensed under CC-BY.
Body mass index and risk for intubation or death in SARS-CoV-2 infectionexternal icon. Anderson et al. Annals of Internal Medicine (July 29, 2020).
Key findings:
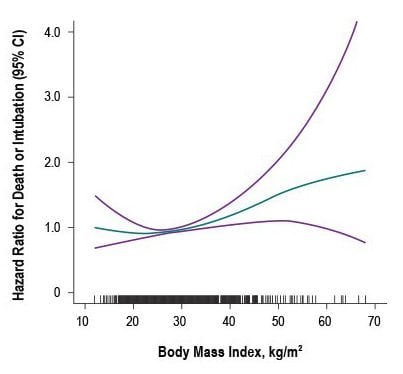
- Adult patients with body mass index (BMI) ≥40 kg/m2 had higher risk for intubation or death, hazard ratio, 1.6 (95% CI 1.1-2.1) adjusted for age, sex, race/ethnicity and co-morbidities (Figure 1).
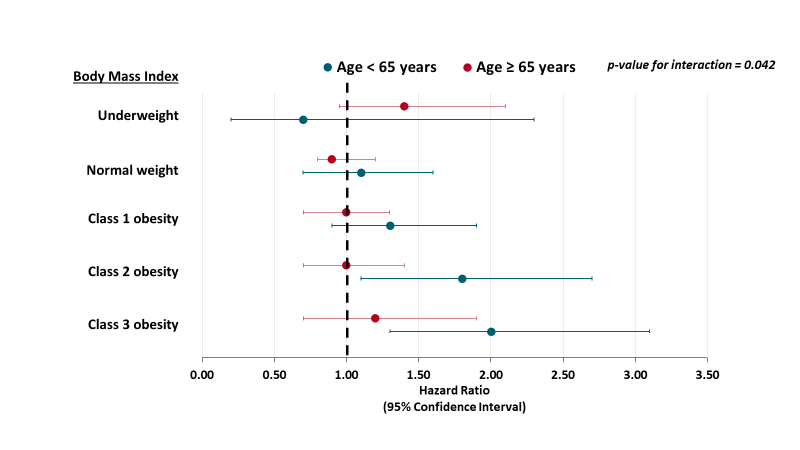
- Obesity was associated with higher risk for intubation or death among patients <65 years (Figure 2).
- For class 2 obesity, hazard ratio (HR) 1.8 (95% CI 1.1-2.7).
- For class 3 obesity, HR 2.0 (95% CI 1.3-3.1).
- BMI was not correlated with higher levels of biomarkers of inflammation (C-reactive protein, erythrocyte sedimentation rate), cardiac injury or fibrinolysis at time of hospital admission.
Methods: Retrospective cohort study among 2,466 adults admitted with laboratory-confirmed SARS-CoV-2 infection, between March 10 and April 24, 2020, presenting to emergency departments at two hospitals in New York City. Patients were followed for at least 47 days. Primary endpoint was in-hospital intubation or death. Limitations: BMI was missing for 28% of patients.
Implications: Patients with BMI ≥40 kg/m2 are at high risk for poor outcomes from COVID-19, particularly those < 65 years. Such patients are high priority to receive targeted prevention strategies to reduce their risk of exposure to SARS-CoV-2 infection; for example, social distancing for prolonged periods of time.
Figure 1
Note: From Anderson et al. Association between BMI and odds of a composite end point of intubation or death among 2,466 adult patients with confirmed COVID-19 infection at two hospitals. The teal line represents the hazard ratio at each level of BMI, and the purple lines represent the upper and lower 95% CI for the estimate. The vertical lines along the x-axis represent individual study patients. Available via American College of Physicians Public Health Emergency Collection through PubMed Central.
Note: Adapted from Anderson et al. Forest plots of adjusted hazard ratios between BMI (kg/m2) and composite end point of death or intubation, stratified by age <65 years versus >65 years. BMI categories: Underweight, <18.5 kg/m2; Normal weight, 18.5 to 24.9 kg/m2; Overweight (reference), 25.0 to 29.9 kg/m2; Class 1 obesity 30 to 34.9 kg/m2; Class 2 obesity 35 to 39.9 kg/m2; Class 3 obesity ≥ 40 kg/m2. The p value represents the interaction test between age groups <65 and ≥65 years. Available via American College of Physicians Public Health Emergency Collection through PubMed Central.
Racial and ethnic disparities characterize COVID-19 morbidity and mortality, as they do many aspects of health in the US. Below, we summarize two papers addressing estimates of racial and ethnic disparities in COVID-19 outcomes, as well as methods for ascertaining those disparities.
PEER-REVIEWED
A. Assessment of community-level disparities in Coronavirus disease 2019 (COVID-19) infections and deaths in large US metropolitan areasexternal icon. Adhikari et al. JAMA Network Open (July 28, 2020).
Key findings:
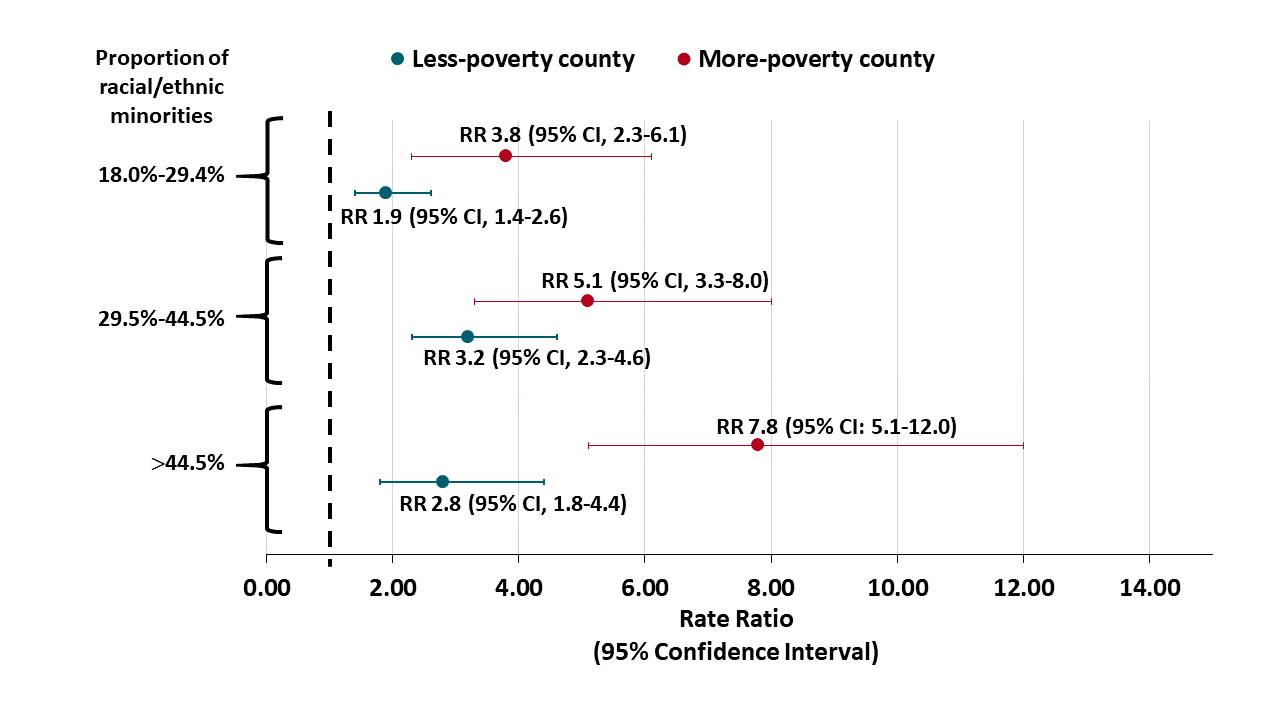
- Counties with the highest proportions of racial and ethnic minorities had higher COVID-19 rates than counties with highest proportions of White residents (Figure).
- For more-poverty counties, rate ratio (RR) 7.8 (95% CI, 5.1–12.0).
- For less-poverty counties, RR 2.8 (95% CI, 1.8–4.4).
- The death rate from COVID-19 was higher in counties with the highest proportions of racial and ethnic minorities, compared to counties with the highest proportions of White residents.
- For more-poverty counties, RR 9.3 (95% CI, 4.7–18.4).
- For less-poverty counties, RR 2.6 (95% CI, 1.1–6.5).
Methods: 158 counties in 10 US urban centers containing 63.5% of COVID-19 cases as of May 10, 2020 were used for the study. Racial/ethnic quartiles were calculated using percent of racial/ethnic minorities for each county: “substantially White” (3.0%-17.9%), “less diverse” (18.0%-29.4%), “more diverse” (29.5%-44.5%), and “substantially non-White” (>44.5%). Counties were classified as “more-poverty” if >10.7% of residents were living below the poverty level. Limitations: County-level health data do not necessarily reflect risk or outcomes among individuals.
Figure:
Note: Adapted from Adhikari et al. Adjusted rate ratios (RR) compare COVID-19 incident cases per 100,000 residents in counties with more or less poverty and by racial/ethnic quartiles in the county. Reference category is county-level proportion of racial/ethnic minorities of 3.0%-17.9%. Licensed under CC-BY.
B. Comparison of weighted and unweighted population data to assess inequities in coronavirus disease 2019 deaths by race/ethnicity reported by the US Centers for Disease Control and Preventionexternal icon. Cowger et al. JAMA Network Open (July 28, 2020; Correctionexternal icon on August 24, 2020).
Key findings:
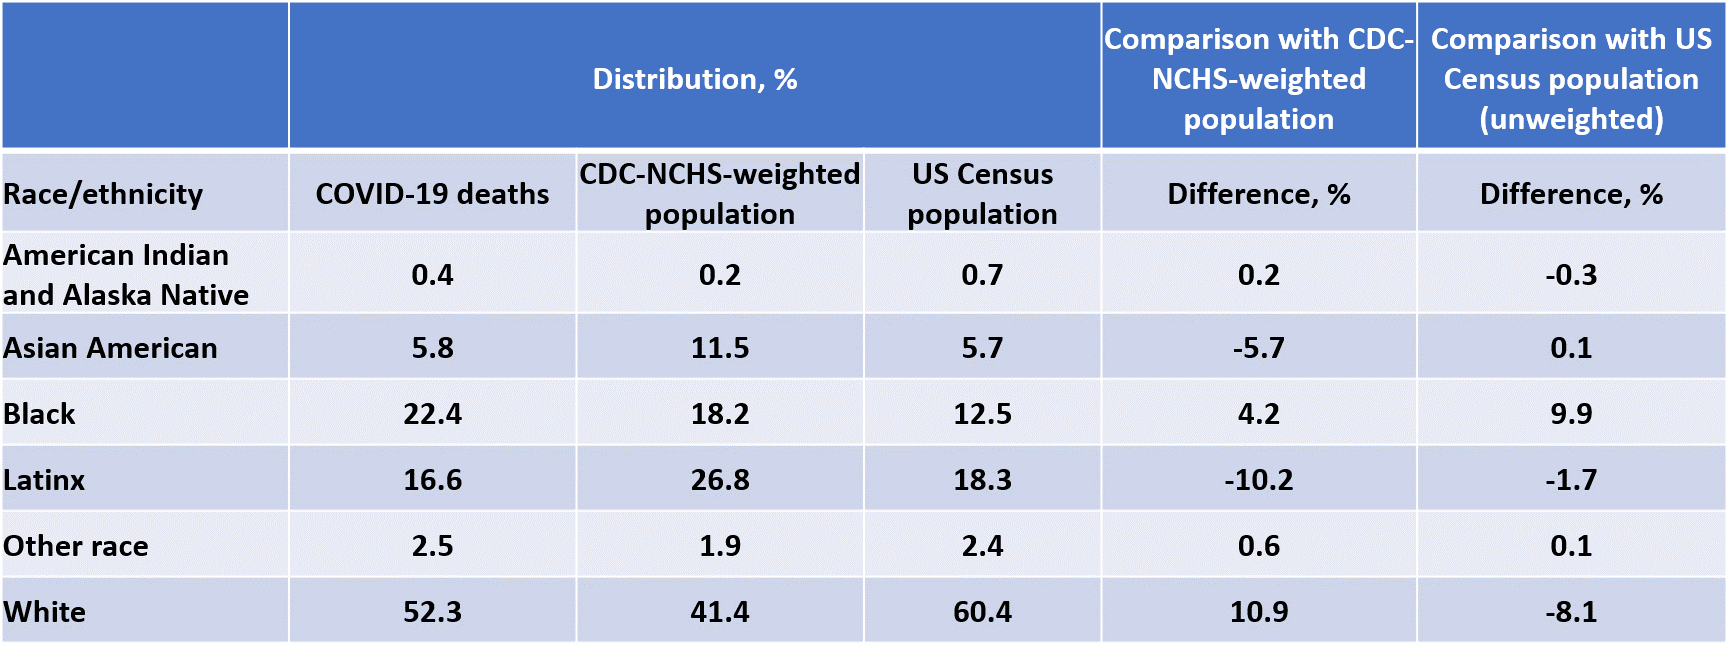
- Estimates by race/ethnicity based on population distributions weighted by number of COVID-19 deaths underestimate disparities compared with unweighted estimates because COVID-19 deaths are disproportionately concentrated in areas with higher proportions of racial and ethnic minorities, compared with the distribution of the overall population (Table).
- According to unweighted estimates, Black people are overrepresented in COVID-19 deaths by 9.9% (22.4% of deaths versus 12.5% of the US population), compared with 4.2% by weighted estimates (Table).
- According to unweighted estimates, White people are underrepresented in COVID-19 deaths by 8.1% (52.3% of deaths versus 60.4% of the US population), compared to overrepresented by 10.9% by weighted estimates.
Methods: Cross-sectional study of 54,861 COVID-19 deaths in the US as of May 13, 2020 using publicly available, aggregate data. Estimates of distribution of COVID-19 deaths by race/ethnicity were compared for two sources: data from the National Center of Health Statistics, which weighs each county’s population by its share of COVID-19 deaths, and US Census data, which are unweighted by share of COVID-19 deaths. Limitations: The impact of weighting is influenced by changes in the distribution of COVID-19 rates across time in the US.
Table:
Note: Adapted from Cowger et al. NCHS-National Center for Health Statistics. NCHS population weights incorporate the prevalence of COVID-19 in geographic units, whereas US Census data do not. Use of weighted data leads to different population estimates of disparities than do unweighted data. Licensed under CC-BY.
Implications for 2 studies (Adhikari et al. and Cowger et al.): Racial and ethnic minorities continue to bear a disproportionate burden of COVID infections and deaths, and weighting schemes that are based on COVID-19 rates and that are also associated with racial and ethnic population distributions might bias disparity estimates. Accurately quantifying excess burden will assist public health authorities in designing and targeting prevention appropriately.
Several studies have demonstrated increased risk for morbidity and mortality from COVID-19 in individuals with preexisting cardiovascular diseases including hypertension, coronary artery disease, and heart failure. Below, we summarize three cohort studies that further highlight evidence of inflammatory involvement in hearts of patients with confirmed COVID-19.
PEER-REVIEWED
A. Outcomes of cardiovascular magnetic resonance imaging in patients recently recovered from coronavirus disease 2019 (COVID-19)external icon. Puntmann et al. JAMA Cardiology (July 27, 2020; Correctionexternal icon on August 25, 2020).
Key findings:
- 78% of 100 patients recovered from COVID-19 had inflammation of the heart muscle (myocarditis) and lining (pericarditis) on cardiac magnetic resonance imaging (cardiac MRI).
- 60% had evidence of ongoing heart inflammation independent of preexisting conditions, severity and overall course of the COVID-19, and time from the original diagnosis.
- Compared with healthy controls (n = 50) and risk factor–matched controls (n = 57), recovered patients had biomarkers signaling cardiac injury (i.e., increased cardiac enzymes) and weakened cardiac function (i.e., decreased ejection fraction).
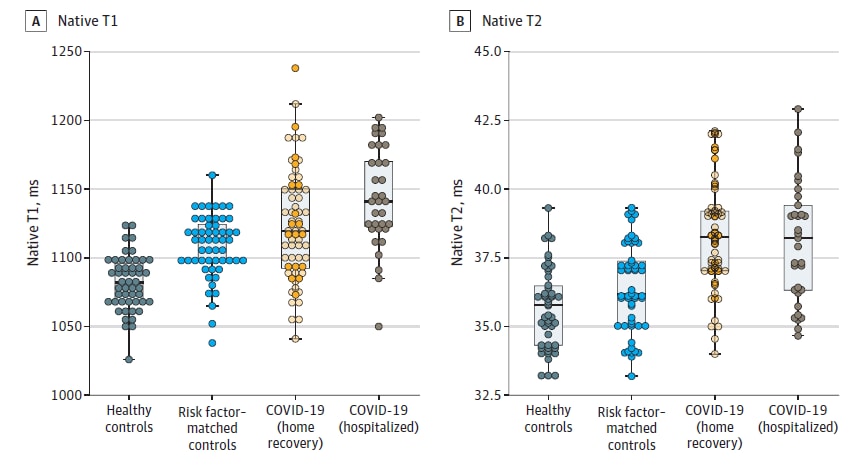
- 76% had elevated high-sensitivity troponin T, (a marker of cardiac injury) and levels were correlated with changes in cardiac function as measured by native T1- and T2-weighted mapping (Figure).
Methods: Prospective observational cohort study of 100 patients without a known prior history of cardiovascular problems and recently recovered from COVID-19 (33% were hospitalized, 67% recovered at home) in Frankfurt, Germany, between April and June 2020. Participants (median age 49 years, 53% male) underwent cardiac MRI and measurement of biomarkers indicating myocardial injury. Median time between diagnosis and cardiac MRI was 71 days (IQR 64-92). Heart function was compared with age and sex-matched healthy controls (n = 50) and risk factor-matched controls (n = 57). Limitations: Small sample size; adults only.
Figure:
Note: Adapted from Puntmann et al. Scatterplots of cardiac function as measured by native T1 (longitudinal relaxation time) and native T2 (transverse relaxation time) in milliseconds. Shorter relaxation times measured by MRI indicates greater cardiac health. Licensed under CC-BY.
B. Association of cardiac infection with SARS-CoV-2 in confirmed COVID-19 autopsy casesexternal icon. Lindner et al. JAMA Cardiology, (July 27, 2020).
Key findings:
- 24 patients (61.5%) had evidence of SARS-CoV-2 present in the heart.
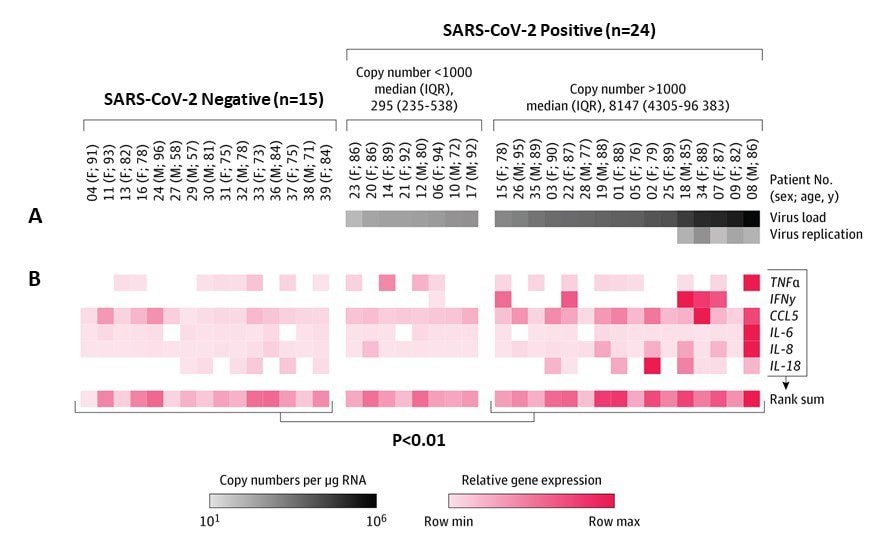
- In 16 of these patients, viral load was more than 1,000 copies per μg of RNA, and there was evidence of elevated cytokine response (Figure 1).
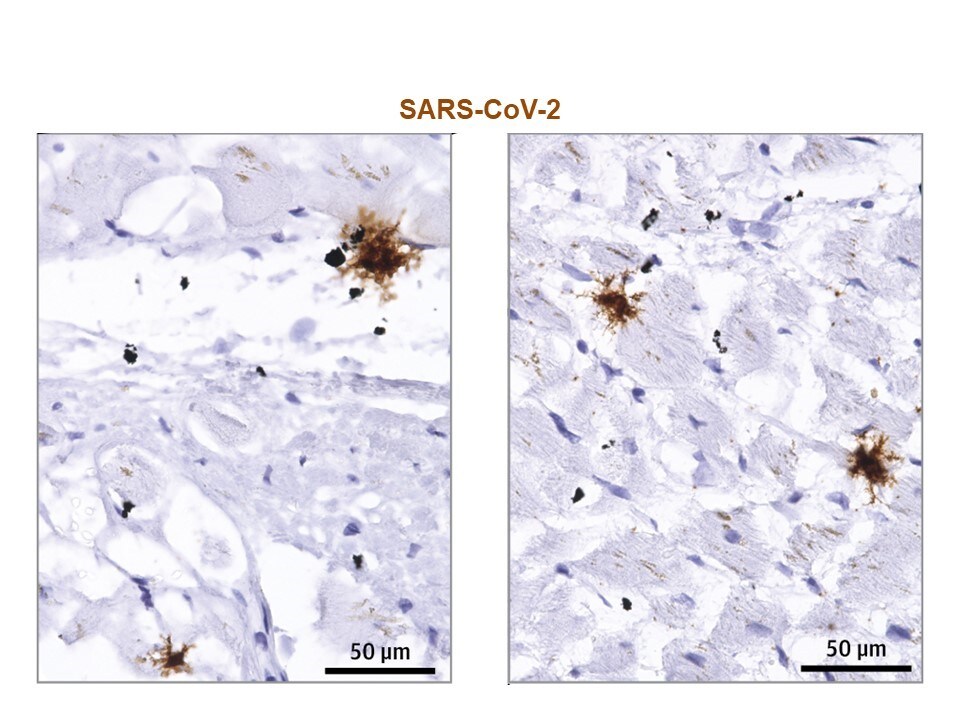
- Evidence of viral replication was observed in interstitial cells within tissue surrounding myocytes, but not within myocytes (heart tissue cells) (Figure 2).
Methods: Study of cardiac tissue from 39 consecutive autopsy cases from Germany, between April 8 and 18, 2020. All patients (median 85 years, IQR 78-89, at death) had tested positive for SARS-CoV-2 with pharyngeal swab. RNA isolation from tissue, RT-PCR, gene expression analysis of cytokines, and histological in-situ hybridization were conducted to evaluate the presence of SARS-CoV-2 in the myocardial tissues from autopsy cases. Limitations: Small sample size with restricted age range; autopsy study only; no myocardial biomarker information.
Figure 1
Note: Adapted from Lindner et al. Virus infection and inflammatory response in cardiac tissue from COVID-19 autopsy cases. (A) RNA was detected by RT-PCR (virus load) in 24 of 39 patients (61.5%). Patients were grouped according to SARS-CoV-2 copy numbers. (B) Gene expression data of a cytokine response panel revealed increased proinflammatory response in cardiac tissue with copy numbers more than 1000 compared with noninfected cardiac tissue. Reproduced with permission from JAMA Cardiol. doi:10.1001/jamacardio.2020.3551. Copyright©2020 American Medical Association. All rights reserved.
Figure 2
Note. Adapted from Lindner et al. In-situ hybridization to detect virus RNA in SARS-CoV-2–infected cardiac tissue. Paraffin-embedded cardiac tissue section of a patient with SARS-CoV-2 infection revealed interstitial cells carrying virus RNA but not myocytes. Reproduced with permission from JAMA Cardiol. doi:10.1001/jamacardio.2020.3551. Copyright©2020 American Medical Association. All rights reserved.
C. Cardiac injury patterns and inpatient outcomes among patients admitted with COVID-19external icon. Raad et al. American Journal of Cardiology. (July 23, 2020).
Key findings:
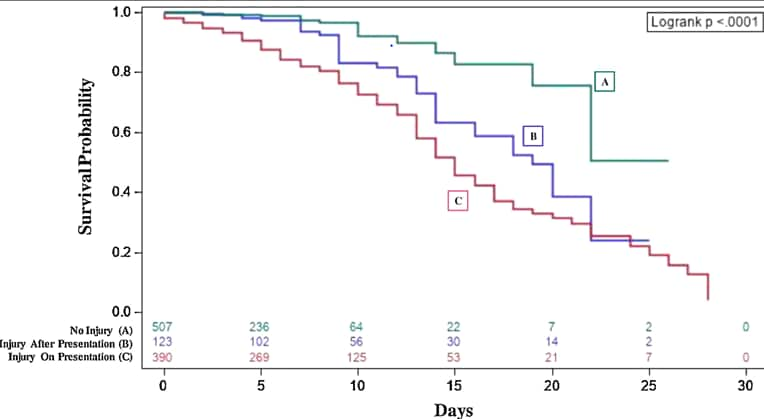
- 390 (38%) patients had cardiac injury on presentation to the emergency department. Patients presenting with injury were more likely to progress to severe outcomes or death than patients with no injury or patients who developed cardiac injury occurred after admission (Figure).
- Patients with higher peak high-sensitivity troponin-I (hs-cTnI) levels were more likely to die or to develop severe clinical outcomes (e.g., kidney failure, ICU admission, mechanical ventilation).
- Compared with peak hs-cTnI ≤18 ng/L, odd ratios (OR) for mortality risk were:
- adjusted OR 3.0 (95% CI 1.5-6.0) if peak hs-cTnI >18 ng/L.
- adjusted OR 7.7 (95% CI 3.7-16.0) peak hs-cTnI ≥99 ng/L.
- Compared with peak hs-cTnI ≤18 ng/L, odd ratios (OR) for mortality risk were:
Methods: Retrospective longitudinal cohort study of 1,020 patients (median age 63 years, mean body mass index 31 kg/m2) hospitalized with COVID-19, between March 9 and April 15, 2020. Cardiac injury was defined by a hs-cTnI concentration >18 ng/L (>99th percentile of the upper limit of normal). Time-to-event analysis was done for patients with and without cardiac injury stratified by initial hs-cTnI level, first abnormal hs-cTnI, and peak hs-cTnI. Limitations: Elderly age of the patients might have influenced the results; patients were excluded if hs-cTnI levels were not obtained; no EKG or cardiac MRI information.
Figure:
Note: Adapted from Raad et al. Survival probability of patients according to cardiac injury incidence categories based on hs-cTnI levels: (A) no cardiac injury; (B) first injury detected after presentation to hospital; (C) injury on presentation to hospital. Cardiac injury was defined by a hs-cTnI concentration >99th percentile (>18ng/L). This article was published in American Journal of Cardiology, Vol 133, Raad et al., Cardiac injury patterns and inpatient outcomes among patients admitted with COVID-19, Page 154-161, Copyright Elsevier 2020. This article is currently available at the Elsevier COVID-19 resource center: https://www.elsevier.com/connect/coronavirus-information-center.
Implications for 3 studies (Puntmann et al., Lindner et al., & Raad et al.): SARS-CoV-2 infection appears to cause heart damage that might last beyond the acute phase. The finding of the three studies indicate the need for research to fully understand how SARS-CoV-2 virus affects patients’ hearts—and for how long. Potential preventive strategies and longitudinal care models may be needed for patients recovering from COVID-19 with transient or permanent cardiac injury.
PEER-REVIEWED
Evaluation of the mRNA-1273 vaccine against SARS-CoV-2 in nonhuman primatesexternal icon. Corbett et al. NEJM (July 28, 2020).
Key findings:
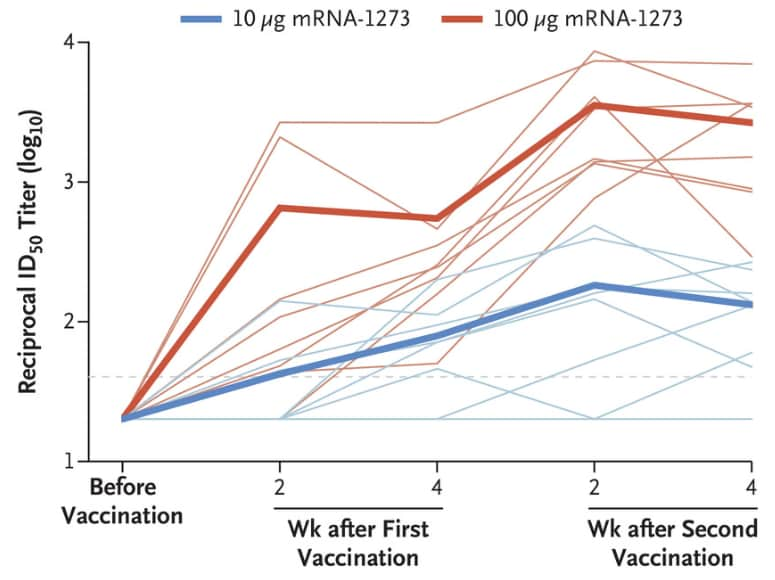
- Vaccination with an existing SARS-CoV-2 vaccine candidate (mRNA-1273) induced SARS-CoV-2 neutralizing activity in rhesus macaques, as measured by rises in reciprocal 50% inhibitory dilution (ID50) geometric mean titer (GMT) of neutralizing antibodies (Figure 1).
- Macaques receiving 10 μg of vaccine had ID50 GMT of 63 at 4 weeks after the first vaccination and 103 by 4 weeks after second vaccination.
- Macaques receiving 100 μg of vaccine had ID50 GMT of 305 at 4 weeks after first vaccination and 1,862 after second vaccination.
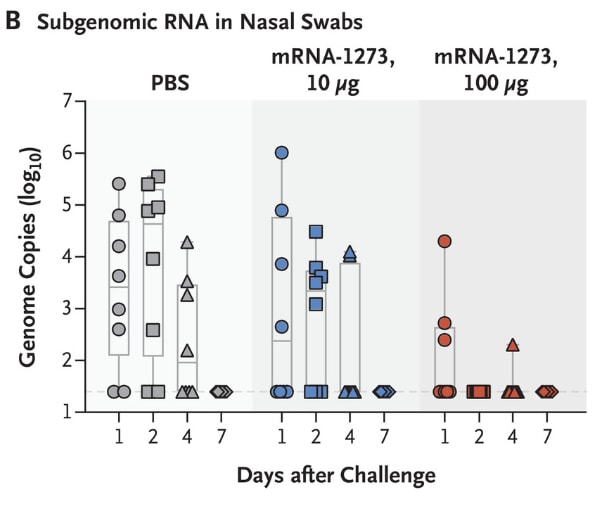
- Results showed prevention of viral replication in the upper and lower airways (Figure 2).
- Histological examinations indicated no substantial vaccine-related inflammation in lower airways.
Methods: Female and male rhesus macaques (12 of each sex; aged 3 to 6 years) were stratified into groups of three by sex, age, and weight. One of the three animals in each stratum was randomly assigned to receive 10 μg of mRNS-1273, 100 μg of mRNA-1273, or phosphate-buffered saline as intramuscular injections at weeks 0 and 4. Serum antibodies were measured in upper and lower airways, and protective efficacy was estimated measuring viral replication after intratracheal and intranasal challenge with live virus. Limitations: Animal model.
Implications: Limitation of viral replication post-challenge in both the lower and the upper airways of macaques shows promise for efficacy trials in humans.
Figure 1
Note: Adapted from Corbett et al. Neutralizing antibodies measured on log scale after mRNA vaccination in rhesus macaques (n = 12 per group). Neutralizing activity at four weeks after the initial high-dose vaccination was 5 times that observed in the low dose vaccination. Faint lines represent individual animals, and bold lines represent the geometric mean titer for each group. From NEJM. Corbett et al. Evaluation of the mRNA-1273 Vaccine against SARS-CoV-2 in Nonhuman Primates. DOI: 10.1056/NEJMoa2024671. Copyright © 2020 Massachusetts Medical Society. Reprinted with permission from Massachusetts Medical Society.
Figure 2
Note: Adapted from Corbett et al. Inhibition of viral replication post-challenge in 3 groups of rhesus macaques (n = 12 per group) in BAL and nasal swab specimens. BAL- bronchoalveolar-lavage; PBS- phosphate-buffered saline (control); mRNA-1273 10 μg– inoculation with 10 μg of vaccine; mRNA-1273 100 μg– inoculation with 100 μg of vaccine. Subgenomic RNA-smaller section of originally transcribed material. From NEJM. Corbett et al. Evaluation of the mRNA-1273 Vaccine against SARS-CoV-2 in Nonhuman Primates. DOI: 10.1056/NEJMoa2024671. Copyright © 2020 Massachusetts Medical Society. Reprinted with permission from Massachusetts Medical Society.
COVID-19 Across the World
- Barasa et al. Assessing the hospital surge capacity of the Kenyan health system in the face of the COVID-19 pandemicexternal icon. PLOS One. Describes capacity of Kenya’s hospitals to manage a surge in COVID-19 caseload and discusses strategic priorities for strengthening essential services.
- Brutto et al. SARS-CoV-2 in rural Latin America. A population-based study in coastal Ecuadorexternal icon. Clinical Infectious Diseases. Suggests widespread transmission in rural Ecuador on the basis of SARS-CoV-2 antibody prevalence in a sample of rural adults.
- Ransing et al. Infectious disease outbreak related stigma and discrimination during the COVID-19 pandemic: Drivers, facilitators, manifestations, and outcomes across the worldexternal icon. Brain, Behavior, and Immunity. Describes COVID-19-related stigma and stigmatization across 13 countries, including stigma aimed at chronically marginalized populations.
Vertical Transmission
- Heady et al. SARS-CoV-2 can infect the placenta and is not associated with specific placental histopathology: A series of 19 placentas from COVID-19+ mothersexternal icon. Concludes placental infection is possible, but rare.
More on Face Masks
- Byrne et al. Injection molded autoclavable, scalable, conformable (iMASC) system for aerosol-based protection: A prospective single-arm feasibility studyexternal icon. BMJ Open. Describes fit and user experience for a reusable, sterilizable N95 filtering facepiece respirator-type face mask.
- Gandhi et al. Masks do more than protect others during COVID-19: Reducing the inoculum of SARS-CoV-2external icon. Journal of General Internal Medicine. Suggest universal public masking during the COVID-19 pandemic might reduce the amount of viral inoculum to which the mask-wearer is exposed and lead to higher rates of mild or asymptomatic infection.
Collateral damage
- Hecht et al. Impacts of COVID-19 on childhood malnutrition and nutrition-related mortalityexternal icon. Discusses effects of economic, food, and health systems disruptions resulting from the COVID-19 pandemic on malnutrition.
- COVID-19: from a PHEIC to a public mental health crisis?external icon Lancet Public Health. Discusses research in emerging mental health challenges attributable to the COVID-19 pandemic, including among frontline health care and other workers.
Other Topics
- Chen et al. Mutations strengthened SARS-CoV-2 infectivityexternal icon. Journal of Molecular Biology. Identifies 6 mutations of SARS-CoV-2, all with increased infectivity, and their geographic distribution.
- Amrun et al. Linear B-cell epitopes in the spike and nucleocapsid proteins as markers of SARS-CoV-2 exposure and disease severityexternal icon. Describes 4 immunodominant linear-B cell epitopes from pooled plasma samples from PCR-positive COVID-19 patients to inform development of point of care tests.
- Agbehadji et al. Review of big data analytics, artificial intelligence and nature-inspired computing models towards accurate detection of COVID-19 pandemic cases and contact tracingexternal icon. International Journal of Environmental Research and Public Health. Reviews big data, artificial intelligence and nature-inspired computing models that can be adopted for the detection and prediction of COVID-19 cases.
Disclaimer: The purpose of the CDC COVID-19 Science Update is to share public health articles with public health agencies and departments for informational and educational purposes. Materials listed in this Science Update are selected to provide awareness of relevant public health literature. A material’s inclusion and the material itself provided here in full or in part, does not necessarily represent the views of the U.S. Department of Health and Human Services or the CDC, nor does it necessarily imply endorsement of methods or findings. While much of the COVID-19 literature is open access or otherwise freely available, it is the responsibility of the third-party user to determine whether any intellectual property rights govern the use of materials in this Science Update prior to use or distribution. Findings are based on research available at the time of this publication and may be subject to change.
