COVID-19 Science Update released: April 21, 2020 Edition 6

The COVID-19 Science Update summarizes new and emerging scientific data for public health professionals to meet the challenges of this fast-moving pandemic. Weekly, staff from the CDC COVID-19 Response and the CDC Library systematically review literature in the WHO COVID-19 databaseexternal icon, and select publications and preprints for public health priority topics in the CDC Science Agenda for COVID-19 and CDC COVID-19 Response Health Equity Strategy.
Here you can find all previous COVID-19 Science Updates.
PEER-REVIEWED
Spread of SARS-CoV-2 in the Icelandic population.external icon Gudbjartsson et al. NEJM (Apr 14, 2020).
Key findings:
- Targeted testing (9,199 high-risk individuals) 13% infected, of whom 93% reported symptoms.
- Population screening (13,080 individuals) 0.8% infected, of whom 57% reported symptoms.
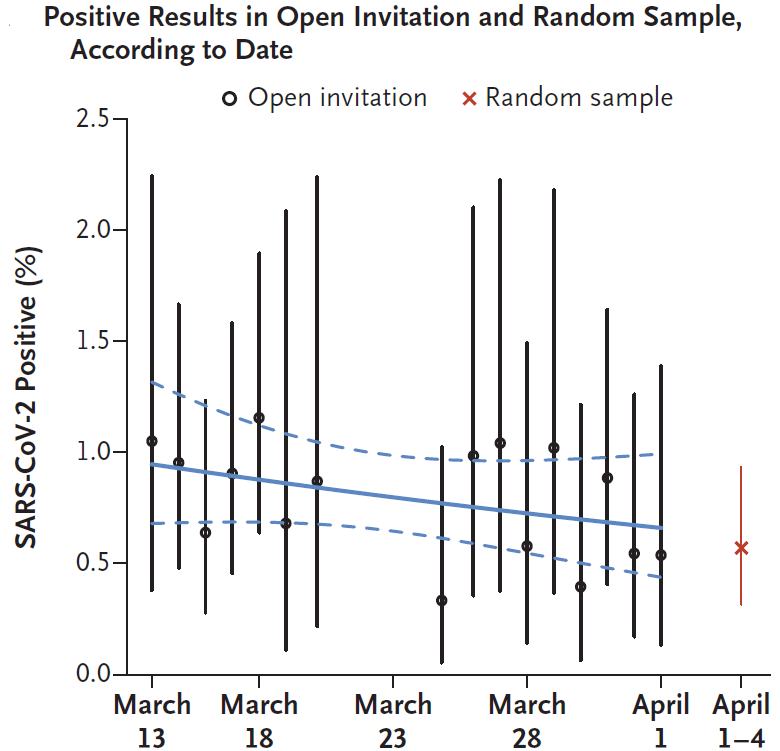
- The daily percentages of these positive results remained statistically stable (Figure).
- Genome sequencing suggested multiple virus introductions from separate countries.
Methods: Targeted testing of high-risk persons (were symptomatic, had recently traveled to high-risk countries, or had contact with infected persons) and general population screening using a mix of open invitation (via online registration to all residents who were symptom-free or had mild cold-like symptoms) and random selection (via texting to random sample). 6% of the Icelandic population was tested, and 643 viral genomes from positive specimens were sequenced. Limitations: May not be geographically generalizable; possible participation bias; fraction of positives that remained asymptomatic not assessed.
Implications: About half of infections in the general Icelandic population were asymptomatic at time of testing. Containment measures, in concert with screening and contract tracing, may have limited spread during a short observation period. SARS-CoV-2 was likely introduced from multiple different global geographic regions.
Figure:
Note: Adapted from Gudbjartsson et al. Figure shows the percent of samples positive for SARS-CoV-2 in population screening during March 13 and April 4, 2020. The solid blue line is the logistic regression line, and the dashed lines indicate the 95% CI. The slope corresponds to a statistically non-significant infection rate change of −2% (95% CI, −5 to 1) per day. The vertical bars indicate 95% CIs for each day. From NEJM. 382:2302-2315. DOI: 10.1056/NEJMoa2006100. Copyright ©2020 Massachusetts Medical Society. Reprinted with permission from Massachusetts Medical Society
Association of public health interventions with the epidemiology of the COVID-19 outbreak in Wuhan, China.external icon Pan et al. JAMA (Apr 10, 2020).
Key findings:
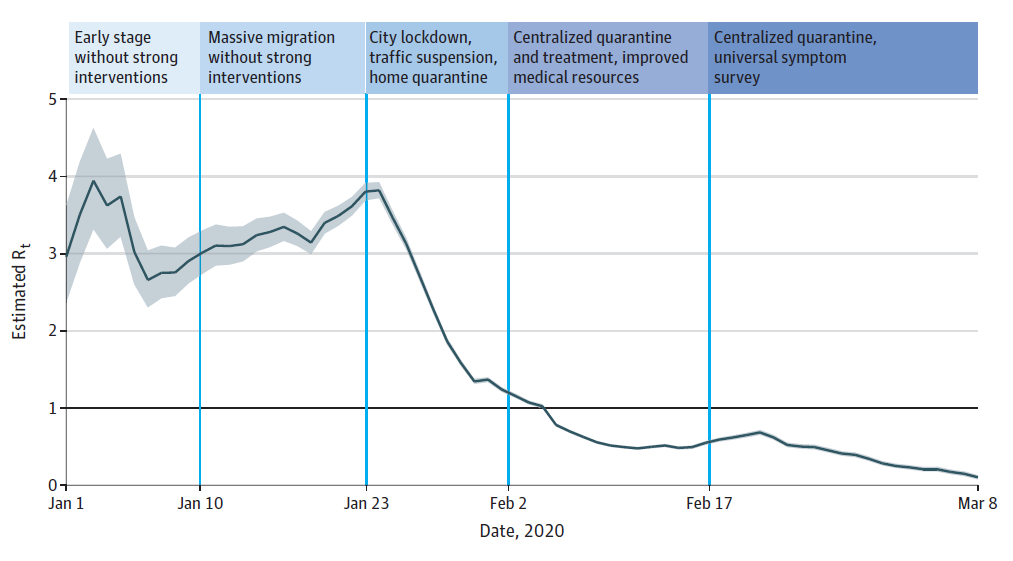
- Across 5 periods in the response, the effective reproduction number (Rt) early in the outbreak was 3.0-4.0 and decreased to <1.0 after multiple interventions, including movement and traffic restrictions, social distancing, home and central quarantine, centralized isolation, and universal symptom survey (Figure).
- The case rate peaked when city lockdown, traffic suspension, and home quarantine were first implemented, and then declined across all sex and age groups, except for children and adolescents.
- The case rate in health care workers was >3 times that of the general population, peaking in the third period and decreasing in the last 2 periods when PPE was more widely used.
- The percentage of severe and critical cases decreased from 53.1% to 10.3% over the 5 periods.
Methods: Cohort study of 32,583 laboratory-confirmed COVID-19 cases reported between December 8, 2019 and March 8, 2020 in Wuhan. Rates of infection and effective reproduction number were assessed during 5 time periods that were divided according to key events and interventions. Limitations: Impact of individual interventions could not be evaluated; data on testing availability and asymptomatic infections unavailable.
Implications: Multiple sustained public health interventions ─ including movement and traffic restrictions, social distancing, intensive contact tracing, home and centralized quarantine, centralized isolation, and universal symptom survey ─ were temporally associated with achieving an Rt <1 and decreased COVID-19 spread in Wuhan.
Figure:
Note: From Pan et al. Figure shows the effective reproduction number Rt calculated over a 5-day moving average since January 1, 2020. The black horizontal line indicates Rt = 1, below which sustained transmission is unlikely. The 95% credible intervals are illustrated with gray shading. Reproduced with permission from JAMA. doi:10.1001/jama.2020.6130. Copyright©2020 American Medical Association. All rights reserved.
Universal screening for SARS-CoV-2 in women admitted for deliveryexternal icon. Sutton et al. NEJM. (April 13, 2020).
Key Findings:
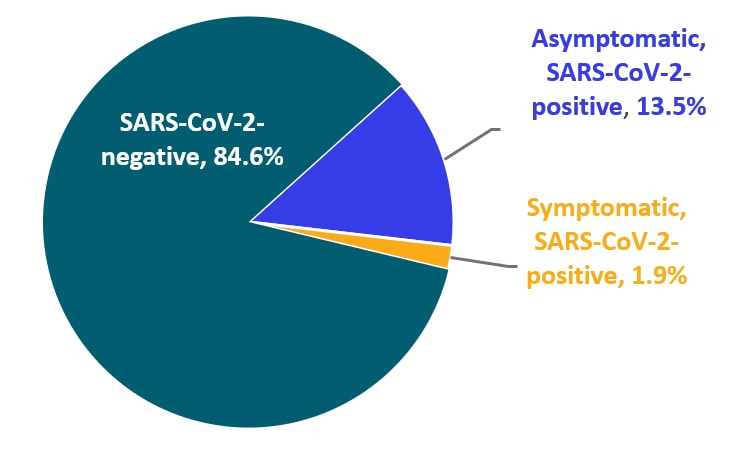
- Among 215 women admitted to labor and delivery, SARS-CoV-2 was detected in 15% on admission.
- Of 33 women who tested positive for SARS-CoV-2, 88% had no symptoms at presentation when tested.
- Of the 29 asymptomatic women who tested positive for SARS-CoV-2, 10% developed fevers in hospital.
- One woman testing negative on admission developed symptoms post-partum and subsequently tested positive for SARS-CoV-2.
Methods: Prospective case series of 215 pregnant women admitted to 2 New York City hospitals for labor and delivery. All women were screened on admission for SARS-CoV-2 by RT-PCR (nasopharyngeal swabs). Participants were monitored for symptom onset during their hospital stay. Limitations: Generalizability limited to regions with similar disease prevalence; potential for false-negative tests on admission.
Implications: In this New York City based study, 15% of pregnant women tested positive for SARS-CoV-2 on admission or during their hospital stay. The majority were asymptomatic, reinforcing utility of testing women presenting for delivery to inform control measures (e.g., isolation and use of personal protective equipment).
Figure:
Note: Adapted from Sutton et al. Chart shows the SARS-CoV-2 test status and percent symptomatic on admission for 215 obstetric patients in 2 NYC hospitals. 84.6% were SARS-CoV-2 negative, 1.9% were symptomatic and SARS-CoV-2 positive, and 13.5% were asymptomatic and SARS-CoV-2 positive. This figure does not illustrate the 3 asymptomatic test positive women who later developed symptoms, or the one test negative women who developed symptoms and subsequently tested positive. From NEJM. 382:2163-2164 DOI: 10.1056/NEJMc2009316. Copyright ©2020 Massachusetts Medical Society. Reprinted with permission from Massachusetts Medical Society.
PREPRINTS (NOT PEER-REVIEWED)
Modes of contact and risk of transmission in COVID-19: a prospective cohort study of 4,950 close contact persons in Guangzhou of Chinaexternal icon. Luo et al. SSRN (Apr 9, 2020).
Key findings:
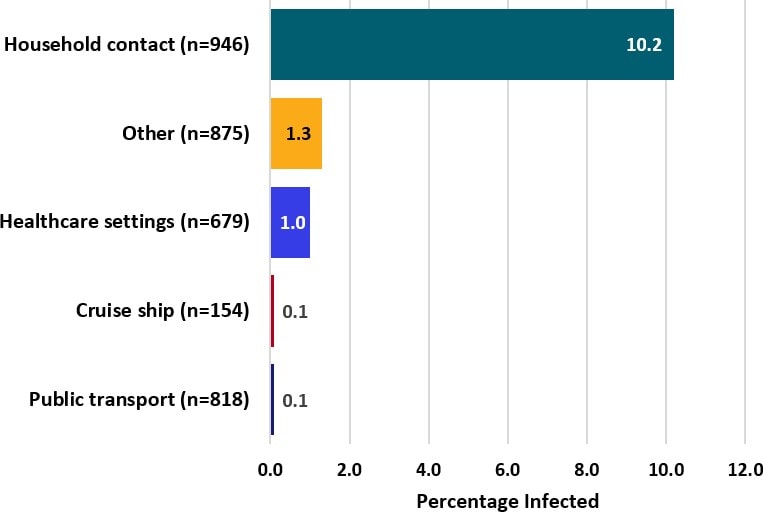
- Incidence of SARS-CoV-2 infection from household exposure was at least 10 greater than incidence attributable to other modes of exposure examined.
- Exposure to a person with a productive cough increased the risk of infection by five times.
- Risk of transmission increased with symptom severity of source cases.
- Secondary cases were clinically milder, in general, than source cases.
- In this city’s outbreak, although only 19% of contacts reported household contact as their exposure risk, 74% of infections that were later diagnosed among contacts were attributable to household contact.
Methods: Prospective cohort study of 4,950 close contacts of 347 confirmed COVID-19 patients between January 15 and March 6, 2020 (Guangzhou, China). Contacts were quarantined, interviewed, and tested for SARS-CoV-2 by RT-PCR every 48 hours for 14 days since their last contact. Limitations: Possible recall bias.
Implications: Household contact, particularly with persons who have productive coughs, poses a higher risk of transmitting SARS-CoV-2 compared with other modes of exposure in the context of this citywide outbreak.
Figure:
Note: Adapted from Luo et al. Percentage with COVID-19 infection by mode of contact. Exposures were mutually exclusive. Among the 96 (1.9%) with multiple modes of contact, 13% developed infection which in 70% of cases included household contact. Cruise ship refers to cruises from Dream Cruise Line (www.dreamcruiseline.comexternal icon). Healthcare contact was not stratified by type of patient contact, if any. This article was published in preprints with The Lancet, Luo LL , et al, Modes of Contact and Risk of Transmission in COVID-19: A Prospective Cohort Study 4950 Close Contact Persons in Guangzhou of China, posted 9 April 2020, Copyright Elsevier 2020.
PEER-REVIEWED
Rates of co-infection between SARS-CoV-2 and other respiratory pathogens. external iconKim et al. JAMA (April 15, 2020).
Key findings:
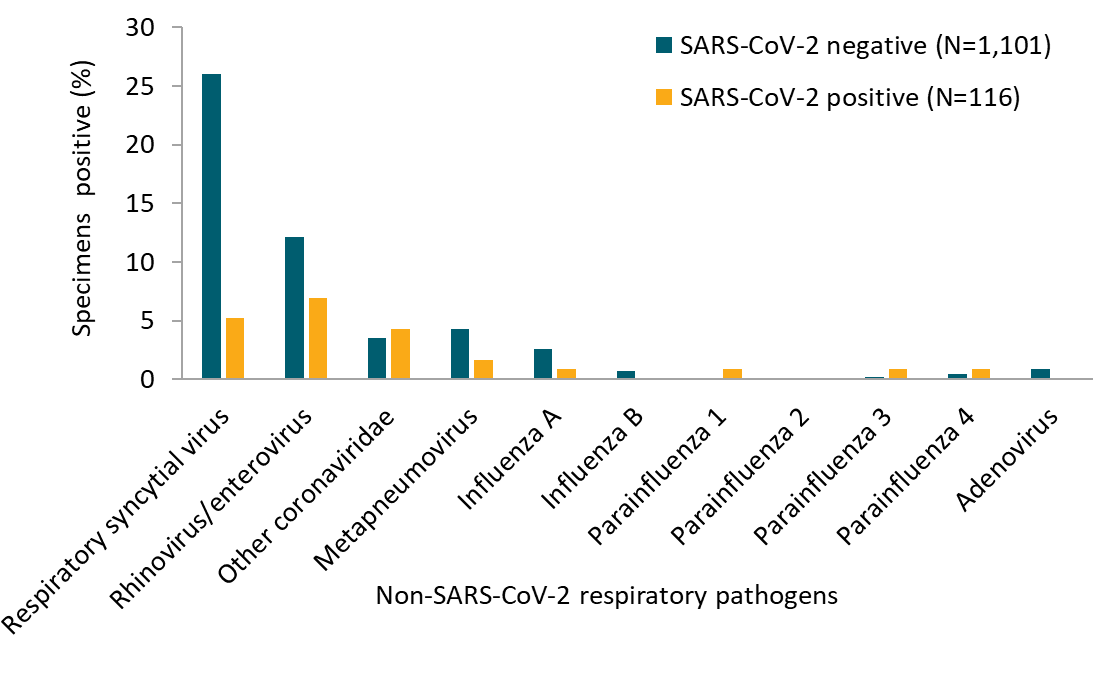
- 20.7% of SARS-CoV-2 positive specimens were also positive for at least one other respiratory pathogen.
- The most common co-infections were rhinovirus/enterovirus (6.9%), respiratory syncytial virus (5.2%), and non–SARS-CoV-2 coronaviruses (4.3%) (Figure).
Methods: RT-PCR for SARS-CoV-2 and other respiratory pathogens was performed on 1,217 nasopharyngeal swabs collected from symptomatic patients (e.g., cough, fever, dyspnea) attending outpatient, inpatient, and emergency departments in Northern California between March 3 and 25, 2020. Limitations: Single region of California and samples only collected in March so results may not be geographically or seasonally representative; positive results for non–SARS-CoV-2 pathogens may represent the detection of residual virus in resolved cases rather than clinical co-infections.
Implications: Respiratory tract coinfection with non–SARS-CoV-2 viruses among patients with COVID-19 may be more common than previously reported. However, routine testing for most of these viruses is unlikely to provide clinical benefit given lack of specific treatment options.
Figure:
Note: Adapted from Kim et al. Percentage of specimens positive for non–SARS-CoV-2 respiratory pathogens stratified by SARS-CoV-2 status. Reproduced with permission from JAMA. doi:10.1001/jama.2020.6266. Copyright©2020 American Medical Association. All rights reserved.
High prevalence of obesity in severe acute respiratory syndrome coronavirus-2 (SARS-CoV-2) requiring invasive mechanical ventilationexternal icon. Simmonet et al. Obesity (April 9, 2020).
Key findings:
- Among patients with SARS-CoV-2 infection, higher body mass index (BMI) was associated with increased risk for invasive mechanical ventilation (IMV) (figure).
- Severely obese patients (BMI ≥35) had 7-fold increased odds of requiring IMV compared with lower BMI patients after adjusting for age, hypertension, diabetes, and dyslipidemia.
Methods: Cross sectional analysis of 124 consecutive patients admitted to intensive care with SARS-CoV-2 in a single French hospital during February 27 to April 5, 2020. BMI was categorized as lean (18.5 to <25kg/m2), overweight (25 to <30kg/m2), moderately obese (30 to <35kg/m2), or severely obese (>35kg/m2). Limitations: Did not control for pre-existing cardiovascular and pulmonary disease.
Implications: SARS-CoV-2 patients with higher BMIs are more likely to require invasive mechanical ventilation.
Figure:
Note: Adapted from Simonnet et al. Proportions of patients requiring IMV during their stay in intensive care stratified by BMI (p value from Chi square test for trend). Available via Wiley Public Health Emergency Collection through PubMed Central.
PEER-REVIEWED
A. PCR assays turned positive in 25 discharged COVID-19 patientsexternal icon. Yuan et al. Clinical Infectious Diseases (Apr 8, 2020).
Key findings:
- Among 172 COVID-19 patients who were discharged after ≥2 negative RT-PCR tests at least 24 hours apart, 14.5% (n = 25) subsequently had ≥1 positive PCR results.
- 6.3% (n = 11) from NP swabs (average 5.2 days after discharge).
- 8.1% (n = 14) from anal swabs (Note: RT-PCR positivity of anal swabs does not correlate with infectiousness).
- Among patients re-admitted due to positive post-discharge RT-PCR tests, few had symptoms (8 reported mild cough) and all had improved (n = 12) or stable (n = 8) chest CT findings.
- Average time from last negative to recurrent positive 7.32 ± 3.86 days.
Methods: NP and anal swabs were collected every 3 days for 14 days after hospital discharge from 172 COVID-19 patients. Limitations: Methods of specimen collection, handling, and storage not described; cycle threshold values of post-discharge positive results not reported; limited clinical data; chest CT results not reported for 5 patients; and results not stratified by anatomical site of specimen collection.
B. False-negative of RT-PCR and prolonged nucleic acid conversion in COVID-19: Rather than recurrenceexternal icon. Xiao et al. Journal of Medical Virology (Apr 9, 2020).
Key findings:
- Among 70 COVID-19 patients with 2 consecutive negative RT-PCR tests, 15 (21%) had a subsequent positive test result on RT-PCR using OP or deep NP swabs.
Methods: OP and NP swabs collected from patients after the onset of symptoms. Limitations: Patient inclusion criteria unclear; no description of timing, frequency, and intervals of specimen collection; methods of specimen collection, handling, and storage not described; Ct values of positive results not reported; no clinical or radiographic descriptions of those with recurrent positive test results; no information on test results following the positive test result.
Implications of two studies (Yuan et al. & Xiao et al.): Sporadic positive RT-PCR test results can recur after clinical recovery and ≥2 sequential negative tests. The significance of these positive results is unclear in the absence of Ct values and attempts to recover virus in culture.
Treatments for COVID-19
- Sanders et al. Pharmacologic treatments for coronavirus disease 2019 (COVID-19): A reviewexternal icon. JAMA. Literature review of the current evidence for different treatment options, including select repurposed drugs, investigational drugs, and adjunctive therapies.
- Rome et al. Perspective: Drug evaluation during the COVID-19 pandemicexternal icon. NEJM. Discusses the need to act as efficiently and as quickly as possible while maintaining the highest scientific standards to issue guidelines and to find effective treatments, with discussion focused on FDA’s EUA for hydroxychloroquine.
- Goodman et al. Finding effective treatments for COVID-19: scientific integrity and public confidence in a time of crisisexternal icon. JAMA. Speaks to the importance of maintaining scientific integrity and public confidence, given how intense pressure and hope are combing to start ill-advised & uncontrolled human experimentation with unproven treatments.
Other Topics
- Anfinrud et al. Visualizing speech-generated oral fluid droplets with laser light scatteringexternal icon. NEJM. Visualization of the trajectory and decrease in the number of speech-generated droplets in a masked versus unmasked individual. Watch the 41-second video hereexternal icon.
- Bauchner et al. A bold response to the COVID-19 pandemic: Medical students, national service, and public healthexternal icon. Authors propose suspending medical school for incoming students, instead starting them in a public health service program to increase capacity at the local/state levels for community surveillance and response.
- Wakam et al. Not dying alone — Modern compassionate care in the COVID-19 pandemicexternal icon. NEJM. Discussion of the issue of dying alone when infected with COVID-19, including proposed solutions to help connect patients with family members while keeping everyone safe.
- Rubin R. Finding ways to reduce coronavirus exposure during dialysisexternal icon. JAMA. Discusses reducing coronavirus exposure during dialysis, such as minimizing exposures, segregating centers by COVID-19 status, moving dialysis to patients’ homes, and considering reducing number of hours on dialysis during the pandemic.
Disclaimer: The purpose of the CDC COVID-19 Science Update is to share public health articles with public health agencies and departments for informational and educational purposes. Materials listed in this Science Update are selected to provide awareness of relevant public health literature. A material’s inclusion and the material itself provided here in full or in part, does not necessarily represent the views of the U.S. Department of Health and Human Services or the CDC, nor does it necessarily imply endorsement of methods or findings. While much of the COVID-19 literature is open access or otherwise freely available, it is the responsibility of the third-party user to determine whether any intellectual property rights govern the use of materials in this Science Update prior to use or distribution. Findings are based on research available at the time of this publication and may be subject to change.

