COVID-19 Science Update released: April 7, 2020 Edition 2

The COVID-19 Science Update summarizes new and emerging scientific data for public health professionals to meet the challenges of this fast-moving pandemic. Weekly, staff from the CDC COVID-19 Response and the CDC Library systematically review literature in the WHO COVID-19 databaseexternal icon, and select publications and preprints for public health priority topics in the CDC Science Agenda for COVID-19 and CDC COVID-19 Response Health Equity Strategy.
PDF version of this update pdf icon[PDF – 2 MB]
Here you can find all previous COVID-19 Science Updates.
PEER-REVIEWED
Viral dynamics in mild and severe cases of COVID-19external icon. Liu et al. Lancet Infectious Diseases (March 19, 2020).
Key findings:
- Patients with severe COVID-19 (n = 30) had greater viral burden in NP swabs than those with mild COVID-19 (n = 46) during the 12 days after illness onset (Figure A).
- Patients with severe COVID-19 cleared viral burden later compared to those with mild COVID-19 (Figure B).
Methods: 76 patients hospitalized with lab-confirmed COVID-19 from January 21 to February 4, 2020 (Nanchang, China). Ct values for viral burden in serial NP swabs were presented as the absolute difference between the measured value and a reference value (ΔCt). Severe COVID-19 was defined as presence of respiratory distress, O2 saturation ≤93%, PaO2/FiO2 ratio ≤300 mm Hg, or severe disease complications (e.g., respiratory or other organ failure, mechanical ventilation, septic shock).
Implications: Severe COVID-19 was associated with higher viral burden and delayed viral clearance. Patients with severe COVID-19 may require longer isolation.
Figure:
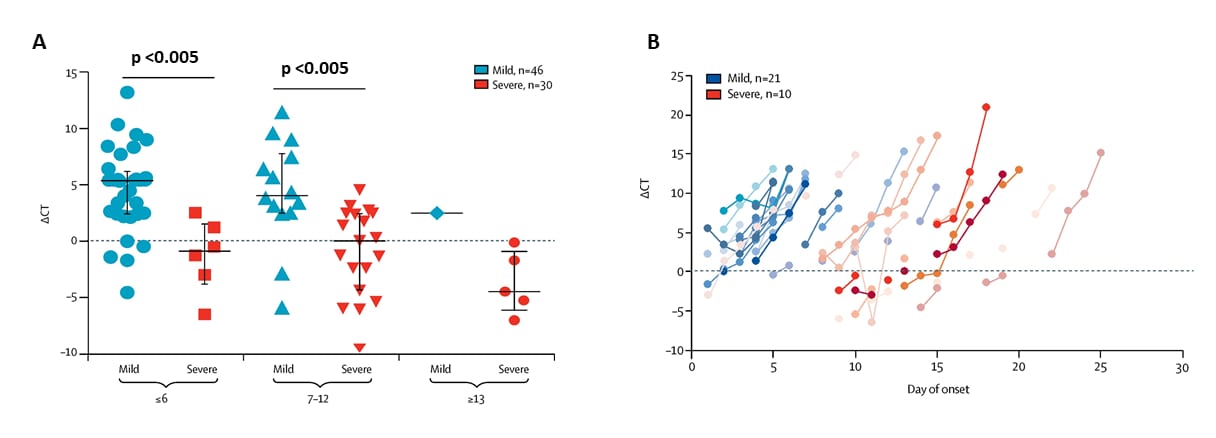
Note: Adapted from Liu et al. ΔCt values on y-axes in both figures reflect “decreasing absolute viral burden in NP swabs” and represent the difference in Ct value between the specimen and a reference value. Lower Ct value corresponds to greater viral burden. This article was published in Lancet Infectious Diseases, Volume 20, Issue 6, Liu et al., Viral dynamics in mild and severe cases of COVID-19, Pages 656-657, Copyright Elsevier 2020. This article is currently available at the Elsevier COVID-19 resource center: https://www.elsevier.com/connect/coronavirus-information-centerexternal icon.
Community prevalence of SARS-CoV-2 among patients with influenza like illnesses presenting to a Los Angeles Medical Center in March 2020external icon. Spellberg et al. JAMA (March 31, 2020).
Key findings:
- During March 12–13 and 15–16, 2020, seven (5.3%) of 131 persons with mild influenza like illness (ILI) presenting as outpatients to Los Angeles Medical Center tested positive for SARS-CoV-2.
- All tested negative for influenza and respiratory syncytial virus (RSV).
- Rates of ILI in LA County in March 2020 were increased compared with prior years (Figure A), while the fraction of influenza-positive tests declined (Figure B).
Methods: Screening study conducted among persons presenting with mild ILI and without risk factors to Los Angeles Medical Center during March 12–13 and 15–16, 2020. NP swabs tested by PCR for influenza, RSV, and SARS-CoV-2. Persons with travel exposure, known contact with traveler, or who were severely ill and admitted for respiratory tract infection were excluded from this analysis. Limitations: Testing for SARS-CoV-2 conducted during daytime only; single medical center.
Implications: The 5% rate of SARS CoV-2 among people with mild ILI suggests transmission in the community, suggesting need for stronger mitigation strategies.
Figure:
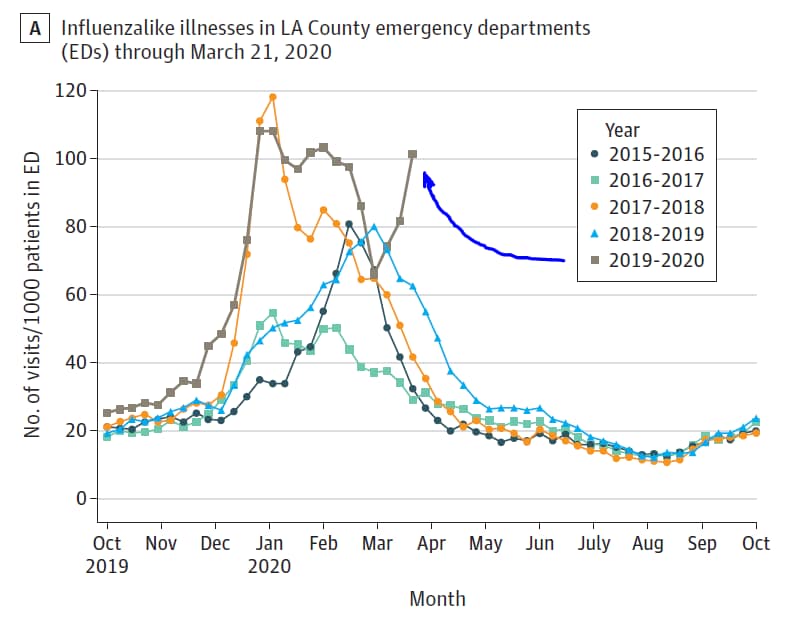
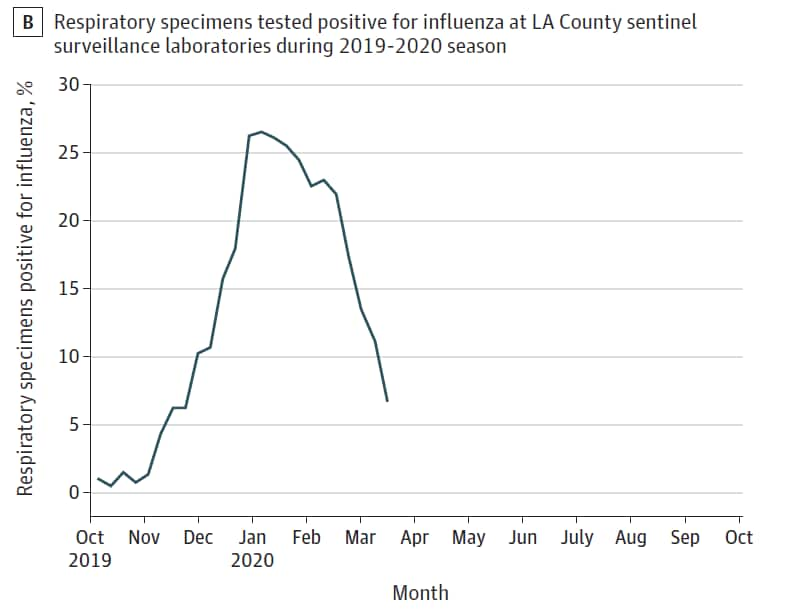
Note: Adapted from Spellberg et al. Epidemiological curve of influenza like illnesses through March 21, 2020, and percentage of positive test results for influenza at sentinel surveillance sites across Los Angeles County, California. Reproduced with permission from JAMA. doi:10.1001/jama.2020.4958. Copyright©2020 American Medical Association. All rights reserved.
PEER-REVIEWED
Identifying locations with possible undetected imported severe acute respiratory syndrome coronavirus 2 cases by using importation predictions. De Salazar et al. Emerging Infectious Diseases (March 24, 2020).
Key findings:
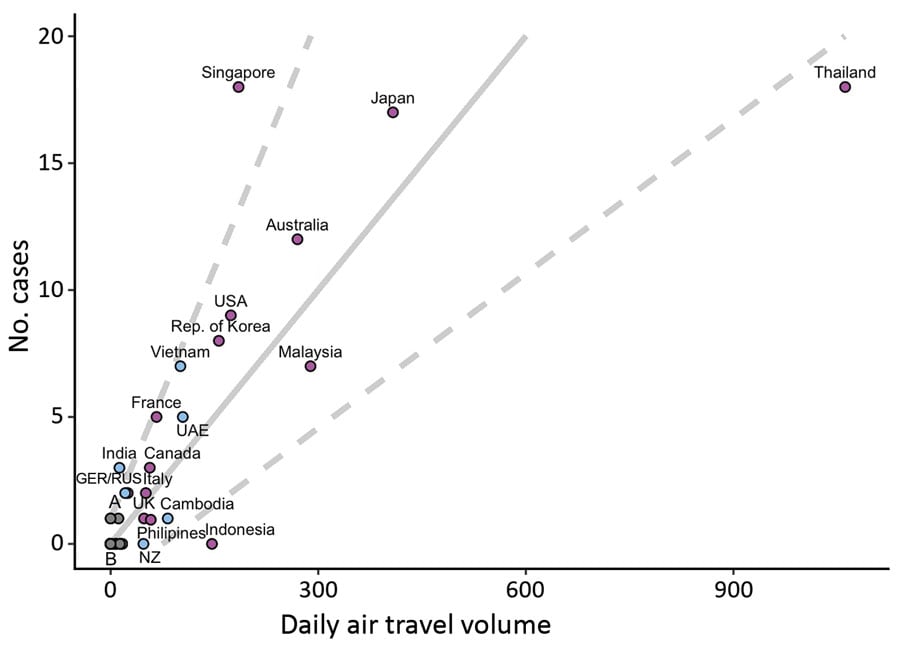
- Using daily air travel volumes from Wuhan, China, modelers found that some countries had fewer than expected imported-and-reported COVID-19 cases, whereas other countries had more than expected.
- The authors calculated that for every 31 passengers arriving by air from Wuhan, one additional imported-and-reported case of a COVID-19 is expected.
Methods: Authors developed generalized linear regression models using surveillance capacity data, imported-and-reported COVID-19 cases, and daily air travel volumes from Wuhan, China. Imported-and-reported case counts for 149 locations were used to predict undetected imported cases.
Implications: This model suggests capacity to detect importation of COVID-19 varies. The model (available on GitHubexternal icon and modifiable) may help identify locations with limited capacity to detect imported COVID-19.
Figure:
Note: Adapted from De Salazar et al. Regression plot shows the number of possible undetected COVID-19 cases by daily air travel volume from Wuhan, China. Solid gray line=expected imported-and-reported cases; Dashed gray lines=95% prediction interval (PI). Locations above 95% PI (i.e., Singapore, India) have higher estimated detection capacity than those below (i.e., Thailand, Indonesia). Location colors differ by surveillance capacity (purple = high; blue = low; gray = mixed). Open access journal; all content freely available. Open access journal; all content freely available.
PREPRINTS (NOT PEER-REVIEWED)
Susceptibility of ferrets, cats, dogs, and different domestic animals to SARS-coronavirus-2external icon. Shi et al. bioRxiv (Mar 31, 2020). Publishedexternal icon in Science (May 29, 2020).
Key findings:
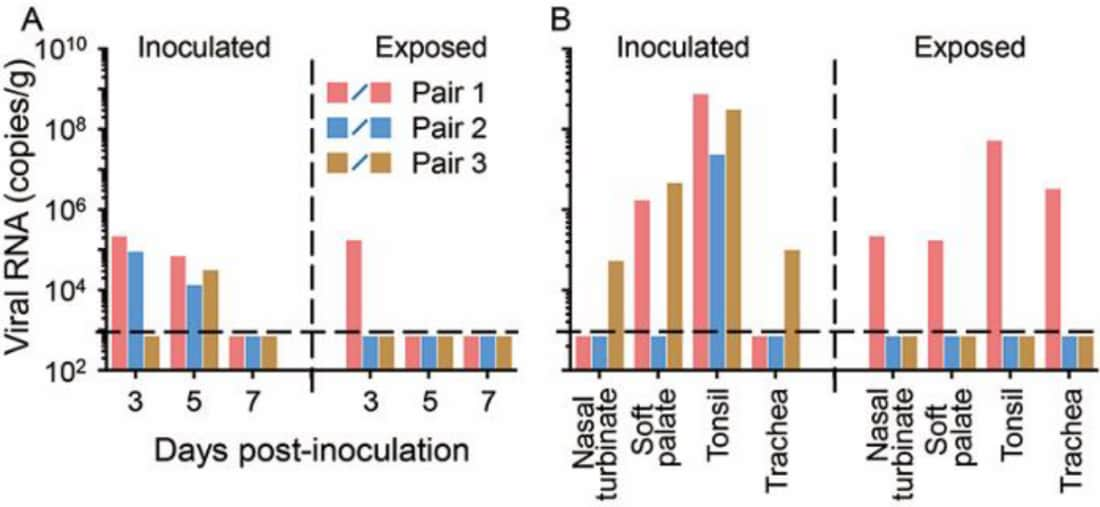
- After viral inoculation, SARS-CoV-2 replicated in the upper respiratory tract of cats and ferrets.
- SARS-CoV-2 detected in two of three non-inoculated cats housed near, but without contact with, three inoculated cats.
- SARS-CoV-2 did not replicate efficiently in dogs, pigs, chickens, or ducks.
Methods: Animals were inoculated with infectious SARS-CoV-2 to assess viral replication and transmission using PCR, plaque reduction neutralization tests, ELISA, and immunohistological assays of organ tissues. Sample sizes: cats (n = 18), ducks (n = 8), chickens (n = 8), pigs (n = 8), dogs (n = 7), ferrets (unclear, but n ≥ 23).
Implications: SARS-CoV-2 virus replicates efficiently in ferrets and cats, and is potentially transmissible between cats via respiratory droplets.
Figure:
Note: From Shi et al. (A) Viral RNA isolated from feces of cats inoculated with SARS-CoV-2 and from feces of healthy uninfected cats exposed to inoculated cats by day after inoculation. (B) Viral RNA detected in various tissues from inoculated cats and from same tissues in uninfected and exposed cats 11–12 days after inoculation or exposure. Licensed under CC-BY-NC-ND 4.0.
Estimating the number of infections and the impact of non-pharmaceutical interventions on COVID-19 in 11 European countriesexternal icon. Flaxman et al. Imperial College London (Mar 30, 2020). Updated analysisexternal icon published in Nature (June 8, 2020).
Key findings:
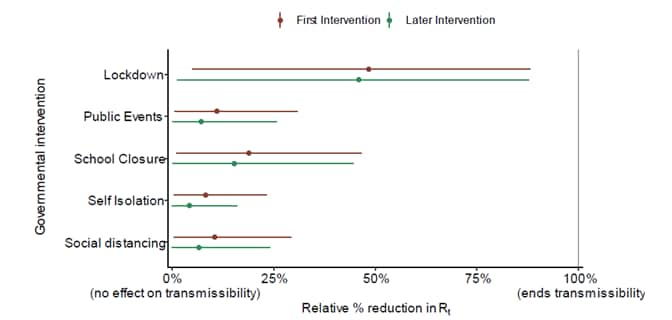
- Modelers forecast that non-pharmaceutical interventions (e.g., movement restrictions and social distancing) across 11 European countries averted ~59,000 (21,000–120,000) deaths up to March 31st; effective reproduction number declined by 64% (from 3.87 to 1.43).
- Across all 11 countries, an estimated 7–43 million individuals (1.9%–11.4% of population) were infected with SARS-CoV-2.
Methods: Novel Bayesian mechanistic model of infection cycle fit to observed deaths in 11 European countries, fit jointly to COVID-19 data from 11 countries using data up to March 28. Interventions included lockdown (regulations/legislations restricting face-to-face social interaction), cancelling public events, school closures, self-isolation, and social distancing. Assumptions: Interventions achieve a similar impact in different countries; intervention efficacy was constant over time. Thus, greater weight contributed by countries with more deaths and earlier implementation of interventions. Limitations: High level of uncertainty in estimates; too early to detect impacts in countries at earlier stages of epidemic; interventions occurred close in time to each other, so independent effects uncertain.
Implications: Non-pharmaceutical interventions resulted in fewer COVID-19 infections and deaths.
Figure:
Note: From Flaxman et al. Model includes five covariates for governmental interventions, adjusting for whether intervention was the first undertaken (red) or was subsequent to other interventions (green). Mean relative percentage reduction in 𝑹𝒕 is shown with 95% posterior credible intervals. If 100% reduction is achieved, there is no more transmission of COVID-19. Licensed under CC-BY-NC-ND 4.0.
PEER-REVIEWED
Association of cardiac injury with mortality in hospitalized patients with COVID-19 in Wuhan, Chinaexternal icon. Shi et al. JAMA Cardiology (March 25, 2020).
Key findings:
- Among 416 persons hospitalized with COVID-19, 19.7% experienced cardiac injury (i.e., elevated high-sensitivity troponin I) during their admission.
- Patients with cardiac injury were older (median age 74 vs 60 years) and had more comorbidities (e.g., hypertension in 60% vs 23%).
- High proportions of patients with underlying health conditions had cardiac injury.
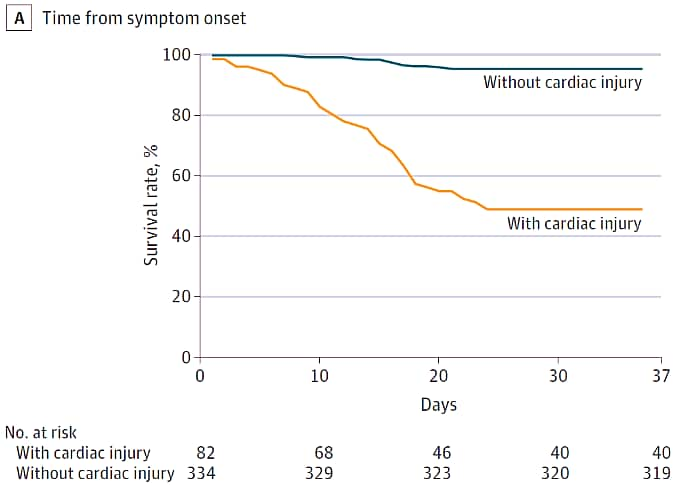
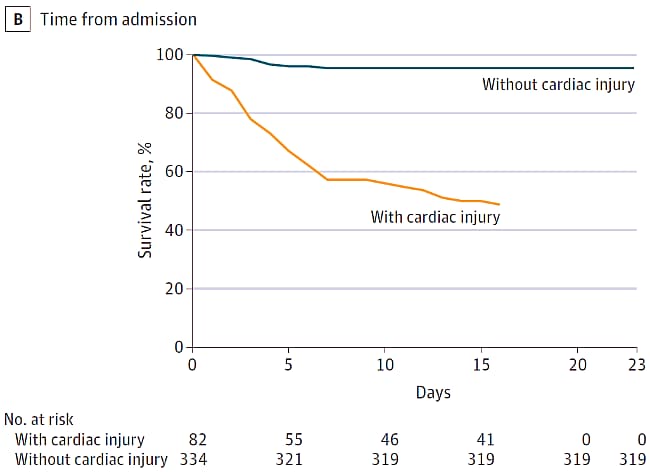
- 51% of patients with cardiac injury died compared to 5% without cardiac injury (Figure).
- Patients with cardiac injury were more likely to require invasive mechanical ventilation (46% vs 4%) and to have ARDS (56% vs. 15%) and acute renal injury (9% vs 0.3%).
- After multivariable adjustment, cardiac injury and ARDS were associated with death following admission.
Methods: Cohort study of 416 hospitalized adults (≥21 years of age) with COVID-19, consecutively admitted between January 20 and February 10, 2020 and with follow-up through February 15, 2020 (Renmin Hospital, Wuhan, China). Investigators assessed the incidence of cardiac injury (serum troponin-I levels above 99th-percentile upper limit) and associations of cardiac injury with mortality. Survival curves plotted by Kaplan-Meier method and compared using log-rank test. Multivariable Cox proportional hazard regression models were used to evaluate risk factors for COVID-19-associated death.
Implications: Cardiac injury was common among patients admitted with COVID-19, especially among those with underlying health conditions, and was associated with higher mortality than those without cardiac injury.
Figure:
Note: Adapted from Shi et al. Kaplan-Meier survival curves among COVID-19 patients with and without cardiac injury from (A) time from symptom onset and (B) time from admission. Both panels indicate a significantly lower survival rate for COVID-19 cases with cardiac injury as compared to cases without cardiac injury. Reproduced with permission from JAMA Cardiol. doi:10.1001/jamacardio.2020.0950. Copyright©2020 American Medical Association. All rights reserved.
Self-reported olfactory and taste disorders in SARS-CoV-2 patients: A cross-sectional studyexternal icon. Giacomelli et al. Clinical Infectious Diseases (March 26, 2020).
Key findings:
- Twenty of 59 COVID-19 patients reported olfactory and/or taste disorder (Figure).
- 20.3% prior to hospitalization.
- 13.5% during hospitalization.
- Olfactory/taste disorders were more common among women (52.6%) than men (25%, p =0.04); those with olfactory/disorders were younger (median: 56 years) than those without (median: 66 years, p =0.04).
Methods: Cross-sectional study of interviewed COVID-19 patients hospitalized in Milan, Italy. Limitations: Small sample size.
Implications: One-third of COVID-19 patients from a small sample in Milan, Italy reported smell and/or taste disorders. These disorders were more prevalent among females, but females have a better sense of smellexternal icon and may be more likely to notice subtle losses. Better understanding of the timing of symptom onset, whether these symptoms occur in mild or otherwise pre-symptomatic COVID-19 cases, and viral load of patients with such symptoms are warranted.
Figure:
Note: Adapted from Giacomelli et al. Proportion of COVID-19 patients with taste and olfactory disorders. Available via Oxford University Press Public Health Emergency Collection through PubMed Central.
PEER-REVIEWED
Quantitative detection and viral load analysis of SARS-CoV-2 in infected patientsexternal icon. Yu et al. Clinical Infectious Diseases (March 28, 2020).
Key Findings:
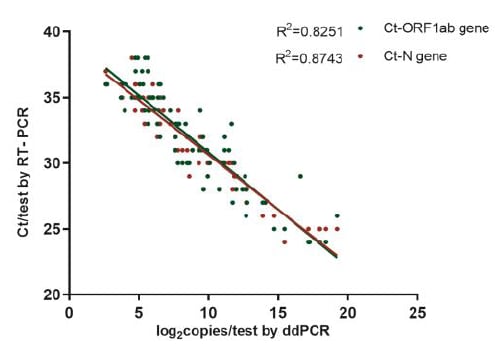
- In 95 samples with positive SARS-CoV-2, droplet digital PCR (ddPCR) were highly correlated with quantitative RT-PCR results (Figure 1).
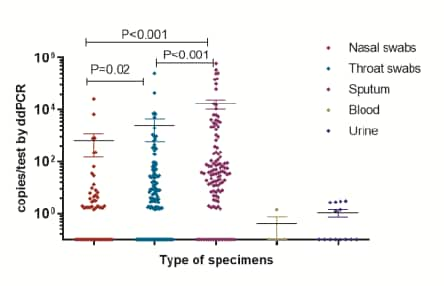
- ddPCR detected SARS-CoV-2 in 16.4% of nasal swabs, 37.3% of throat swabs, and 66.4% of sputum samples; no SARS-CoV-2 detected in blood or urine.
- By ddPCR, the average viral load in sputum was higher than in throat swabs and nasal swabs (Figure 2)
- Among the 161 samples with negative RT-PCR results, 4 (2.5%) samples were positive by ddPCR.
Methods: 323 samples from 76 hospitalized patients with COVID-19 (Beijing, China) assessed using ddPCR and RT-PCR. PCR targets were two SARS-CoV-2 genes (ORF1ab and N). Droplet Digital PCR technologyexternal icon (ddPCR) is a digital PCR method utilizing a water-oil emulsion droplet system; the droplets serve essentially the same function as individual test tubes or wells in a plate in which the PCR reaction takes place, albeit in a much smaller format. Limitations: Did not analyze ‘matched’ specimens for individual patients; unknown if sputum and swabs collected uniformly across disease course.
Implications: Droplet digital PCR (ddPCR) results are highly correlated with RT-PCR results for SARS CoV-2 detection. Testing of sputum samples may better reflect the level of viral replication than throat and nasal swabs.
Figure 1
Figure 2
Note: Adapted from Yu et al. Figure 1 shows correlation between RT-PCR and ddPCR results. Figure 2 shows that the highest amount of virus was found in sputum, less in throat and nasal swabs. Available via Oxford University Press Public Health Emergency Collection through PubMed Central.
- Akiyama et al. Flattening the curve for incarcerated populations – COVID-19 in jails and prisonsexternal icon. NEJM. The better the mitigation job done by legal, public health, and correctional health partnerships, the lighter the burden correctional facilities and their surrounding communities will bear.
- Fineburg H. Ten weeks to crush the curveexternal icon. NEJM. Six points to “crush the curve” in 10 weeks: 1. Unified command, 2. Increased testing, 3. PPE/equipment for healthcare workers, 4. Triage population into 5 groups, 5. Mobilize the public, 6. Real-time fundamental research.
Coronavirus Disease Portal (COVID-19 GPH) is an online, continuously updated, searchable database of published scientific literature, CDC and NIH resources, and other materials that capture emerging discoveries and applications of genomics, molecular and other precision medicine and precision public health tools in the investigation and control of coronaviruses, such as COVID-19, MERS-CoV, and SARS. The Portal is maintained by the Office of Genomics and Precision Public Health at the CDC.
In the April 1, 2020 Science Update, in the summary for Onder et al. JAMA (Mar 23, 2020), the vertical (y) axis in Figure 2 was mislabeled. The correct label is “Case fatality (%), calculated as no. deaths/no. cases”. The figure has been corrected online.
Disclaimer: The purpose of the CDC COVID-19 Science Update is to share public health articles with public health agencies and departments for informational and educational purposes. Materials listed in this Science Update are selected to provide awareness of relevant public health literature. A material’s inclusion and the material itself provided here in full or in part, does not necessarily represent the views of the U.S. Department of Health and Human Services or the CDC, nor does it necessarily imply endorsement of methods or findings. While much of the COVID-19 literature is open access or otherwise freely available, it is the responsibility of the third-party user to determine whether any intellectual property rights govern the use of materials in this Science Update prior to use or distribution. Findings are based on research available at the time of this publication and may be subject to change.

