COVID-19 Science Update released: April 2, 2021 Edition 83

The COVID-19 Science Update summarizes new and emerging scientific data for public health professionals to meet the challenges of this fast-moving pandemic. Weekly, staff from the CDC COVID-19 Response and the CDC Library systematically review literature in the WHO COVID-19 databaseexternal icon, and select publications and preprints for public health priority topics in the CDC Science Agenda for COVID-19 and CDC COVID-19 Response Health Equity Strategy.
Section headings in the COVID-19 Science Update align with the CDC Science Agenda for COVID-19.
Section headings in the COVID-19 Science Update have been changed to align
with the CDC Science Agenda for COVID-19.
Here you can find all previous COVID-19 Science Updates.
PEER-REVIEWED
Routine asymptomatic testing strategies for airline travel during the COVID-19 pandemic: a simulation study.external icon Kiang et al. Lancet Infectious Diseases (March 22, 2021).
Key findings:
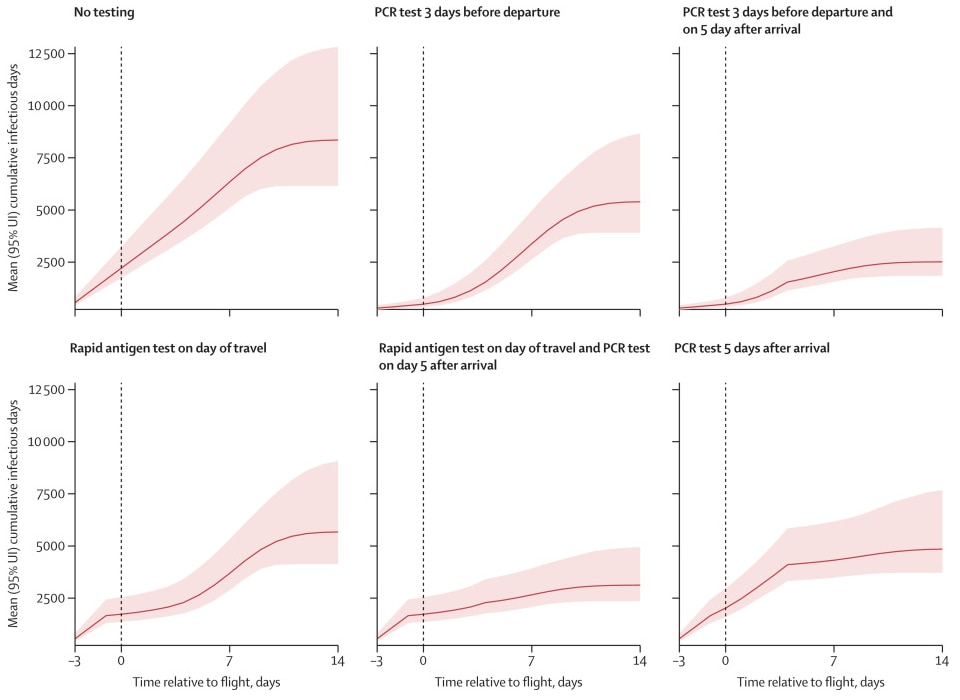
- With no SARS-CoV-2 testing or screening (base case scenario), there would be 649 (95% uncertainty interval [UI] 505-950) actively infectious passengers on the day of travel among 100,000 passengers and 8,357 (95% UI 6,144-12,831) infectious days (Figure). Compared with the base case:
- Pre-travel PCR testing alone would reduce expected infectious days by 36% (95% UI 29%-41%) or, with the addition of post-travel quarantine and PCR, by 70% (95% UI 64%-75%).
- Day of travel rapid antigen testing alone would reduce expected infectious days by 32% (95% UI 26%-38%) or, with the addition of post-travel quarantine and PCR, by 63% (95% UI 58%-66%).
- Post-travel PCR testing alone would reduce the number of infectious days by 42% (95% UI 35%-49%).
Methods: Microsimulation model of SARS-CoV-2 transmission in a hypothetical cohort of 100,000 US domestic airline travelers to evaluate the effectiveness of routine testing and quarantine strategies on passenger and population level SARS-CoV-2 risk over the travel period. The model incorporated publicly available data on COVID-19 clinical cases, published natural history parameters, and a daily incidence of 150 infections per 100,000 people. Limitations: High adherence to testing, quarantine and self-isolation was assumed; model was static and did not differentiate risk of flights by size or duration; analysis did not include effects of vaccination.
Implications: Testing for SARS-CoV-2 with a rapid antigen test on the day of departure or RT-PCR 3 days before departure could reduce the risk of transmission during travel. The addition of post-travel testing, and 5-day quarantine could further reduce importation and ongoing transmission in the destination city, especially for travel from high to low incidence settings.
Figure:
Note: Adapted from Kiang et al. Predicted number of cumulative SARS-CoV-2 infectious days (y axis) over the travel period under different test-and-travel strategies. The x axis shows the time over the simulation (in days) relative to the day of travel (vertical dashed line). Solid lines show the mean and shaded areas the 95% uncertainty interval (UI) across 3,000 simulations. Reprinted from The Lancet Infectious Diseases, available online 23 March 2021, Kiang et al., Routine asymptomatic testing strategies for airline travel during the COVID-19 pandemic: a simulation study. Copyright (2021), with permission from Elsevier.
Vaccine efficacy reported from clinical trials may not be replicated in real world settings. Here we present findings from 2 studies (Keehner et al. and Shah et al.) conducted among health care workers, who were among the first to receive SARS-CoV-2 vaccines.
PEER-REVIEWED
A. SARS-CoV-2 infection after vaccination in health care workers in Californiaexternal icon. Keehner et al. NEJM (March 23, 2021).
Key findings:
- Two weeks or more after health care workers (HCWs) at the University of California, San Diego (UCSD) and at the University of California, Los Angeles (UCLA) received a 2nd dose of mRNA vaccine, SARS-CoV-2 incidence was rare (positivity rate = 0.05%).
- Risk of testing positive for SARS-CoV-2 after vaccination was 1.19% among UCSD HCWs and 0.97% among UCLA HCWs.
Methods: Between December 16, 2020 and February 9, 2021, 36,659 HCWs at UCSD and UCLA received the 1st dose of vaccine; 28,184 of these persons received the 2nd dose. At UCSD, in addition to testing symptomatic persons, mandated weekly testing of asymptomatic persons began December 2, 2020. UCLA instituted an optional testing programs for HCWs on December 26, 2020. Limitations: Results from HCWs may not be generalizable; did not differentiate by vaccine.
PREPRINTS (NOT PEER-REVIEWED)
B. Effect of vaccination on transmission of COVID-19: an observational study in healthcare workers and their householdsexternal icon. Shah et al. medRxiv (March 21, 2021). Published in NEJM as Effect of vaccination on transmission of SARS-CoV-2external icon (October 28, 2021).
Key findings:
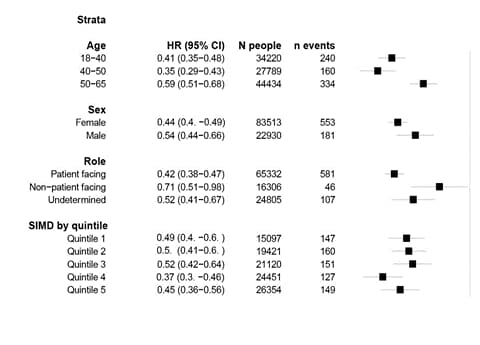
- Among different health care roles, the strongest association between vaccination and documented COVID-19 cases was seen in healthcare workers (HCWs) with patient-facing roles (hazard ratio [HR] 0.42, 95% CI 0.38-0.47) (Figure).
- Vaccinating HCWs was associated with a reduction in documented COVID-19 cases among household members (HR 0.70, 95% CI 0.63-0.78).
Methods: Cohort study of 144,525 HCWs and 194,362 household members in Scotland between December 8, 2020 and March 3, 2021. COVID-19 cases and hospitalizations were documented in vaccinated and unvaccinated HCWs and household members. Limitations: Household members could be infected via other routes, and thus the 30% relative risk reduction could be an underestimate.
Figure:
Note: Adapted from Shah et al. HR for documented COVID-19 from 14 days onwards post first dose in healthcare workers compared to the unvaccinated period by age, sex, healthcare role, and deprivation (SIMD: Scottish Index of Multiple Deprivation). Licensed under CC BY 4.0.
Implications for both studies (Keehner et al. and Shah et al.): Data from large studies of HCWs in the US (Keehner et alexternal icon. and Daniel et al.external icon), Scotlandexternal icon, and Israelexternal icon show that vaccination is effective at reducing SARS-CoV-2 incidence in a real world setting. Shah et al. found that SARS-CoV-2 vaccination also reduced documented cases and hospitalization in household members.
PEER-REVIEWED
Stochastic sampling effects favor manual over digital contact tracingexternal icon. Mancastroppa et al. Nature Communications (March 26, 2021).
Key findings:
- Compared to digital contact tracing, manual contact tracing is more efficient in limiting the height of the epidemic peaks and reducing the number of individuals who need to isolate.
- Where both protocols are adopted simultaneously, manual contact tracing leads to a considerable reduction of transmission even considering delays and scalability, while the digital protocol produces a relevant contribution only for large adoption rates.
- Superspreaders’ multiple contacts provide many opportunities to trace them manually, but members of a social network might be similar to each other in decisions to use a contact tracing app or not; networks not adopting the app are completely invisible to digital contact tracing.
Methods: Modeled effectiveness of digital (app-based) and manual (interview-based) contact tracing using parameters tailored for SARS-CoV-2 diffusion within the activity-driven model, a general empirically validated framework for network dynamics. Limitations: Costs and practical concerns need to be considered when using digital or hybrid contact tracing strategies.
Implications: Digital contact tracing should only be used in combination with manual contact tracing and cannot be considered simply a cheaper and more rapid way of implementing standard contact tracing.
PREPRINTS (NOT PEER-REVIEWED)
The B.1.1.7 variant was first identified in the U.K. and has increasingly been reported in the US.
A. First and second SARS-CoV-2 waves in inner London: A comparison of admission characteristics and the impact of the B.1.1.7 variant.external icon Snell et al. medRxiv (March 24, 2021). Published in BMJ Open as Descriptive comparison of admission characteristics between pandemic waves and multivariable analysis of the association of the Alpha variant (B.1.1.7 lineage) of SARS-CoV-2 with disease severity in inner Londonexternal icon (February 2022).
Key findings:
- Two dominant waves of hospital admissions with SARS-CoV-2 were detected.
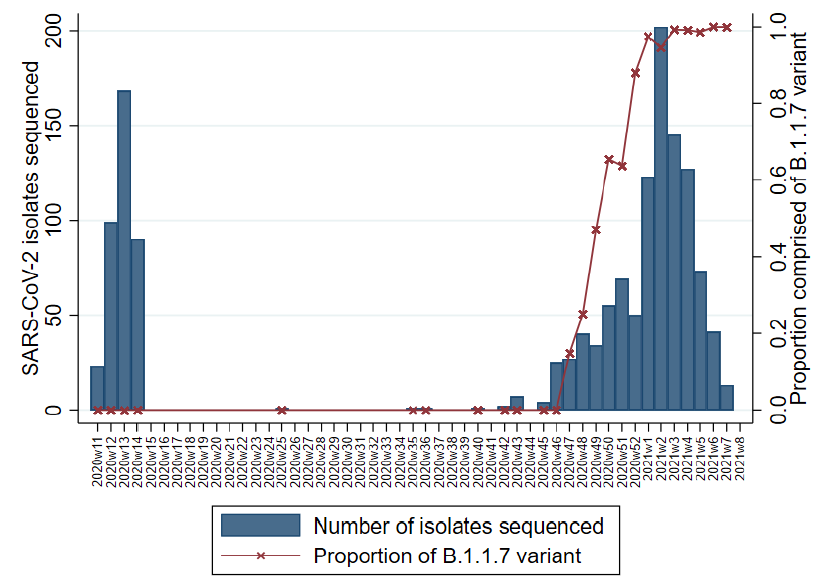
- The proportion of admissions with the B.1.1.7 variant increased during the second wave and accounted for 97% of sequenced isolates in January 2021 (Figure).
- Patients with the B.1.1.7 variant more frequently had hypoxia on admission than patients with non-B.1.1.7 variants (70.0% vs. 62.5%).
Methods: Electronic health record data from a multisite inner-city London hospital for all SARS-CoV-2 cases (n = 5,810) between March 13, 2020 and February 17, 2021 were linked with viral sequencing data. Limitations: Results may not be generalizable to other clinical settings.
Figure:
Note: Adapted from Snell et al. Number of cases with sequenced SARS-CoV-2 isolates by epi-week and the proportion with B.1.1.7 from March 13, 2020 (2020w11) through February 17, 2021 (2021w8). Licensed under CC-BY-NC-ND 4.0.
B. Rapid, widespread, and preferential increase of SARS-CoV-2 B.1.1.7 variant in Houston, TX, revealed by 8,857 genome sequences.external icon Musser et al. medRxiv (March 24, 2021).
Key findings:
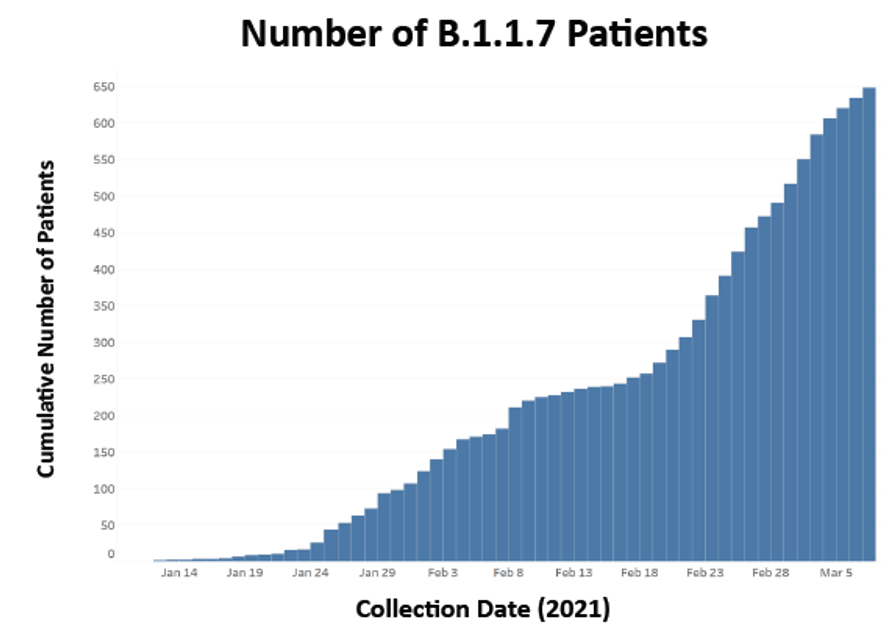
- There was a rapid, widespread increase of the B.1.1.7 SARS-CoV-2 variant (Figure):
- Case doubling time was estimated to be 6.91 days (95% CI 5.02-11.08).
- 648 cases with variant B.1.1.7 were identified; none had the E484K mutation.
- No significant difference in patient age, gender, median length of hospitalization, or mortality was observed between cases with and without the B.1.1.7 variant.
Methods: Identified variants of concern based on sequence data from 8,857 SARS-CoV-2 patient samples from the Houston Methodist hospital system, representing 4.8% of reported COVID-19 cases in metropolitan Houston between January 1 and March 7, 2021. Limitations: One hospital system within a limited geographical area; sample likely underrepresents pediatric patients and patients with challenges accessing care.
Figure:
Note: Adapted from Musser et al. Epidemiological curve of COVID-19 cases caused by the B.1.1.7 SARS-CoV-2 variant in the Houston Methodist hospital system from January 1-March 7, 2021. Used by permission of authors.
Implications for both studies (Snell et al. and Musser et al.): The rate of increase in COVID-19 cases with the B.1.1.7 variant in 2 areas highlights its increased transmissibility; some data (Snell et al.external icon; Grint et al.external icon) suggest increased illness severity, reinforcing the urgency of vaccination and other mitigation efforts.
The effect of in-person primary and secondary school instruction on county-level SARS-CoV-2 spread in Indiana.external icon Bosslet et al. medRxiv (March 20, 2021). Published in Clinical Infectious Diseases as The Effect of In-Person Primary and Secondary School Instruction on County-Level Severe Acute Respiratory Syndrome Coronavirus 2 Spread in Indianaexternal icon (January 1, 2022).
Key findings:
- 70,021 SARS-CoV-2 cases were reported from 73 Indiana counties between July 12 and October 6, 2020, averaging 805 cases per day (Figure).
- In-person primary and secondary school instruction was associated with a small but significant daily increase in SARS-CoV-2 cases/100,000 residents in the county 28 days later.
- A 10-percentage point increase in in-person instruction was predicted to increase daily new cases by 0.80%.
Methods: Evaluated association of proportion of students returning to in-person learning with community-wide daily SARS-CoV-2 cases per 100,000 residents at the county level in Indiana between July 12 and October 6, 2020 using a panel regression analysis, accounting for differences in masking and distancing enforcement. Included 73 of 92 Indiana counties, accounting for 85.7% of school corporations and 90.6% of student enrollment statewide. Limitations: Incomplete data on proportion of in-person instruction in each county; assumed proportion of students attending school in-person was constant over the analytic period; insufficient data to examine effects by grade or age.
Implications: Findings suggest in-person schooling might increase community transmission, but to a lesser extent than other indoor gatherings. Data from this and another recent study in Canada (Bignami-van Assche et alexternal icon.) support implementing precautions, including physical distancing and face coverings, when opening schools.
Figure:
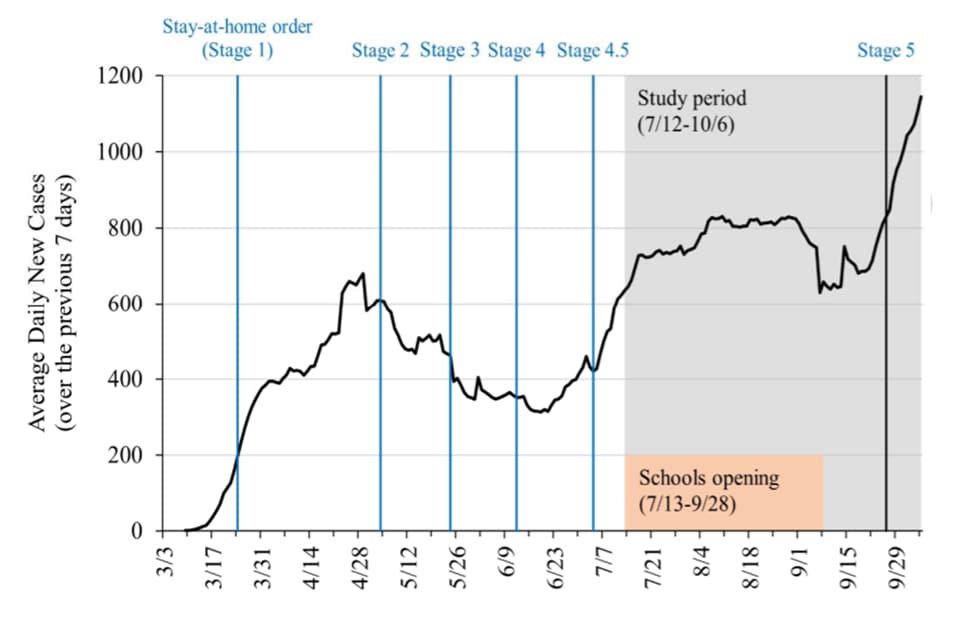
Note: Adapted from Bosslet et al. Average daily new SARS-CoV-2 cases over time for study counties including timeline of stages of Indiana re-opening, study period window, and window of schools re-opening. Licensed under CC-BY-NC-ND 4.0.
PEER-REVIEWED
Association of age with SARS-CoV-2 antibody response.external icon Yang et al. JAMA Network Open (March 22, 2021).
Key findings:
- Seroprevalence among pediatric (16.5%, 95% CI 14.4%-18.7%) and adult (18.6%, 95% CI 18.2%-19.1%) populations was similar.
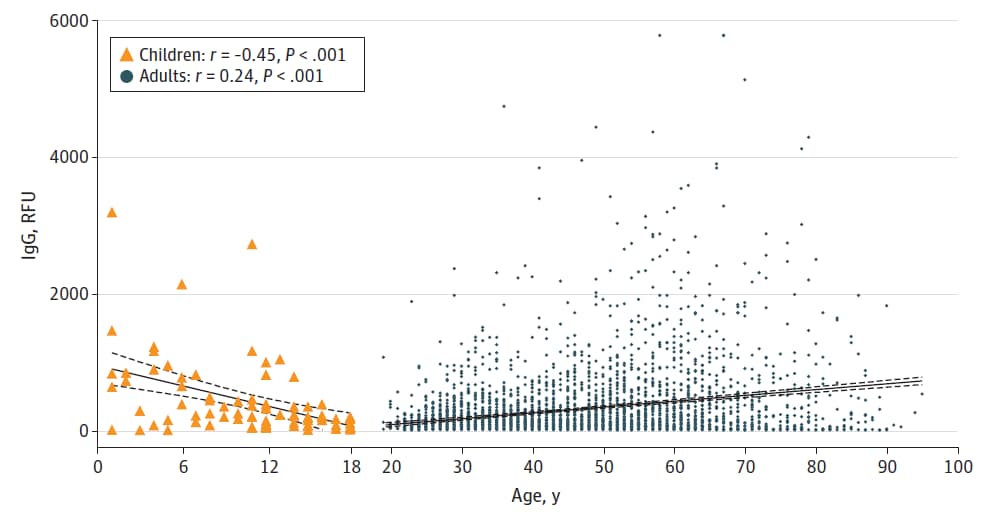
- SARS-CoV-2 IgG levels showed negative correlation with age in the pediatric population (r = -0.45, p <0.001) and positive correlation with age in adults (r = 0.24, p <0.001) (Figure).
- In patients ages 1 to 24 years, SARS-CoV-2 IgG and total antibody levels, neutralizing activity, and avidity were negatively correlated with age.
Methods: Cross-sectional study including 31,426 SARS-CoV-2 antibody tests performed between April 9, 2020 and August 31, 2020 from pediatric (1–18 years) and adult (>18 years) inpatients and outpatients at a New York City hospital. Semiquantitative IgG levels from a subsample (85 pediatric and 3,648 adult patients) were compared between age groups. Limitations: Selection bias for testing given retrospective study using existing data; unknown time between disease onset and antibody testing.
Implications: Unexpectedly, patients ages 19–30 years showed lower antibody responses to SARS-CoV-2 than children and older adults. Differing antibody responses in pediatric and adult populations suggests that differences in clinical manifestations between these two groups may be due in part to age-related immune responses, potentially necessitating age-targeted strategies for disease screening and vaccine development.
Figure:
Note: Adapted from Yang et al. SARS-CoV-2 IgG levels from SARS-CoV-2 positive pediatric (n = 85) and adult (n = 2,648) patients. Lines show correlation between SARS-CoV-2 level and age. Licensed under CC BY.
Seroprevalence and humoral immune durability of anti-SARS-CoV-2 antibodies in Wuhan, China: a longitudinal, population-level, cross-sectional study.external icon He et al. The Lancet (March 20, 2021).
Key findings:
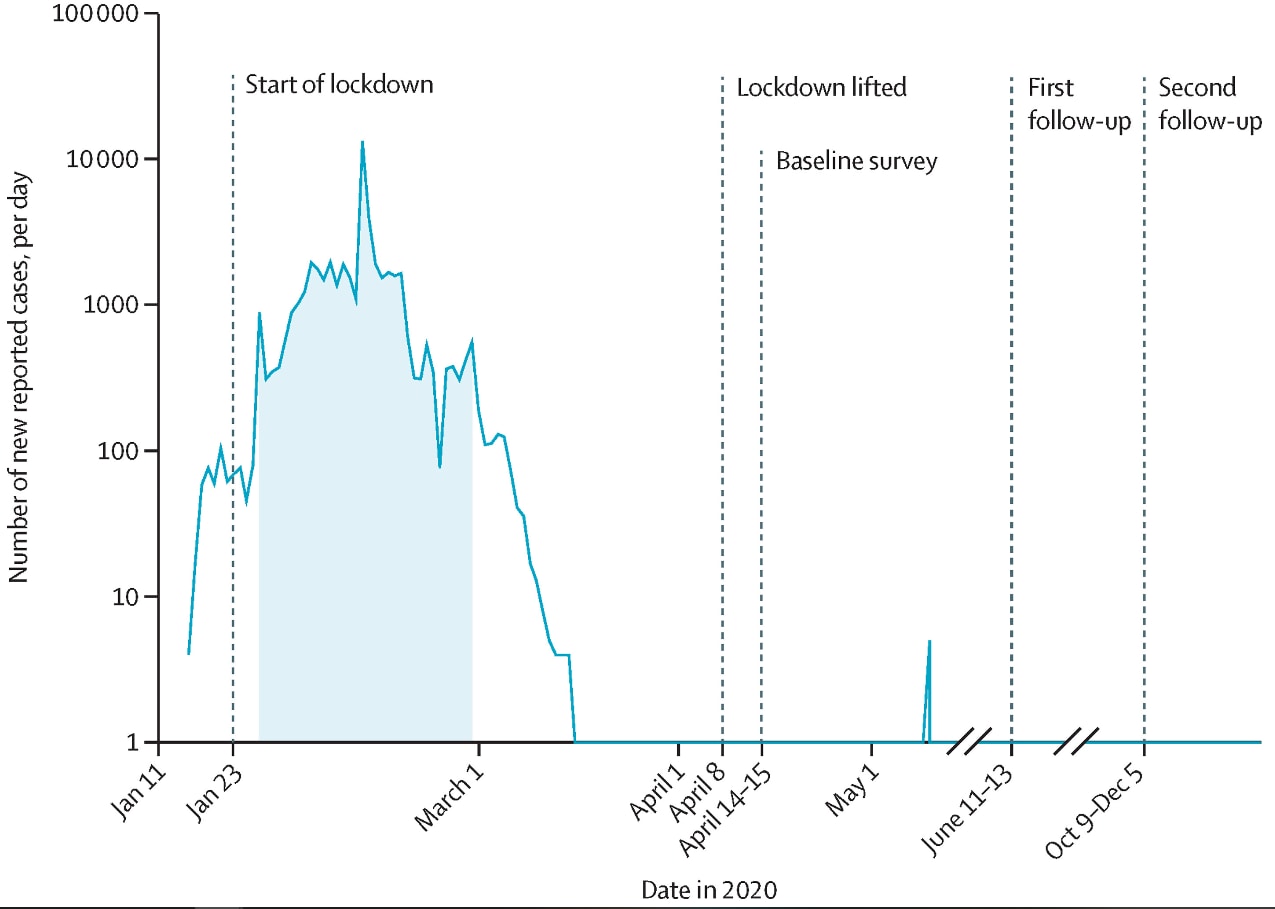
- More than 50,000 COVID-19 cases were reported in Wuhan as of April 8, 2020, when lockdown was lifted; few cases were reported after this date (Figure).
- Baseline seroprevalence among Wuhan residents was 6.92% (95% CI 6.41%-7.43%):
- 40% of antibody-positive individuals had neutralizing antibodies detected.
- >80% of antibody-positive individuals were asymptomatic.
- Levels of neutralizing antibodies did not significantly decrease over the study period.
Methods: Multistage, population-stratified, cluster random sample (n = 9,702) in Wuhan, China, of persons residing there for at least 14 days since December 1, 2019. Pan-immunoglobulin detection and neutralizing antibody activity were measured at baseline (April 2020, after the lockdown), and at two subsequent timepoints (June, and October–December 2020). Limitations: Uncertain when individuals were infected relative to antibody testing; may not be generalizable to other communities.
Implications: While neutralizing antibody activity in previously infected individuals remained at a relatively stable level for months, most individuals were still susceptible to SARS-CoV-2 infection after the epidemic subsided in Wuhan. These findings highlight the need for vaccinations as the main driver of protection against SARS-CoV-2 infection, as natural infection alone is unlikely to lead to community level protection.
Figure:
Note: Adapted from He et al. Timeline of new reported cases in Wuhan, China, and the follow-up period. The shaded area shows the time period when 75% of confirmed cases were identified. Reprinted from The Lancet, Vol 397, He et al., Seroprevalence and humoral immune durability of anti-SARS-CoV-2 antibodies in Wuhan, China: a longitudinal, population-level, cross-sectional study, p. 1075-1084. Copyright (2021), with permission from Elsevier.
PEER-REVIEWED
Change over time in public support for social distancing, mask wearing, and contact tracing to combat the COVID-19 pandemic among US adults, April to November 2020.external icon Barry et al. American Journal of Public Health (March 18, 2021).
Key findings:
- Support for social distancing decreased from 89% in April to 79% in July but remained steady at 78% in November 2020.
- In July and November, most respondents supported mask wearing (80% and 79%, respectively) and contact tracing (74% and 73%, respectively).
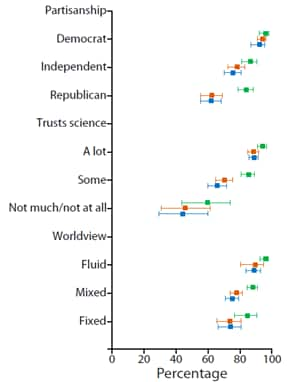
- Differences in support for social distancing (Figure) and other mitigation efforts were most pronounced by age, political affiliation, and trust in science.
Methods: Survey conducted among a nationally representative cohort of US adults in April (n = 1,468), July (n = 1,337), and November (n = 1,222) 2020 using a 5-point Likert scale to measure support for COVID-19 mitigation efforts by political partisanship, trust in science, and fixed (e.g., prioritizing social order and hierarchies) vs. fluid (e.g., valuing independence and self-reliance) worldview. Limitations: Loss to follow-up differed by demographics, education, income, and support of social distancing.
Implications: This study highlights challenges in reaching key groups to help mitigate the spread of COVID-19. Developing persuasive communication efforts for those distrusting science should be a priority.
Figure:
Note: Adapted from Barry et al. The figure shows support of social distancing (point estimates and 95% CI) in April, July, and November 2020. Used by permission of The Sheridan Press.
Detection, Burden, and Impact
- Wei et al. The impact of COVID-19 on pregnancy outcomes: a systematic review and meta-analysis.external icon Canadian Medical Association Journal (March 19, 2021). COVID-19 may be associated with increased risks of adverse pregnancy outcomes including preeclampsia and preterm birth.
- Rennert et al. Surveillance-based informative testing for detection and containment of SARS-CoV-2 outbreaks on a public university campus: an observational and modelling studyexternal icon. Lancet Child & Adolescent Health (March 19, 2021). A novel surveillance-based informative testing strategy, consisting of random testing to identify outbreaks in residence hall buildings or floors and targeting students for follow-up testing, is an effective and feasible strategy to mitigate disease spread in university settings.
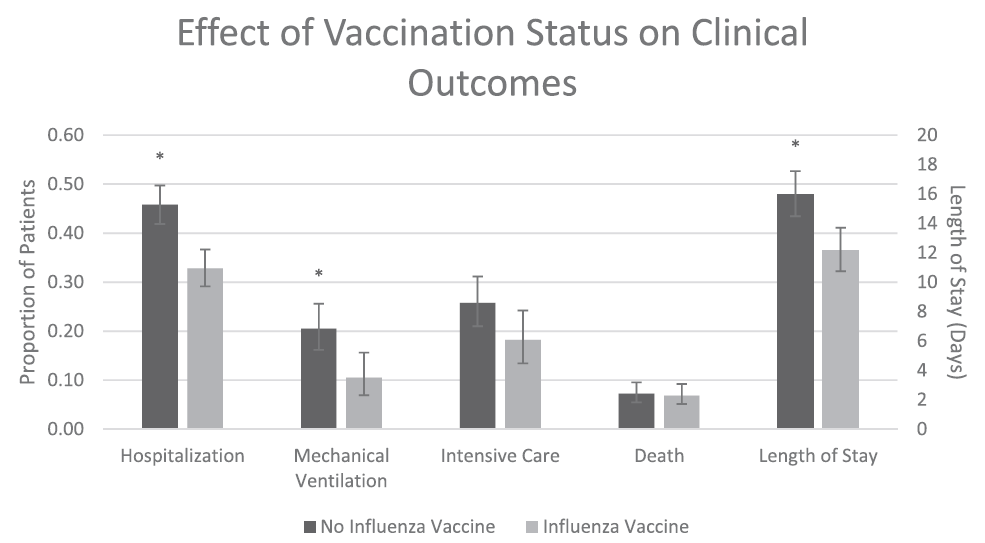
- Conlon et al. Impact of the influenza vaccine on COVID-19 infection rates and severityexternal icon. American Journal of Infection Control (February 22, 2021). Influenza vaccination, in this study within the Michigan Medicine healthcare system, was associated with reduced odds of testing positive for COVID-19 (aOR = 0.76, 95% CI 0.68-0.86) and improved clinical outcomes. (Figure).
Figure:
Note: Total cohort includes all patients who tested positive for COVID-19 in this medical system, stratified by those who received no influenza vaccine (n = 693) or received influenza vaccine (n = 525). Mechanical ventilation, intensive care, and length of stay assessed only for those who were hospitalized (n = 505). All clinical outcomes adjusted for baseline covariates. * signifies p <0.05. Licensed under CC-BY-NC-ND 4.0.
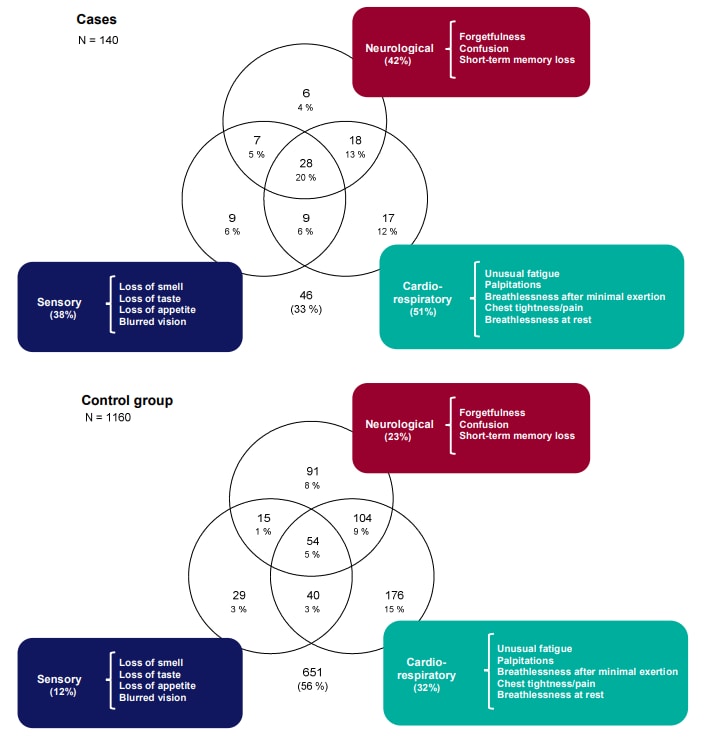
- Amin-Chowdhury et al. Characterising long COVID more than 6 months after acute infection in adults; prospective longitudinal cohort study, Englandexternal icon. medRxiv (Preprint, March 24, 2021). Public Health England’s longitudinal surveillance study of health care workers (n=1,671) found sensory, neurological, and cardiorespiratory symptom clusters (Figure) were associated with SARS-CoV-2 infection after a median of 7.5 months.
Figure:
Note: Adapted from Amin-Chowdhury et al. Venn diagrams representing the most common systems affected by symptoms associated with SARS-CoV-2 infection after a median of 7.5 months among cases with symptomatic mild-to-moderate confirmed COVID-19 compared to asymptomatic, seronegative controls. Licensed under CC-BY-NC-ND 4.0.
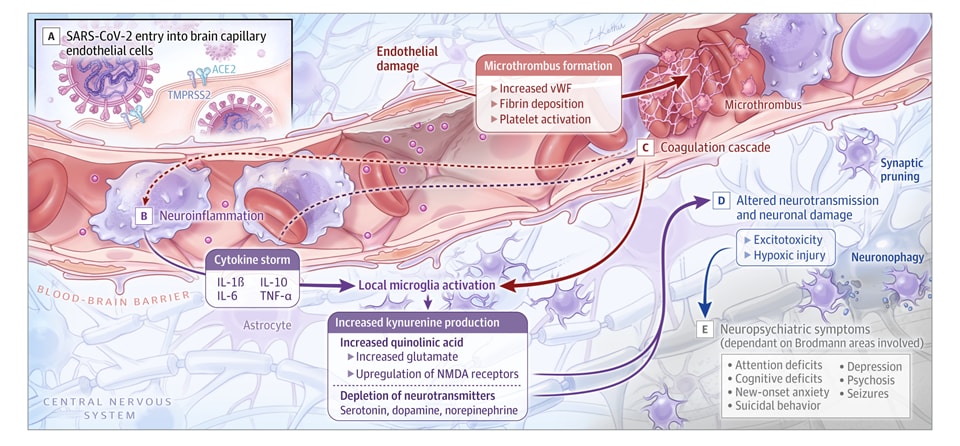
- Boldrini et al. How COVID-19 affects the brainexternal icon. JAMA Psychiatry (March 26, 2021). In addition to respiratory and gastrointestinal symptoms, COVID-19 can lead to short- and long-term neuropsychiatric symptoms (NPs), as well as long-term brain sequela; these symptoms are unrelated to respiratory insufficiency. Between 20%-70% of patients had post-COVID-19 NPs months after respiratory symptoms resolved.
Figure:
Note: Adapted from Boldrini et al. How SARS-CoV-2 can result in brain vascular injury, neurotransmitter system dysfunction, thrombotic events, neuronal damage, and neuropsychiatric symptoms. Reproduced with permission from JAMA Psychiatry. Published online March 26, 2021. https://doi.org/10.1001/jamapsychiatry.2021.0500external icon. Copyright© 2021 American Medical Association. All rights reserved.
Prevention, Mitigation, and Intervention Strategies
- Kunze et al. Mortality in individuals treated with COVID-19 convalescent plasma varies with the geographic provenance of donors. medRxivexternal icon (Preprint, March 22, 2021). Published in Nature Communicationsexternal icon (August 11, 2021). This modeling study showed a lower risk of death at 30 days post-transfusion for near-sourced plasma (transported ≤150 miles) vs. distantly sourced plasma (transported >150 miles).
- Samannan et al. Effect of face masks on gas exchange in healthy persons and patients with chronic obstructive pulmonary diseaseexternal icon. Annals of the American Thoracic Society (March 2021). Gas exchange (CO2 retention) after the 6-minute walk test was not significantly affected by wearing a surgical mask in veterans with chronic obstructive pulmonary disease (n = 15, median age 72 years, 100% male) or in house staff physicians without lung conditions (n = 15, median age 31 years, 60% male).
- Zhou et al. 1.526 SARS-CoV-2 variants identified in New York City are neutralized by vaccine-elicited and therapeutic monoclonal antibodies.external icon bioRxiv (Preprint, March 24, 2021). Published in mBioexternal icon (July 27, 2021). Convalescent sera and vaccine-elicited antibodies retained full neutralizing titers against the S477N B.1.526 variant spreading in the New York City area and neutralized B.1.526 with the E484K mutation with a modest 3.5-fold decrease in titer compared to D614G, suggesting that current vaccines will remain protective against B.1.526 variants.
- Schmitz et al. A public vaccine-induced human antibody protects against SARS-CoV-2 and emerging variants.external icon bioRxiv (Preprint, March 25, 2021). Published in Immunityexternal icon (September 14, 2021). Authors describe 2C08, a SARS-CoV-2 mRNA vaccine-induced germinal center B cell-derived human monoclonal antibody that can effectively neutralize variants including B.1.351.
Social, Behavioral, and Communication Science
- Meyer et al. Trends in health care worker intentions to receive a COVID-19 vaccine and reasons for hesitancyexternal icon. JAMA Network Open (March 23, 2021). Employees of a large health care system were much more likely to report intent to receive a COVID-19 vaccine after (80.2%, 1,034/1,289) vs. prior to (53.2%, 7,981/15,003) December 10, 2020, the date a FDA Advisory Committee recommended the first Emergency Use Authorization of a COVID-19 vaccine; >90% of employees who either did not intend to receive a vaccine, or were undecided, reported concerns about unknown vaccine risks.
Disclaimer: The purpose of the CDC COVID-19 Science Update is to share public health articles with public health agencies and departments for informational and educational purposes. Materials listed in this Science Update are selected to provide awareness of relevant public health literature. A material’s inclusion and the material itself provided here in full or in part, does not necessarily represent the views of the U.S. Department of Health and Human Services or the CDC, nor does it necessarily imply endorsement of methods or findings. While much of the COVID-19 literature is open access or otherwise freely available, it is the responsibility of the third-party user to determine whether any intellectual property rights govern the use of materials in this Science Update prior to use or distribution. Findings are based on research available at the time of this publication and may be subject to change.

