Volume 30, Number 5—May 2024
Dispatch
Molecular Epidemiology of Mayaro Virus among Febrile Patients, Roraima State, Brazil, 2018–2021
Julia Forato , Cássio A. Meira, Ingra M. Claro, Mariene R. Amorim, Gabriela F. de Souza, Stefanie P. Muraro, Daniel A. Toledo-Teixeira, Miguel F. Dias, Cátia A. R. Meneses, Rodrigo N. Angerami, Pritesh Lalwani, Scott C. Weaver, Ester C. Sabino, Nuno R. Faria, William M. de Souza1, Fabiana Granja1, and José Luiz Proenca-Modena1
Figure
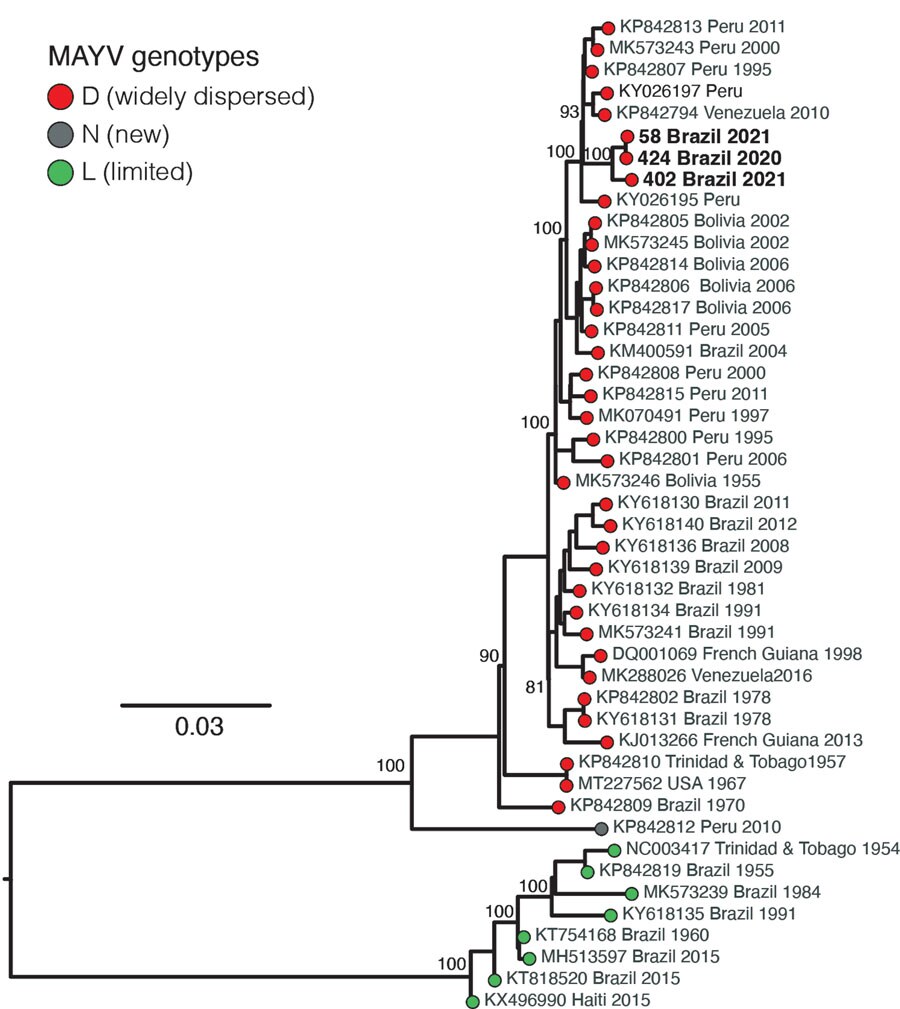
Figure. Maximum-likelihood phylogenetic tree of Mayaro virus, Roraima State, Brazil, 2018–2021. Phylogeny is midpoint rooted for clarity of presentation. Bold text indicates 3 new Mayaro virus genomes. Bootstrap values based on 1,000 replicates are shown on principal nodes. Scale bar indicates the evolutionary distance of substitutions per nucleotide site.
1These senior authors contributed equally to this article.
Page created: March 18, 2024
Page updated: April 24, 2024
Page reviewed: April 24, 2024
The conclusions, findings, and opinions expressed by authors contributing to this journal do not necessarily reflect the official position of the U.S. Department of Health and Human Services, the Public Health Service, the Centers for Disease Control and Prevention, or the authors' affiliated institutions. Use of trade names is for identification only and does not imply endorsement by any of the groups named above.