Volume 30, Number 4—April 2024
Research
Geographic Disparities in Domestic Pig Population Exposure to Ebola Viruses, Guinea, 2017–2019
Solène Grayo , Alimou Camara, Bakary Doukouré, Isabelle Ellis, Cécile Troupin, Kerstin Fischer, Jessica Vanhomwegen, Michael White, Martin H. Groschup, Sandra Diederich, and Noël Tordo
Figure 4
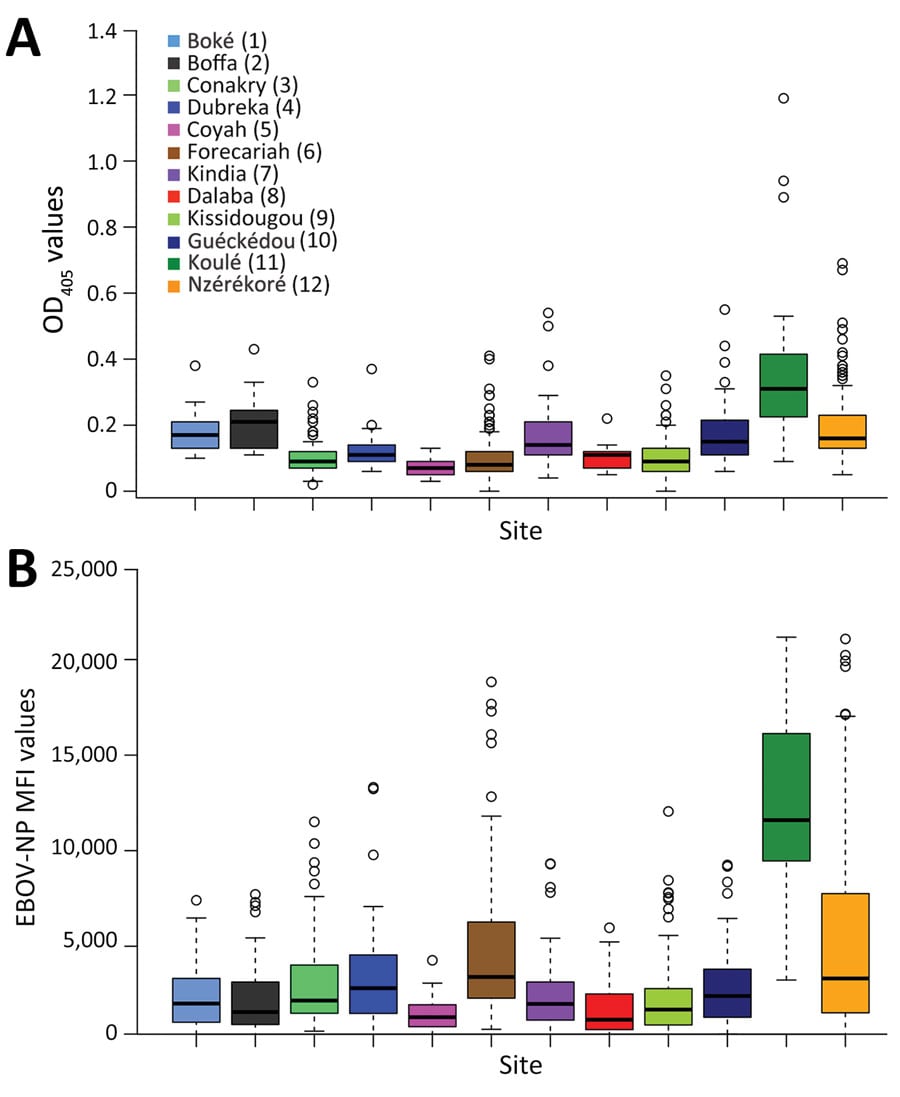
Figure 4. Comparison between results of indirect ELISA and multiplex microsphere immunoassay for EBOV-NP in study of geographic disparity in domestic pig population exposure to Ebola viruses, Guinea, 2017–2019. A) Boxplot of OD values at 405 nm (OD405) obtained by ELISA by site (n = 888 pig serum samples). B) Boxplot of MFI values obtained by multiplex microsphere immunoassay (n = 882 pig serum samples). Locations in key correspond to locations on map in Figure 3. EBOV, Zaire Ebola virus; MFI, mean fluorescence intensities; NP, nucleoprotein; OD, optical density.
Page created: February 08, 2024
Page updated: March 20, 2024
Page reviewed: March 20, 2024
The conclusions, findings, and opinions expressed by authors contributing to this journal do not necessarily reflect the official position of the U.S. Department of Health and Human Services, the Public Health Service, the Centers for Disease Control and Prevention, or the authors' affiliated institutions. Use of trade names is for identification only and does not imply endorsement by any of the groups named above.