Reported Tuberculosis in the United States, 2021
Table 23. Extrapulmonary Tuberculosis Cases and Percentages by Site of Disease: United States, 2010–2021
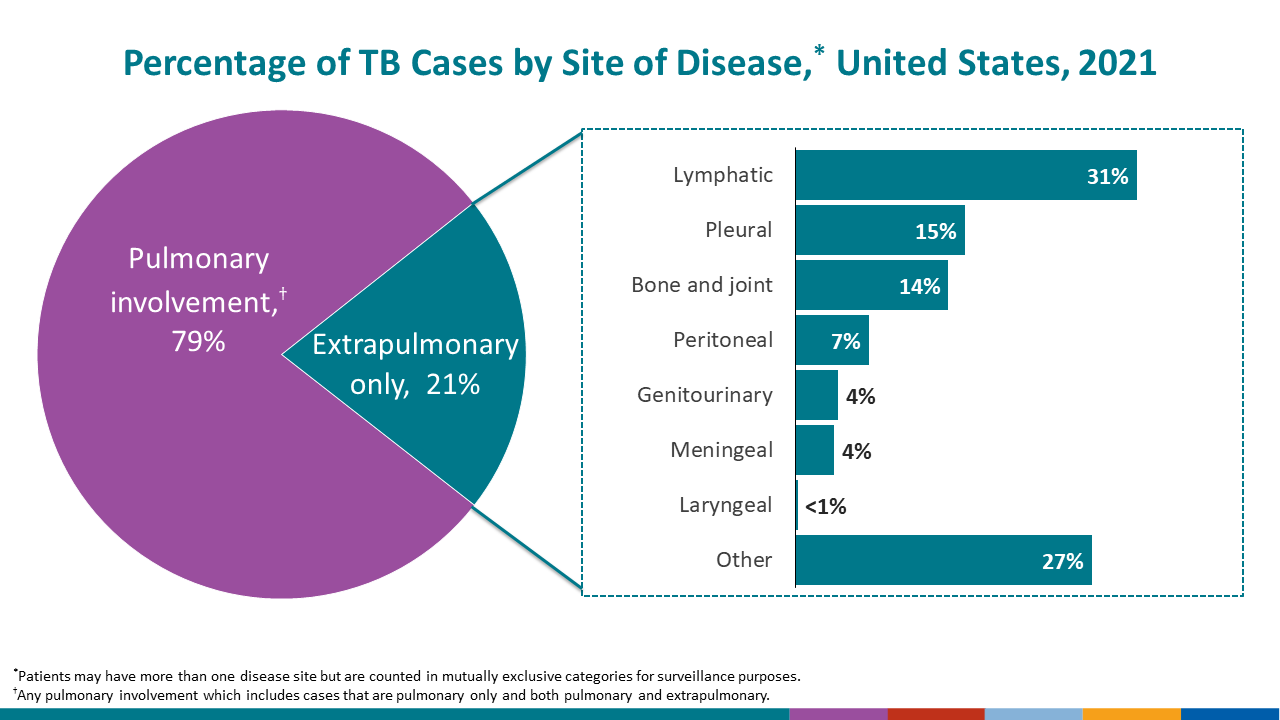
See surveillance slide #41.
| Year | Total cases1 | Total extrapulmonary sites2 | Site of disease | |||||||||||||||
|---|---|---|---|---|---|---|---|---|---|---|---|---|---|---|---|---|---|---|
| Pleural | Lymphatic3 | Bone or joint | Genitourinary | Meningeal | Peritoneal | Laryngeal | Other | |||||||||||
| No. | (%) | No. | (%) | No. | (%) | No. | (%) | No. | (%) | No. | (%) | No. | (%) | No. | (%) | |||
| 2021 | 1,667 | 1,780 | 270 | (15.2) | 545 | (30.6) | 243 | (13.7) | 68 | (3.8) | 62 | (3.5) | 117 | (6.6) | 3 | (0.2) | 472 | (26.5) |
| 2020 | 1,509 | 1,608 | 254 | (15.8) | 568 | (35.3) | 143 | (8.9) | 64 | (4.0) | 65 | (4.0) | 117 | (7.3) | 1 | (0.1) | 396 | (24.6) |
| 2019 | 1,813 | 1,932 | 354 | (18.3) | 674 | (34.9) | 166 | (8.6) | 75 | (3.9) | 85 | (4.4) | 116 | (6.0) | 2 | (0.1) | 460 | (23.8) |
| 2018 | 1,802 | 1,911 | 319 | (16.7) | 712 | (37.3) | 182 | (9.5) | 89 | (4.7) | 70 | (3.7) | 112 | (5.9) | 3 | (0.2) | 424 | (22.2) |
| 2017 | 1,882 | 2,011 | 318 | (15.8) | 761 | (37.8) | 181 | (9.0) | 85 | (4.2) | 88 | (4.4) | 119 | (5.9) | 0 | (0.0) | 459 | (22.8) |
| 2016 | 1,868 | 1,973 | 322 | (16.3) | 703 | (35.6) | 192 | (9.7) | 92 | (4.7) | 85 | (4.3) | 121 | (6.1) | 2 | (0.1) | 456 | (23.1) |
| 2015 | 1,904 | 2,008 | 343 | (17.1) | 720 | (35.9) | 194 | (9.7) | 89 | (4.4) | 92 | (4.6) | 126 | (6.3) | 3 | (0.1) | 441 | (22.0) |
| 2014 | 1,921 | 2,030 | 333 | (16.4) | 778 | (38.3) | 206 | (10.1) | 98 | (4.8) | 98 | (4.8) | 116 | (5.7) | 4 | (0.2) | 397 | (19.6) |
| 2013 | 1,967 | 2,077 | 355 | (17.1) | 745 | (35.9) | 221 | (10.6) | 104 | (5.0) | 109 | (5.2) | 121 | (5.8) | 4 | (0.2) | 418 | (20.1) |
| 2012 | 2,078 | 2,189 | 365 | (16.7) | 843 | (38.5) | 226 | (10.3) | 109 | (5.0) | 103 | (4.7) | 126 | (5.8) | 4 | (0.2) | 413 | (18.9) |
| 2011 | 2,161 | 2,281 | 391 | (17.1) | 862 | (37.8) | 249 | (10.9) | 114 | (5.0) | 132 | (5.8) | 122 | (5.3) | 3 | (0.1) | 408 | (17.9) |
| 2010 | 2,409 | 2,513 | 393 | (15.6) | 1,011 | (40.2) | 269 | (10.7) | 114 | (4.5) | 138 | (5.5) | 140 | (5.6) | 2 | (0.1) | 446 | (17.7) |
1Excludes persons with pulmonary site of disease and persons for whom the site of disease was not stated.
2Persons might have more than one extrapulmonary site of disease.
3Persons with multiple lymphatic sites of disease are counted once.
Note: Data for all years are updated through July 8, 2022.
See Technical Notes