Reported Tuberculosis in the United States, 2019
Table 57. Counts and Percentages of Tuberculosis Cases Estimated to be Attributed to Recent Transmission and Extensive Recent Transmission: United States and the District of Columbia, 2018-2019
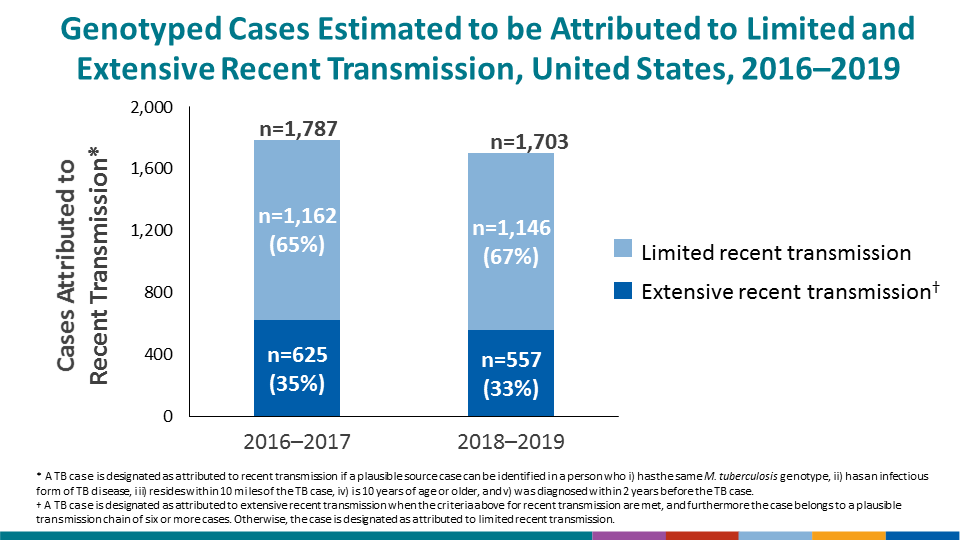
See Surveillance Slides #57 and #58
| Reporting Area | Total Genotyped Cases1 | Cases Not Attributed to Recent Transmission | Cases Attributed to Recent Transmission2 | Cases Attributed to Extensive Recent Transmission3 | |||
|---|---|---|---|---|---|---|---|
| No. | % | No. | % | No. | % | ||
| United States | 13,577 | 11,874 | (87.5) | 1,703 | (12.5) | 557 | (4.1) |
| Alabama | 147 | 108 | (73.5) | 39 | (26.5) | 21 | (14.3) |
| Alaska | 88 | 42 | (47.7) | 46 | (52.3) | 20 | (22.7) |
| Arizona | 277 | 261 | (94.2) | 16 | (5.8) | 0 | (0.0) |
| Arkansas | 104 | 80 | (76.9) | 24 | (23.1) | 3 | (2.9) |
| California | 3,285 | 2,867 | (87.3) | 418 | (12.7) | 168 | (5.1) |
| Colorado | 93 | 87 | (93.5) | 6 | (6.5) | 0 | (0.0) |
| Connecticut | 102 | 95 | (93.1) | 7 | (6.9) | 0 | (0.0) |
| Delaware | 29 | 25 | (86.2) | 4 | (13.8) | 0 | (0.0) |
| District of Columbia | 37 | 36 | (97.3) | 1 | (2.7) | 0 | (0.0) |
| Florida | 933 | 798 | (85.5) | 135 | (14.5) | 40 | (4.3) |
| Georgia | 409 | 350 | (85.6) | 59 | (14.4) | 15 | (3.7) |
| Hawaii | 170 | 144 | (84.7) | 26 | (15.3) | 9 | (5.3) |
| Idaho | 17 | 16 | (94.1) | 1 | (5.9) | 0 | (0.0) |
| Illinois | 411 | 372 | (90.5) | 39 | (9.5) | 12 | (2.9) |
| Indiana | 156 | 143 | (91.7) | 13 | (8.3) | 0 | (0.0) |
| Iowa | 69 | 67 | (97.1) | 2 | (2.9) | 0 | (0.0) |
| Kansas | 44 | 42 | (95.5) | 2 | (4.5) | 0 | (0.0) |
| Kentucky | 87 | 82 | (94.3) | 5 | (5.7) | 0 | (0.0) |
| Louisiana | 112 | 87 | (77.7) | 25 | (22.3) | 8 | (7.1) |
| Maine | 20 | 17 | (85.0) | 3 | (15.0) | 1 | (5.0) |
| Maryland | 323 | 303 | (93.8) | 20 | (6.2) | 9 | (2.8) |
| Massachusetts | 289 | 268 | (92.7) | 21 | (7.3) | 1 | (0.3) |
| Michigan | 152 | 139 | (91.4) | 13 | (8.6) | 1 | (0.7) |
| Minnesota | 260 | 232 | (89.2) | 28 | (10.8) | 13 | (5.0) |
| Mississippi | 99 | 81 | (81.8) | 18 | (18.2) | 6 | (6.1) |
| Missouri | 82 | 78 | (95.1) | 4 | (4.9) | 3 | (3.7) |
| Montana | 6 | 6 | (100.0) | 0 | (0.0) | 0 | (0.0) |
| Nebraska | 29 | 28 | (96.6) | 1 | (3.4) | 0 | (0.0) |
| Nevada | 98 | 88 | (89.8) | 10 | (10.2) | 0 | (0.0) |
| New Hampshire | 18 | 16 | (88.9) | 2 | (11.1) | 0 | (0.0) |
| New Jersey | 481 | 437 | (90.9) | 44 | (9.1) | 10 | (2.1) |
| New Mexico | 57 | 56 | (98.2) | 1 | (1.8) | 0 | (0.0) |
| New York4 | 291 | 283 | (97.3) | 8 | (2.7) | 2 | (0.7) |
| New York City | 815 | 690 | (84.7) | 125 | (15.3) | 49 | (6.0) |
| North Carolina | 321 | 268 | (83.5) | 53 | (16.5) | 25 | (7.8) |
| North Dakota | 23 | 20 | (87.0) | 3 | (13.0) | 0 | (0.0) |
| Ohio | 228 | 204 | (89.5) | 24 | (10.5) | 0 | (0.0) |
| Oklahoma | 107 | 90 | (84.1) | 17 | (15.9) | 3 | (2.8) |
| Oregon | 107 | 88 | (82.2) | 19 | (17.8) | 4 | (3.7) |
| Pennsylvania | 332 | 305 | (91.9) | 27 | (8.1) | 3 | (0.9) |
| Rhode Island | 20 | 20 | (100.0) | 0 | (0.0) | 0 | (0.0) |
| South Carolina | 137 | 118 | (86.1) | 19 | (13.9) | 3 | (2.2) |
| South Dakota | 24 | 21 | (87.5) | 3 | (12.5) | 0 | (0.0) |
| Tennessee | 178 | 153 | (86.0) | 25 | (14.0) | 5 | (2.8) |
| Texas | 1,726 | 1,443 | (83.6) | 283 | (16.4) | 119 | (6.9) |
| Utah | 33 | 32 | (97.0) | 1 | (3.0) | 0 | (0.0) |
| Vermont | 7 | 7 | (100.0) | 0 | (0.0) | 0 | (0.0) |
| Virginia | 313 | 296 | (94.6) | 17 | (5.4) | 0 | (0.0) |
| Washington | 332 | 293 | (88.3) | 39 | (11.7) | 4 | (1.2) |
| West Virginia | 8 | 8 | (100.0) | 0 | (0.0) | 0 | (0.0) |
| Wisconsin | 89 | 82 | (92.1) | 7 | (7.9) | 0 | (0.0) |
| Wyoming | 2 | 2 | (100.0) | 0 | (0.0) | 0 | (0.0) |
1 Total number of M. tuberculosis genotyped cases that are eligible to be evaluated for recent transmission (i.e., complete data for the plausible-source case method’s algorithm).
2 Number of cases attributed to recent transmission includes any given case with a plausible source case regardless of cluster size.
3 Number of cases attributed to extensive recent transmission includes only cases in a plausible chain of transmission of six or more cases (five secondary and one source case).
4 Excludes New York City.