Reported Tuberculosis in the United States, 2018
Table 15. Extrapulmonary Tuberculosis Cases and Percentages by Site of Disease: United States, 2010–2018
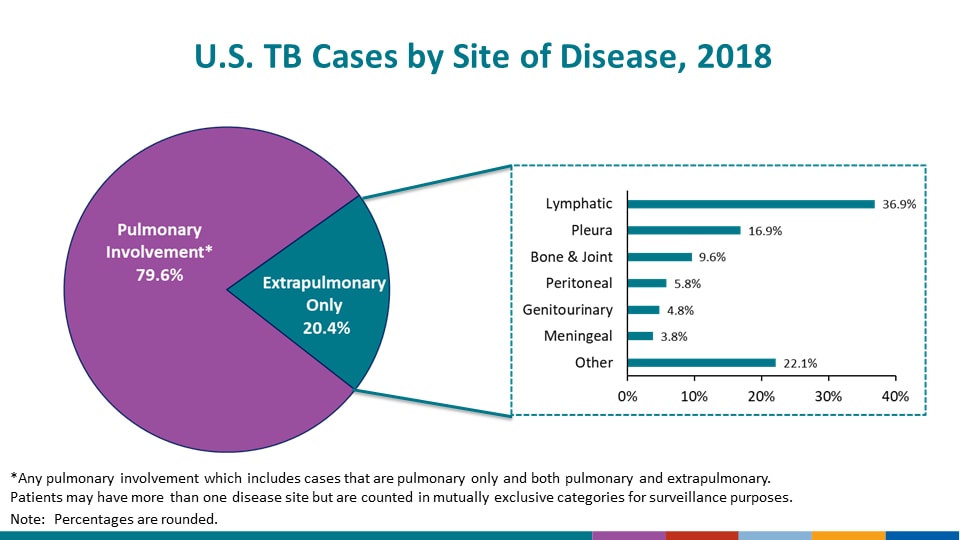
See Surveillance Slide #22.
| Year | Total Extrapulmonary Cases1 | Total Extrapulmonary Sites2 | Site of Disease | |||||||||||||||
|---|---|---|---|---|---|---|---|---|---|---|---|---|---|---|---|---|---|---|
| Pleural | Lymphatic | Bone or Joint | Genitourinary | Meningeal | Peritoneal | Laryngeal | Other | |||||||||||
| No. | (%) | No. | (%) | No. | (%) | No. | (%) | No. | (%) | No. | (%) | No. | (%) | No. | (%) | |||
| 2010 | 2,412 | 2,516 | 393 | (15.6) | 1,012 | (40.2) | 270 | (10.7) | 115 | (4.6) | 138 | (5.5) | 140 | (5.6) | 2 | (0.1) | 446 | (17.7) |
| 2011 | 2,170 | 2,291 | 391 | (17.1) | 864 | (37.7) | 251 | (11.0) | 117 | (5.1) | 132 | (5.8) | 122 | (5.3) | 3 | (0.1) | 411 | (17.9) |
| 2012 | 2,077 | 2,186 | 365 | (16.7) | 843 | (38.6) | 226 | (10.3) | 110 | (5.0) | 103 | (4.7) | 126 | (5.8) | 4 | (0.2) | 409 | (18.7) |
| 2013 | 1,970 | 2,080 | 355 | (17.1) | 748 | (36.0) | 222 | (10.7) | 103 | (5.0) | 109 | (5.2) | 121 | (5.8) | 4 | (0.2) | 418 | (20.1) |
| 2014 | 1,925 | 2,032 | 333 | (16.4) | 778 | (38.3) | 210 | (10.3) | 97 | (4.8) | 98 | (4.8) | 117 | (5.8) | 4 | (0.2) | 395 | (19.4) |
| 2015 | 1,905 | 2,008 | 343 | (17.1) | 720 | (35.9) | 194 | (9.7) | 90 | (4.5) | 92 | (4.6) | 126 | (6.3) | 3 | (0.1) | 440 | (21.9) |
| 2016 | 1,869 | 1,973 | 323 | (16.4) | 702 | (35.6) | 193 | (9.8) | 92 | (4.7) | 85 | (4.3) | 121 | (6.1) | 2 | (0.1) | 455 | (23.1) |
| 2017 | 1,887 | 2,015 | 320 | (15.9) | 764 | (37.9) | 181 | (9.0) | 84 | (4.2) | 87 | (4.3) | 119 | (5.9) | 0 | (0.0) | 460 | (22.8) |
| 2018 | 1,828 | 1,936 | 327 | (16.9) | 715 | (36.9) | 185 | (9.6) | 92 | (4.8) | 74 | (3.8) | 113 | (5.8) | 3 | (0.2) | 427 | (22.1) |
1Excludes cases with pulmonary site of disease and cases with site not stated.
2Patient might have more than one extrapulmonary site of disease.
Note: Data for all years are updated through June 6, 2019.
See Technical Notes.