Volume 10 — November 27, 2013
ORIGINAL RESEARCH
The Effect of Philadelphia and Pennsylvania Clean Indoor Air Act on Food Services and Drinking Places Sales and Numbers, 1998-2011
Navigate This Article
Zhen-qiang Ma, MD, MPH, MS; Monica A. Fisher, PhD, DDS, MS, MPH
Suggested citation for this article: Ma Z, Fisher MA. The Effect of Philadelphia and Pennsylvania Clean Indoor Air Act on Food Services and Drinking Places Sales and Numbers, 1998-2011. Prev Chronic Dis 2013;10:130143. DOI: http://dx.doi.org/10.5888/pcd10.130143.
PEER REVIEWED
Abstract
Introduction
Philadelphia enacted its Clean Indoor Air Act (CIAA) nearly 2 years before the statewide CIAA. In this study, we assessed the economic impact of CIAAs on 4 types of food services and drinking places and addressed the predominant limitation of previous pre–post ban studies, namely the lack of control for confounders and changes in secular trends over time.
Methods
We analyzed data from Pennsylvania Department of Revenue Quarterly 1998–2011 taxable county-level revenue sales and number of food services and drinking places. Region-specific and type-specific adjusted sales and number of food services and drinking places accounted for consumer spending as a general economic indicator. Segmented regression analysis of interrupted time-series methodology assessed changes in trend and level.
Results
Pennsylvania CIAA had no significant effect on adjusted sales or numbers except for an increase in sales in Philadelphia for limited-service eating places and in the surrounding 4 counties for special food services. Philadelphia CIAA was associated with an increase in adjusted numbers of full-service restaurants in Philadelphia and the rest of the state, special food services in Philadelphia, and drinking places in the rest of the state, and a decrease in the number of special food services in the surrounding counties. Philadelphia CIAA had no significant effect on adjusted sales except for an increase in special food services in the rest of the state.
Conclusion
Overall, CIAAs had no negative business-related impact and, for the most part, suggest a positive impact on restaurant sales and numbers. Our results provide further support for comprehensive CIAA ordinance for restaurants.
Introduction
Pennsylvania has joined an ever growing number of places around the world that protect workers and the public from the health consequences of indoor secondhand smoke. The Pennsylvania Clear Indoor Air Act (CIAA) became effective in September 2008, 90 days after being signed into law in June 2008 (1). The Pennsylvania CIAA prohibits smoking in enclosed public places, including restaurants and drinking establishments that do not have legally approved exemptions. On January 8, 2007, before the enactment of Pennsylvania’s CIAA, Philadelphia County banned smoking in all indoor public places and workplaces, including restaurants and drinking establishments with similar exemptions (2). There are 2 types of drinking establishments (with or without a separate eating area) that can apply for exemptions from the CIAA if food accounts for 20% or less of overall sales and no one under the age of 18 is permitted to enter (1,2). The Philadelphia CIAA is the only local smoking ban in Pennsylvania; other local governments are preempted from regulating smoking more stringently than the state’s CIAA.
Even though numerous peer‐reviewed studies on the impact of smoke‐free policies on restaurant and drinking establishment revenues have found these policies to have no negative effect on sales (3–7), opponents of comprehensive CIAAs that do not permit exemptions continue to create concern regarding potential loss of revenue for these businesses due to a smoking ban. Opponents of the ban also disregard or question the evidence reported in many studies that smoke‐free policies may actually have a small but significant positive impact on sales (3,4,7–9). Reviews of studies assessing sales tax or business revenues, employment, and number of licensed establishments concluded that smoke‐free air legislation does not have an adverse economic impact on the hospitality industry (including restaurants, drinking establishments/bars) (7,8,10). In addition, a 2010 Cochrane qualitative narrative review (11) reported that smoking bans had no significant economic impact when measured as bar and restaurant attendance (12–15). Our study was designed to address the predominant limitation of pre–post ban studies identified in the Cochrane review, namely the lack of control for confounders and changes in secular trends over time (11).
The objective of this study was to assess the economic impact of CIAAs on food services and drinking places in Pennsylvania using a naturally occurring study designed to compare trends and level changes in the adjusted quarterly revenue sales and number of establishments. Because Philadelphia County enacted its CIAA almost 2 years before the rest of the state, we will compare food services and drinking places revenue sales in Philadelphia County versus the rest of the state, and in Philadelphia County versus the 4 large suburban Pennsylvania counties surrounding Philadelphia (Bucks, Chester, Delaware, and Montgomery). This approach addresses the proximity effect of the Philadelphia and Pennsylvania CIAAs and the predominant limitation of previous pre–post ban studies.
Methods
Quarterly adjusted revenue sales and adjusted number of food services and drinking places were developed to take into account the general economic indicator of consumer spending. Food services and drinking places were defined as 4 distinct categories based on North American Industry Classification System (NAICS) codes: Full-Service Restaurants (NAICS code 7221), Limited-Service Eating Places (NAICS code 7222), Special Food Services (NAICS code 7223), and Drinking Places (alcoholic beverages) (NAICS code 7224). The overall quarterly taxable revenue sales and overall number of general merchandise stores (GMSs) (NAICS code 452) were used as a general economic indicator of consumer spending, similar to previous definitions using total retail sales (16).
Adjusted revenue sales were defined as the ratio of the sales for each type of establishment divided by the GMS sales:
- Adjusted Full-Service Restaurants Sales = Full-Service Restaurants Sales/GMS Sales
- Adjusted Limited-Service Eating Places Sales = Limited-Service Eating Places Sales/GMS Sales
- Adjusted Special Food Services Sales = Special Food Services Sales/GMS
- Adjusted Drinking Places (alcoholic beverages) Sales = Drinking Places Sales/GMS Sales
Adjusted Number of Food Services and Drinking Places were defined as the ratio of the number of type of establishment divided by the number of GMSs:
- Adjusted Number of Full-Service Restaurants = Number of Full-Service Restaurants/Number of GMS
- Adjusted Number of Limited-Service Eating Places = Number of Limited-Service Eating Places/Number of GMS
- Adjusted Number of Special Food Services Places = Number of Special Food Services Places/Number of GMS
- Adjusted Number of Drinking Places = Number of Drinking Places/Number of GMS
Regions in the state were categorized into 3 nonoverlapping regions: Philadelphia County, the 4 Pennsylvania counties surrounding Philadelphia (Bucks, Chester, Delaware, and Montgomery), and the rest of the state (61 counties, excluding 1 county because of an aberration of 99.9% loss in GMS). The time variable was defined as quarter (first through fourth) and year (1998–2011).
Analytic approach
Segmented regression analyses of interrupted time-series methods (17) were used to assess the impact of both the Philadelphia and Pennsylvania CIAA on food services and drinking places. The analytic approach compared regions and changes in levels and trends of food services and drinking places’ adjusted revenue sales and adjusted numbers, following the 2 time points of the Philadelphia CIAA and Pennsylvania CIAA. These adjusted outcomes take into account the general economic indicator of consumer spending. This method controls for baseline level and trend when estimating expected changes due to the Philadelphia CIAA and the Pennsylvania CIAA. The following is the time-series regression equation for this analysis:
ŷt = β0 + (β1 × Time) + (β2i × CIAAi) + (β3i × Time_post_CIAAi) + Qrt + et
ŷt is the dependent outcome variable, with a separate model for each of the 8 dependent variables (adjusted full-service restaurant sales, adjusted limited-service eating places sales, adjusted special food services sales, adjusted drinking places sales, adjusted number of full-service restaurants, adjusted number of limited-service eating places, adjusted number of special food services, adjusted number of drinking places) for each of the 3 regions (Philadelphia, counties surrounding Philadelphia, and the rest of the state). Time is the number of quarters from the start of the observational period, starting from the first quarter of 1998 as 1, and then increasing by 1 for every quarter thereafter. CIAA is a dummy variable with a value of 0 for the segment before the CIAA and 1 for the segment at the beginning and post CIAA. Time_post_CIAA is the number of quarters at the beginning post CIAA with a value of 0 for the segment before the CIAA and 1 for the segment at the beginning of the CIAA that increases by 1 for every quarter thereafter. Subscript i equals 1 for the date of enactment of the Philadelphia CIAA and equals 2 for the date of enactment of the Pennsylvania CIAA. Qrt is the quarter of the year for the sales and number of establishments and quarter 4 was the reference; et is the random variation at time t not explained by the model.
The intercept β0 coefficient estimates the baseline level of the adjusted sales/adjusted number of establishments at the beginning of the observation period. β1 estimates the trend for the adjusted sales/adjusted number of establishments before the enactment time of the CIAA. β2 estimates the change in adjusted sales/adjusted number of establishments level after the enactment of the CIAA measured as the change from the last time point before enactment of the CIAA to the first time point after the enactment of the CIAA. β2 can be considered to be an immediate change in the level of the adjusted sales/adjusted number of establishments due to the enactment of the CIAA. β3 estimates the change in the trend for the adjusted sales/adjusted number of establishments after enactment of the CIAA compared with the trend for the adjusted sales/adjusted number of establishments before the CIAA.
SAS Proc Autoreg (SAS Institute, Inc, Cary, North Carolina) was used for the analyses. The Durbin-Watson statistic was calculated to test for the serial autocorrelation of the error terms in the regression models. The Yule-Walker method with backstep option was used to correct autocorrelation (18). Initial auto-regressive parameters were set to 5 to account for quarterly changes. A quadratic term in time was incorporated in some models to reduce the autocorrelations in the model. Both positive and negative autocorrelations were nonsignificant in all final models. All final models had a Durbin-Watson statistic value close to the preferred value of 2. The statistical package SAS version 9.2 (SAS Institute, Inc, Cary, North Carolina) was used for all analyses. A P value of <.05 was considered significant.
Results
Full-service restaurants
Neither the Philadelphia CIAA nor the Pennsylvania CIAA had a significant impact on the trend or level of the largest component of the food services and drinking places market, namely, adjusted sales for full-service restaurant in any of the 3 regions (Philadelphia, surrounding counties, and the rest of the state) (Table 1, Figure 1). The trend for the adjusted number of full-service restaurants increased in Philadelphia (β31 = 0.079, P = .02) and the rest of the state (β31 = 0.191, P = .02) associated with Philadelphia’s CIAA. However, the Pennsylvania CIAA was not associated with any significant change in the trend or level of adjusted number of full-service restaurants (Table 2, Figure 2).
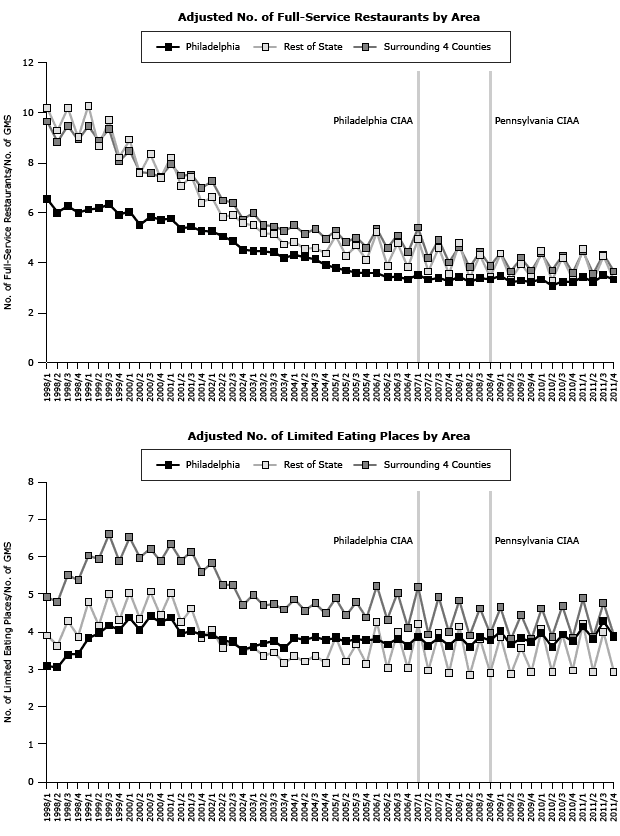
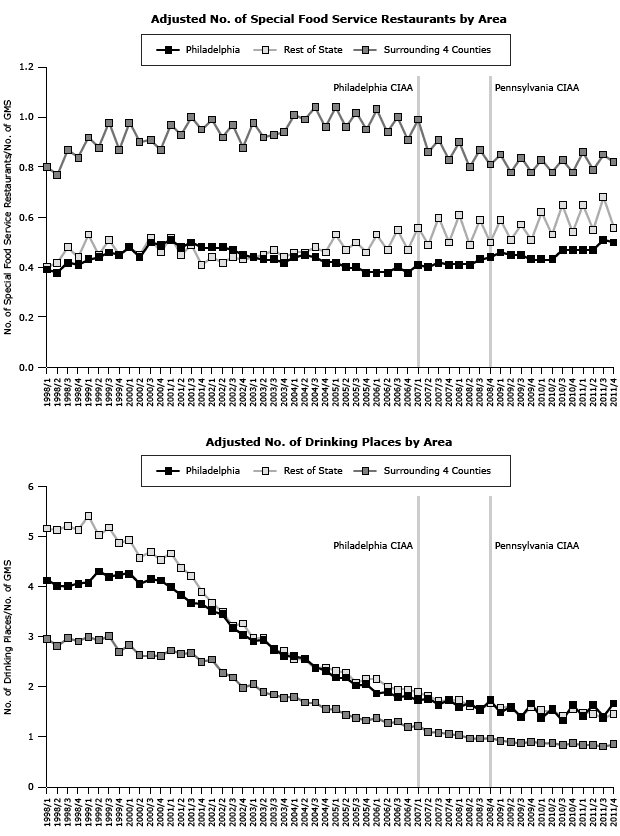
Figure 1. Effect of Philadelphia and Pennsylvania Clean Indoor Air Act (CIAA) on adjusted sales for each region and type of food service or drinking place, 1998–2011. Philadelphia County enacted a CIAA in January 2007, and the Pennsylvania CIAA became effective in September 2008; both dates are indicated by vertical lines. [A tabular version of this figure is also available.]
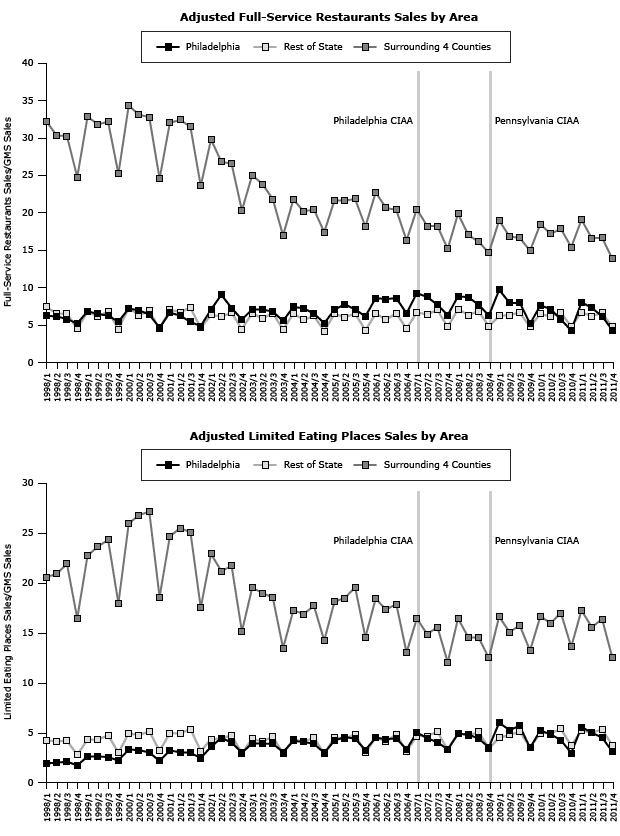
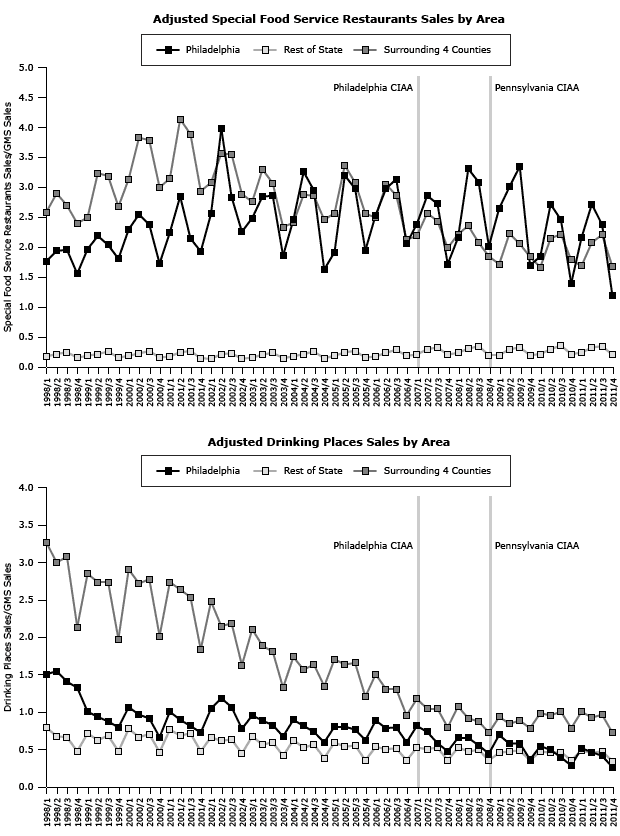
Figure 2. Effect of Philadelphia and Pennsylvania CIAA on adjusted number of types of food service or drinking place for each region, 1998–2011. Philadelphia County enacted a CIAA in January 2007, and the Pennsylvania CIAA became effective in September 2008; both dates are indicated by vertical lines. [A tabular version of this figure is also available.]
Limited-service eating places
The only significant effect of the CIAAs was the association of the Pennsylvania CIAA with a positive immediate increase in Philadelphia’s adjusted sales for limited-service eating places (β22 = 0.805, P = .03) but not the trend (β32) (Table 1, Figure 1).
Special food service restaurants
Neither the Philadelphia CIAA nor the Pennsylvania CIAA had a significant impact on the trend or level of the adjusted revenue sales for special food services in Philadelphia or the 4 surrounding counties. The Philadelphia CIAA was associated with an increase in the trend (β31 = 0.006, P = .04) for the adjusted special food services sales in the rest of the state but had no immediate impact (β21). The Pennsylvania CIAA was associated with an immediate decrease in adjusted special food services sales (β22 = −0.030, P = .02) in the rest of the state (Table 1, Figure 1), along with an increasing trend for the number of special food services restaurants in the 4 surrounding counties (β32 = 0.030, P < .001)( Table 2, Figure 2). The Philadelphia CIAA was associated with a decreasing trend for the adjusted number of special food services in the 4 surrounding counties (β31 = −0.018, P = .008) that was coupled with an increasing trend in Philadelphia (β31 = 0.017, P = .002).
Drinking places that serve alcoholic beverages
Neither the Philadelphia nor the Pennsylvania CIAA had a significant impact on the trend or level of the adjusted revenue sales for drinking places in any of the 3 regions (Table 1, Figure 1). The Philadelphia CIAA was associated with an increasing trend in the adjusted number of drinking places in the surrounding counties (β31 = 0.059, P = .02) and the rest of the state (β31 = 0.094, P = .009) but had no immediate impact (β21). The Pennsylvania CIAA was not associated with either the trend or the level of the adjusted number of drinking places in any of the 3 regions (Table 2) (Figure 2).
We noticed seasonal (quarterly) differences in the adjusted sales and adjusted number of food services and drinking places in all 3 regions (Table 1, Table 2, Figure 1, Figure 2). These seasonal differences were found in all 4 types of food services and drinking places: full-service restaurants, limited service eating places, special food services, and drinking places.
Discussion
Our analysis of the economic impact of indoor smoking bans on Pennsylvania’s eating and drinking establishments did not suggest that businesses in general were harmed. There were 2 instances of immediate impact on food services adjusted taxable revenues, but they were not consistent in their general direction (positive or negative). For the most part, the effect on adjusted taxable sales was small, and the effect on the number of establishments was favorable in comparison to the period before the smoking ban.
Our study was designed to address the predominant limitation of pre-ban and post-ban studies (3,8,12–16), namely the lack of control for confounders and changes in secular trends over time (9,11). Our analytic approach has several unique features compared with other interrupted time-series analyses of economic outcomes in the hospitality industry (19–23). For one, the phased implementation of CIAA statutes in Pennsylvania provided a naturally occurring quasi-experimental study design. The Philadelphia CIAA was implemented approximately 2 years earlier than the Pennsylvania CIAA, and only Philadelphia restaurants and drinking establishments were initially affected. This timing provided an opportunity to evaluate the consistency of the effect of the CIAAs on the food services and drinking places for both CIAAs using the other as a control. Second, in addition to assessing the tax-revenue sales, we also investigated the immediate impact and long-term trend on the number of food services and drinking places. Third, by investigating 4 distinct categories of food service establishments separately, we were able to examine the consistency of findings for different types of food services and drinking places. Few economic studies evaluated food services and drinking places separately. Hence, this assessment adds to the scientific evidence on whether eating and drinking establishments are differentially affected. Fourth, to address the neighborhood effect of the CIAAs on the trend and level of food services and drinking places sales and numbers, analyses were performed for 3 separate regions: Philadelphia, the 4 surrounding counties, and the remainder of the state.
Segmented regression analysis of interrupted time-series was used to account for the trend and autocorrelation. As reported by Glantz and Smith, serial autocorrelation usually exists in time-series data (16). Autocorrelation was also observed in most of our analyses, thus raising concerns that the assumptions of ordinary regression analysis were not met. One key assumption for ordinary regression analysis is that the errors are independent (24). However, with time-series data, the ordinary regression analysis residuals are usually correlated over time; thus, it is appropriate to consider an alternative analytic approach for time-series data. Violation of the independent-errors assumption for ordinary regression analysis could result in erroneous statistical significance of the parameters, and the confidence limits for the predicted value and the estimate of the regression coefficients are not as efficient as they would be if the autocorrelation were taken into account. Our quasi-experimental design, which controls for baseline level and trend when estimating the changes due to CIAAs, addresses the weakness of the simpler pre- and post-proportion comparison methods of ordinary regression that do not consider pre-intervention trends. An evaluation of the rate level and trend before and after the CIAAs is a stronger analytic approach so that an existing trend is not incorrectly interpreted to be related to an intervention, as can occur when performing the ordinary regression analysis.
In addition to the individual models, a combined model with interaction terms was also performed to determine whether the Philadelphia and Pennsylvania CIAA had different effects in the 3 regions. The assumption of this approach was that the trends for the adjusted food services and drinking places sales and numbers among the 3 regions in the state were parallel before the CIAAs. No statistically significant interaction terms were found, indicating that the CIAAs did not have a different effect on the 3 comparison regions.
Our major finding, namely, that indoor smoking bans did not significantly affect quarterly revenue in eating and drinking establishments, is similar to findings in other geographic locations in the United States (3,6,12,25–27) and worldwide (5,7,14,15). Contrary to the lack of relation between Ohio’s ban and economic activity in Kentucky’s border counties (26), the data in Pennsylvania suggest a possible migration of businesses across counties as depicted by the reduction in the number of special food services in the 4 surrounding counties that was coupled with the increase in Philadelphia following the Philadelphia CIAA.
A limitation of our study is that it was not possible to determine which drinking establishments in our analyses were exempt from the CIAA. Thus, the lack of impact of CIAAs may be due to the number of drinking establishments that applied for and received an exemption. The most current 2011 data indicates approximately two-thirds of the drinking places have exemptions (28). Further assessment of exempt versus nonexempt may provide more information. Also, even though we incorporated GMSs as an economic indicator in our analyses of adjusted sales and numbers, there may be some other confounding factors or events, especially those that could affect food services and drinking places differently than the GMSs. These could potentially change the effect of CIAAs on food services and drinking places adjusted sales and numbers.
Our study design addressed the predominant limitation of previous pre-ban and post-ban studies and concerns of opponents of more comprehensive smoking bans about potential loss of revenue. The results of this segmented regression analysis of interrupted time-series approach are consistent with the previous studies and suggest the need to further investigate the impact of CIAAs on drinking places. Overall, the indoor smoking bans had no negative business-related consequences, and for the most part, the data suggested a positive impact. This finding should allay concerns about the economic consequences of smoking restrictions on the hospitality industry and support comprehensive CIAA ordinances to protect the health and well-being of those who patronize and work in these locations, especially in food-service establishments.
Acknowledgments
We acknowledge the support, review, and insightful comments provided by Dr Stephen M. Ostroff, MD, Director of the Bureau of Epidemiology at the Pennsylvania Department of Health at the time this study was initiated. This study was supported by the CDC Coordinated Chronic Disease Prevention grant CDC-RFA-DP09-9010301PPHF11 and National Association of Chronic Disease Directors Epidemiology Capacity Building grant NACDD-0612012.
Author Information
Corresponding Author: Zhen-qiang Ma, MD, MPH, MS, Pennsylvania Department of Health, Bureau of Epidemiology, 625 Forster St, Room 1000, Harrisburg, PA 17120. Telephone: 717-547-3224. E-mail: zma@pa.gov.
Author Affiliations: Monica A. Fisher, Pennsylvania Department of Health, Harrisburg, Pennsylvania.
References
- Pennsylvania’s Clean Indoor Air Act. http://www.legis.state.pa.us/cfdocs/billinfo/billinfo.cfm?sind = 0&syear = 2007&body = S&type = B&bn = 246. Accessed June 20, 2013.
- Philadelphia’s Clear Indoor Air Act. http://www.phila.gov/health/Commissioner/secondhandsmoke.html. Accessed June 20, 2013.
- Eriksen M, Chaloupka F. The economic impact of clean indoor air laws. CA Cancer J Clin 2007;57(6):367–78. CrossRef PubMed
- Glantz SA. Smoke-free restaurant ordinances do not affect restaurant business. Period. J Public Health Manag Pract 1999;5(1):vi–ix. CrossRef PubMed
- Hahn EJ. Smoke free legislation: a review of health and economic outcomes research. Am J Prev Med 2010;39(6, Suppl 1):S66–76. CrossRef PubMed
- Collins NM, Shi Q, Forster JL, Erickson DJ, Toomey TL. Effects of clean indoor air laws on bar and restaurant revenue in Minnesota cities. Am J Prev Med 2010;39(6, Suppl 1):S10–5. CrossRef PubMed
- Scollo M, Lal A, Hyland A, Glantz S. Review of the quality of studies on the economic effects of smoke-free policies on the hospitality industry. Tob Control 2003;12(1):13–20. CrossRef PubMed
- Scollo M, Lal A. Summary of studies assessing the economic impact of smoke-free policies in the hospitality industry. Melbourne, Australia, VicHealth Centre for Tobacco Control 2008. http://www.vctc.org.au/downloads/Hospitalitysummary.pdf. Accessed June 20, 2013.
- Centers for Disease Control and Prevention. Impact of a smoking ban on restaurant and bar revenues — El Paso, Texas, 2002. MMWR Morb Mortal Wkly Rep 2004;53(7):150–2. http://www.cdc.gov/mmwr/preview/mmwrhtml/mm5307a2.htm. Accessed June 20, 2013. PubMed
- International Agency for Research on Cancer. IARC handbooks of cancer prevention, tobacco control, vol 13: Evaluating the effectiveness of smoke-free policies. Lyon (FR): World Health Organization; 2009.
- Callinan JE, Clarke A, Doherty K, Kelleher C. Legislative smoking bans for reducing secondhand smoke exposure, smoking prevalence and tobacco consumption. Cochrane Database Syst Rev 2010;(4):CD005992. PubMed
- Biener L, Garrett CA, Skeer M, Siegel M, Connolly G. The effects on smokers of Boston’s smoke-free bar ordinance: a longitudinal analysis of changes in compliance, patronage, policy support, and smoking at home. J Public Health Manag Pract 2007;13(6):630–6. CrossRef PubMed
- Gallus S, Zuccaro P, Colombo P, Apolone G, Pacifici R, Garattini S, et al. Smoking in Italy 2005–2006: effects of a comprehensive national tobacco regulation. Prev Med 2007;45(2-3):198–201. CrossRef PubMed
- Hyland A, Hassan LM, Higbee C, Boudreau C, Fong GT, Borland R, et al. The impact of smokefree legislation in Scotland: results from the Scottish ITC Scotland/UK longitudinal surveys. Eur J Public Health 2009;19(2):198–205. CrossRef PubMed
- Waa A, McGough S. Reducing exposure to second hand smoke: changes associated with the implementation of the amended New Zealand Smoke-free Environments Act 1990: 2003–2006. http://archive.hsc.org.nz/sites/default/files/publications/SFEWorkplace_Final.pdf. Accessed June 20, 2013. Wellington (AU): HSC Research and Evaluation Unit, 2006.
- Glantz SA, Smith LR. The effect of ordinances requiring smoke-free restaurants and bars on revenues: a follow-up. The effect of ordinances requiring smoke-free restaurants and bars on revenues: a follow-up. Am J Public Health 1997;87(10):1687–93.
- Wagner AK, Soumerai SB, Zhang F, Ross-Degnan D. Segmented regression analysis of interrupted time series studies in medication use research. J Clin Pharm Ther 2002;27(4):299–309. CrossRef PubMed
- The AUTOREG procedure. In: SAS/ETS 9.2 user’s guide. Cary (NC): SAS Institute Inc; 2008. p. 313-427. http://support.sas.com/documentation/cdl/en/etsug/60372/PDF/default/etsug.pdf. Accessed June 20, 2013.
- Wakefield M, Siahpush M, Scollo M, Lal A, Hyland A, McCaul K, et al. The effect of a smoke‐free law on restaurant business in South Australia. Aust N Z J Public Health 2002;26(4):375–82. CrossRef PubMed
- Luk R, Ferrence R, Gmel G. The economic impact of a smoke-free bylaw on restaurant and bar sales in Ottawa, Canada. Addiction 2006;101(5):738–45. CrossRef PubMed
- Stolzenberg L, D’Alessio SJ. Is nonsmoking dangerous to the health of restaurants? The effect of California’s indoor smoking ban on restaurant revenues. Eval Rev 2007;31(1):75–92. CrossRef PubMed
- Klein EG, Forster JL, Erickson DJ, Lytle LA, Schillo B. Economic effects of clean indoor air policies on bar and restaurant employment in Minneapolis and St Paul, Minnesota. J Public Health Manag Pract 2010;16(4):285–93. CrossRef PubMed
- Klein EG, Forster JL, Collins NM, Erickson DJ, Toomey TL. Employment change for bars and restaurants following a statewide clean indoor air policy. Am J Prev Med 2010;39(6, Suppl 1):S16–22. CrossRef PubMed
- Bowerman BL, O’Connell RT, Koehler A. Forecasting, time series, and regression. 4th edition. Belmont (CA): Duxbury; 2005. p. 97.
- Kayani N, Cowan SR, Homan SG, Wilson J, Warren VF, Yun S. Economic effect of smoke-free ordinances on 11 Missouri cities. [Erratum appears in Prev Chronic Dis 2012;9:E106. http://www.cdc.gov/pcd/issues/2012/11_0277e.htm.] Prev Chronic Dis 2012;9:110277. Accessed June 20, 2013.
- Pyles MK, Hahn EJ. Economic effects of Ohio’s smoke-free law on Kentucky and Ohio border counties. Tob Control 2011;20(1):73–6. CrossRef PubMed
- Young WF, Szychowski J, Karp S, Lui L, Diedrich RT. Economic impacts of the Pueblo Smoke-Free Air Act. Am J Prev Med 2010;38(3):340–3. CrossRef PubMed
- Pennsylvania Department of Health. Pennsylvania Clean Indoor Air Act. 2011 Annual report to the legislature. http://www.portal.state.pa.us/portal/server.pt/gateway/PTARGS_0_2_140235_14187_981294_43/http%3B/pubcontent.state.pa.us/publishedcontent/publish/cop_hhs/health/content/internet/healthy_schools_businesses___ communities/businesses/clean_indoor_air/bhprr/clean_indoor_air_act_annual_reports/2011_ciaa_annual_report.pdf. Accessed June 20, 2013.
Tables
 Table 1. Effect of Philadelphia and Pennsylvania CIAA on Adjusted Sales by Region and Type of Food Service or Drinking Place, 1998–2011
| Type of Business | Philadelphia | Surrounding Counties | Rest of the State | |||
|---|---|---|---|---|---|---|
| β | P Value | β | P Value | β | P Value | |
| Full-service restaurant | Total R = 0.86 | Total R = 0.98 | Total R = 0.95 | |||
| Intercept (β0) | 4.275 | <.001 | 29.217 | <.001 | 4.890 | <.001 |
| Initial trend (β1) | 0.051 | <.001 | −0.395 | <.001 | −0.017 | .001 |
| Philadelphia’s effect on rate (β31) | −0.154 | .263 | 0.189 | .584 | 0.038 | .427 |
| Pennsylvania’s effect on rate (β32) | −0.084 | .572 | 0.094 | .841 | −0.015 | .772 |
| Philadelphia’s effect on level (β21) | 0.995 | .126 | −0.435 | .699 | 0.413 | .077 |
| Pennsylvania’s effect on level (β22) | 0.323 | .609 | 1.142 | 0.295 | −0.274 | .228 |
| Quarter1 | 2.243 | <.001 | 5.610 | <.001 | 2.130 | <.001 |
| Quarter2 | 2.089 | <.001 | 4.175 | <.001 | 1.589 | <.001 |
| Quarter3 | 1.397 | <.001 | 4.248 | <.001 | 2.115 | <.001 |
| Limited-service eating places | Total R = 0.91 | Total R = 0.95 | Total R = 0.96 | |||
| Intercept (β0) | 1.172 | <.001 | 19.894 | <.001 | 2.986 | <.001 |
| Initial trend (β1) | 0.067 | <.001 | −0.195 | <.001 | 0.003 | .685 |
| Philadelphia’s effect on rate (β31) | −0.076 | .330 | 0.007 | .982 | 0.030 | .571 |
| Pennsylvania’s effect on rate (β32) | −0.056 | .506 | 0.186 | .668 | −0.001 | .983 |
| Philadelphia’s effect on level (β21) | −0.142 | .700 | −0.851 | .411 | 0.051 | .817 |
| Pennsylvania’s effect on level (β22) | 0.805 | .031 | 1.232 | .220 | −0.028 | .894 |
| Quarter1 | 1.394 | <.001 | 4.638 | <.001 | 1.483 | <.001 |
| Quarter2 | 1.262 | <.001 | 4.180 | <.001 | 1.365 | <.001 |
| Quarter3 | 1.053 | <.001 | 4.930 | <.001 | 1.746 | <.001 |
| Special food services | Total R = 0.79 | Total R = 0.93 | Total R = 0.96 | |||
| Intercept (β0) | 1.305 | <.001 | 2.901 | <.001 | 0.142 | <.001 |
| Initial trend (β1) | 0.025 | .001 | −0.013 | .161 | 0.001 | .190 |
| Philadelphia’s effect on rate (β31) | 0.016 | .799 | −0.096 | .128 | 0.006 | .043 |
| Pennsylvania’s effect on rate (β32) | −0.110 | .115 | 0.095 | .256 | −0.004 | .241 |
| Philadelphia’s effect on level (β21) | −0.453 | .133 | −0.033 | .873 | 0.021 | .107 |
| Pennsylvania’s effect on level (β22) | 0.181 | .533 | 0.128 | .521 | −0.030 | .022 |
| Quarter1 | 0.488 | <.001 | 0.071 | .302 | 0.022 | .001 |
| Quarter2 | 1.120 | <.001 | 0.624 | <.001 | 0.085 | <.001 |
| Quarter3 | 0.906 | <.001 | 0.526 | <.001 | 0.114 | <.001 |
| Drinking places that serve alcohol | Total R = 0.92 | Total R = 0.97 | Total R = 0.96 | |||
| Intercept (β0) | 1.049 | <.001 | 2.726 | <.001 | 0.571 | <.001 |
| Initial trend (β1) | −0.014 | <.001 | −0.052 | <.001 | −0.006 | <.001 |
| Philadelphia’s effect on rate (β31) | −0.011 | .664 | 0.020 | .359 | 0.001 | .875 |
| Pennsylvania’s effect on rate (β32) | 0.010 | .752 | 0.036 | .180 | 0.004 | .539 |
| Philadelphia’s effect on level (β21) | 0.057 | .614 | −0.085 | .376 | 0.005 | .841 |
| Pennsylvania’s effect on level (β22) | 0.044 | .672 | 0.015 | .868 | −0.002 | .945 |
| Quarter1 | 0.222 | <.001 | 0.481 | <.001 | 0.199 | <.001 |
| Quarter2 | 0.189 | <.001 | 0.368 | <.001 | 0.142 | <.001 |
| Quarter3 | 0.139 | <.001 | 0.463 | <.001 | 0.169 | <.001 |
Abbreviation: CIAA, Clean Indoor Air Act.
Table 2. Effect of Philadelphia and Pennsylvania CIAA on Adjusted Number of Specific Types of Food Service or Drinking Place by Region, 1998–2011
| Type of Business | Philadelphia | Surrounding Counties | Rest of the State | |||
|---|---|---|---|---|---|---|
| β | P Value | β | P Value | β | P Value | |
| Full-service restaurants | Total R = 0.99 | Total R = 0.99 | Total R = 0.99 | |||
| Intercept (β0) | 6.624 | <.001 | 9.164 | <.001 | 9.313 | <.001 |
| Initial trend (β1) | −0.095 | <.001 | −0.148 | <.001 | −0.170 | <.001 |
| Philadelphia’s effect on rate (β31) | 0.079 | .021 | 0.105 | .120 | 0.191 | .024 |
| Pennsylvania’s effect on rate (β32) | 0.017 | .671 | 0.019 | .833 | −0.031 | .774 |
| Philadelphia’s effect on level (β21) | 0.149 | .321 | 0.344 | .166 | 0.092 | .715 |
| Pennsylvania’s effect on level (β22) | 0.024 | .865 | 0.044 | .848 | 0.073 | .763 |
| Quarter1 | 0.131 | .005 | 0.637 | <.001 | 0.925 | <.001 |
| Quarter2 | −0.035 | .382 | 0.015 | .766 | −0.044 | .391 |
| Quarter3 | 0.115 | .011 | 0.505 | <.001 | 0.723 | <.001 |
| Limited-service eating places | Total Ra = 0.83 | Total Ra = 0.95 | Total R = 0.92 | |||
| Intercept (β0) | 3.288 | <.001 | 5.052 | <.001 | 4.026 | <.001 |
| Initial trend (β1) | 0.061 | .013 | 0.050 | .165 | −0.028 | .002 |
| Philadelphia’s effect on rate (β31) | 0.079 | .199 | 0.123 | .189 | 0.019 | .757 |
| Pennsylvania’s effect on rate (β32) | 0.023 | .692 | 0.051 | .566 | 0.009 | .915 |
| Philadelphia’s effect on level (β21) | 0.066 | .661 | 0.187 | .421 | 0.099 | .654 |
| Pennsylvania’s effect on level (β22) | 0.077 | .587 | 0.081 | .713 | 0.044 | .836 |
| Quarter1 | 0.192 | <.001 | 0.642 | <.001 | 0.790 | <.001 |
| Quarter2 | −0.015 | .695 | 0.024 | .664 | −0.011 | .829 |
| Quarter3 | 0.172 | <.001 | 0.567 | <.0001 | 0.659 | <.001 |
| Special food services | Total Ra = 0.89 | Total Ra = 0.93 | Total R = 0.87 | |||
| Intercept (β0) | 0.393 | <.001 | 0.779 | <.001 | 0.405 | <.001 |
| Initial trend (β1) | 0.009 | <.001 | 0.012 | <.001 | 0.002 | .021 |
| Philadelphia’s effect on rate (β31) | 0.017 | .002 | −0.018 | .008 | 0.003 | .539 |
| Pennsylvania’s effect on rate (β32) | 0.006 | .205 | 0.030 | <.001 | 0.001 | .855 |
| Philadelphia’s effect on level (β21) | 0.026 | .153 | 0.006 | .851 | 0.015 | .549 |
| Pennsylvania’s effect on level (β22) | 0.010 | .556 | −0.008 | .767 | −0.009 | .700 |
| Quarter1 | 0.007 | .164 | 0.072 | <.001 | 0.062 | .001 |
| Quarter2 | −0.003 | .582 | 0.005 | .460 | 0.004 | .549 |
| Quarter3 | 0.014 | .006 | 0.061 | <.001 | 0.065 | <.001 |
| Drinking places that serve alcohol | Total R = 0.99 | Total Ra = 0.99 | Total R = 0.99 | |||
| Intercept (β0) | 4.697 | <.001 | 3.067 | <.001 | 5.555 | <.001 |
| Initial trend (β1) | −0.079 | <.001 | −0.035 | <.001 | −0.107 | <.001 |
| Philadelphia’s effect on rate (β31) | 0.040 | .261 | 0.059 | .024 | 0.094 | .009 |
| Pennsylvania’s effect on rate (β32) | 0.035 | .465 | 0.022 | .377 | −0.005 | .918 |
| Philadelphia’s effect on level (β21) | 0.011 | .924 | 0.037 | .650 | −0.016 | .894 |
| Pennsylvania’s effect on level (β22) | 0.040 | .712 | 0.005 | .946 | 0.053 | .627 |
| Quarter1 | −0.091 | .041 | 0.061 | .040 | 0.019 | .660 |
| Quarter2 | −0.010 | .733 | −0.003 | .885 | −0.024 | .263 |
| Quarter3 | −0.108 | .015 | 0.032 | .267 | −0.057 | .193 |
Abbreviation: CIAA, Clean Indoor Air Act.
a Model includes quadratic term for time.
The opinions expressed by authors contributing to this journal do not necessarily reflect the opinions of the U.S. Department of Health and Human Services, the Public Health Service, the Centers for Disease Control and Prevention, or the authors' affiliated institutions.
