
Infographic Gallery
Health, United States 2020-2021 Infographics


Twitter Graphics
Health, United States, 2020–2021
Health, United States, 2019
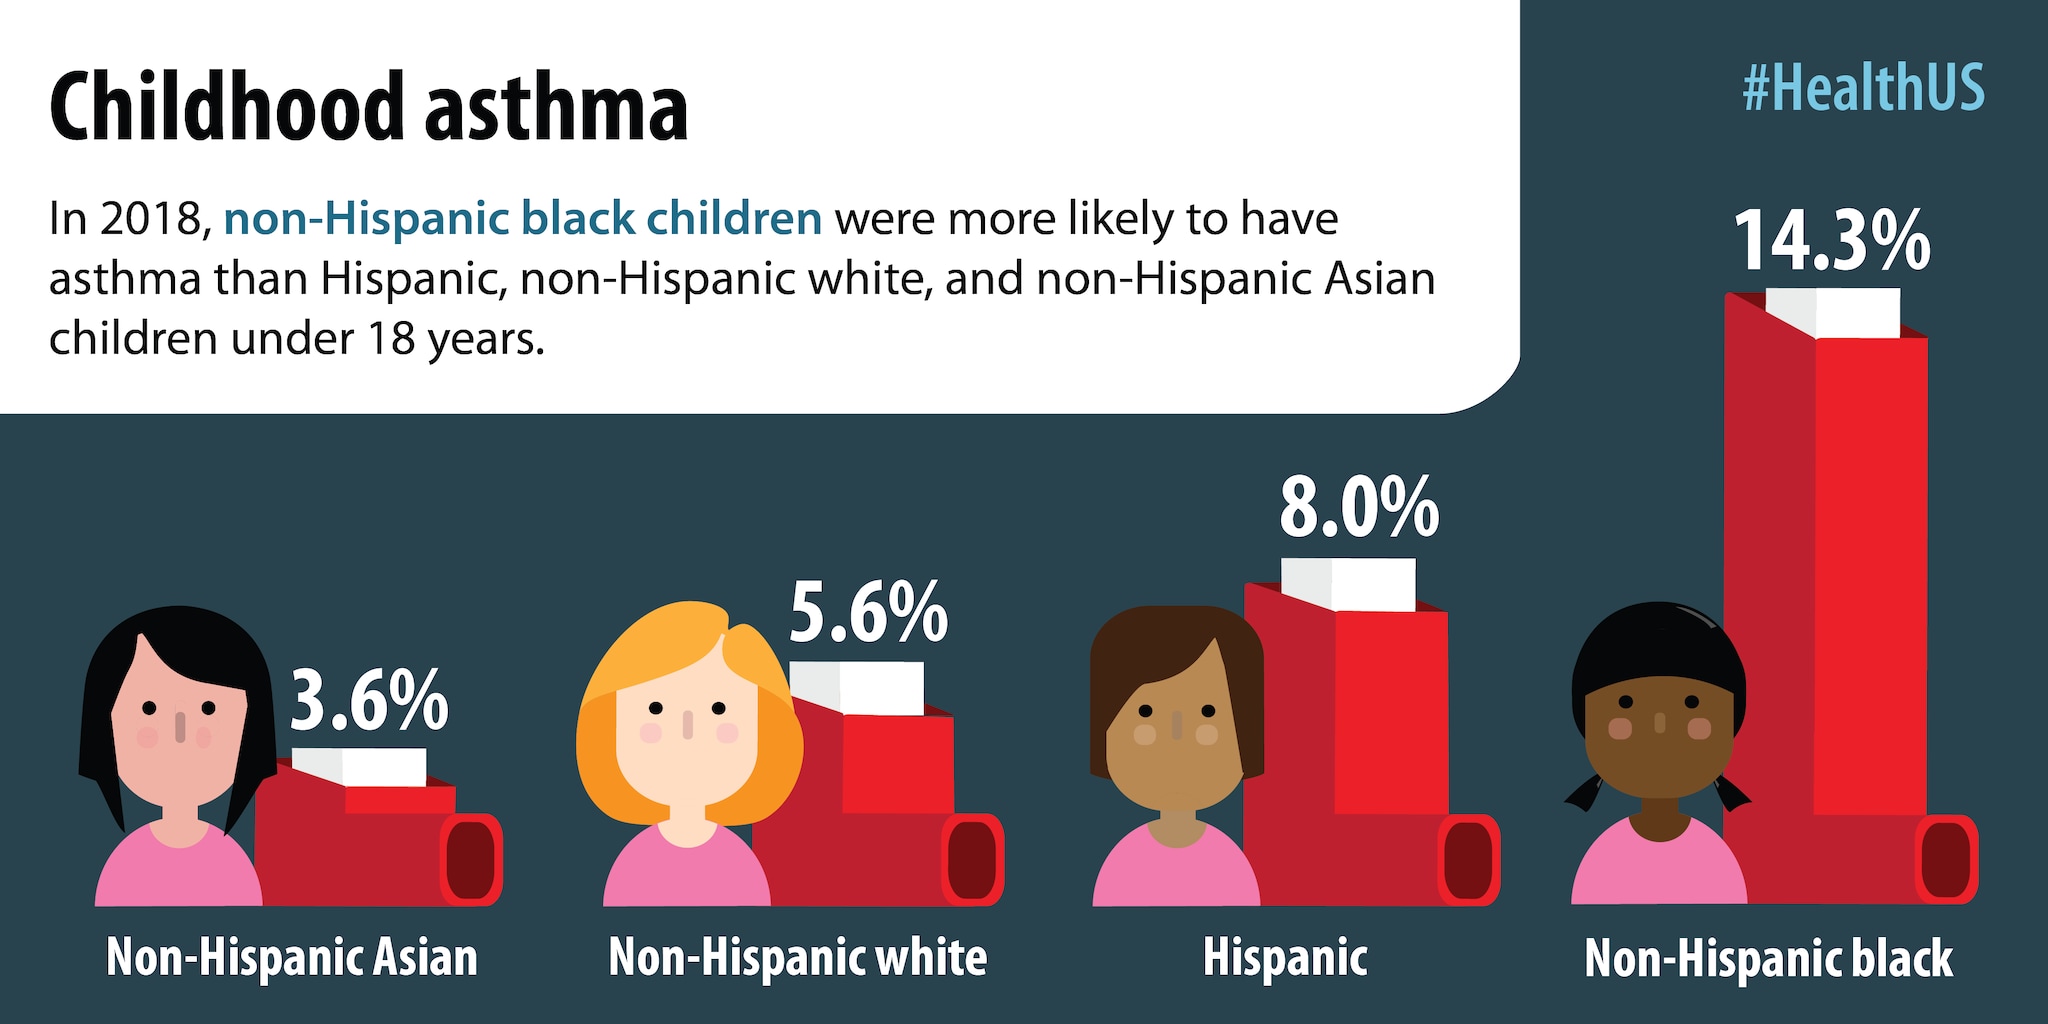
In 2018, non-Hispanic black children were more likely to have asthma than Hispanic, non-Hispanic white, and non-Hispanic Asian children under 18 years.
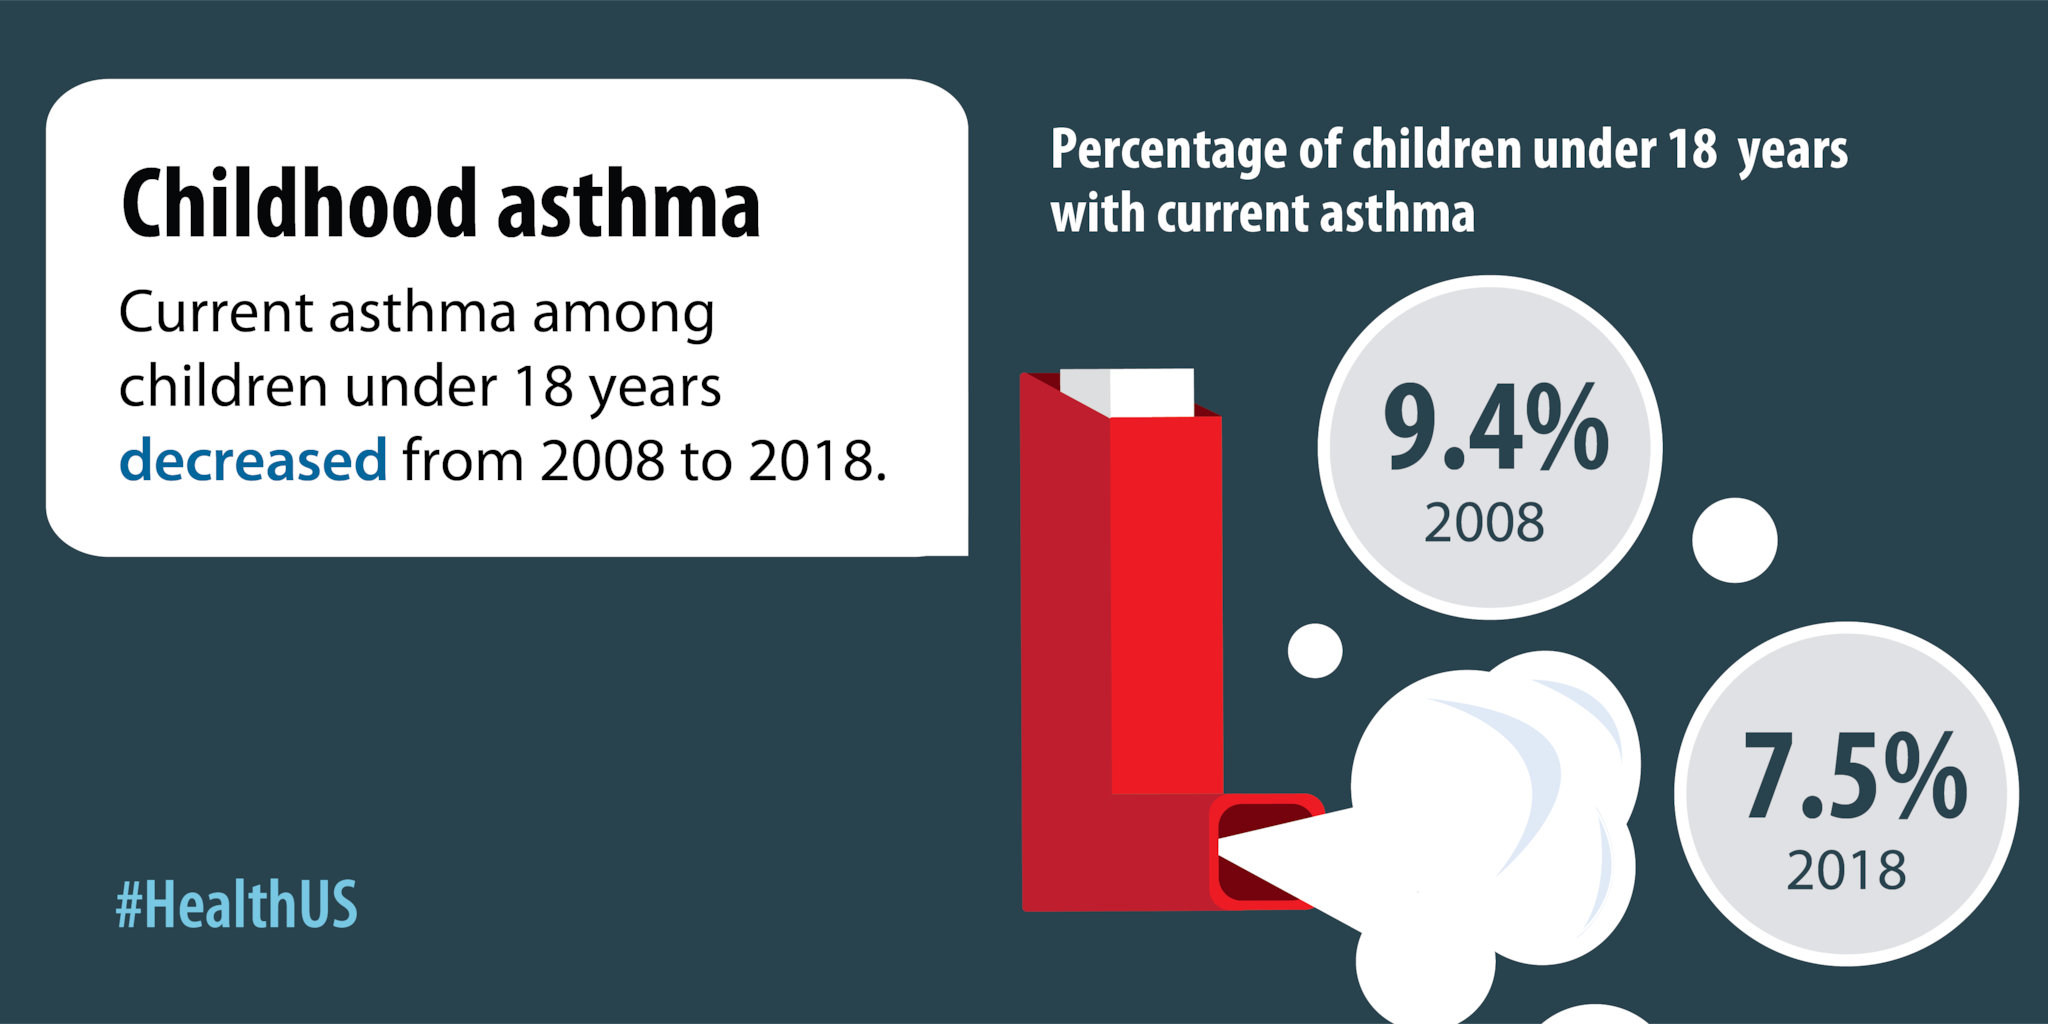
Current asthma among children under 18 years decreased from 2008 to 2018.
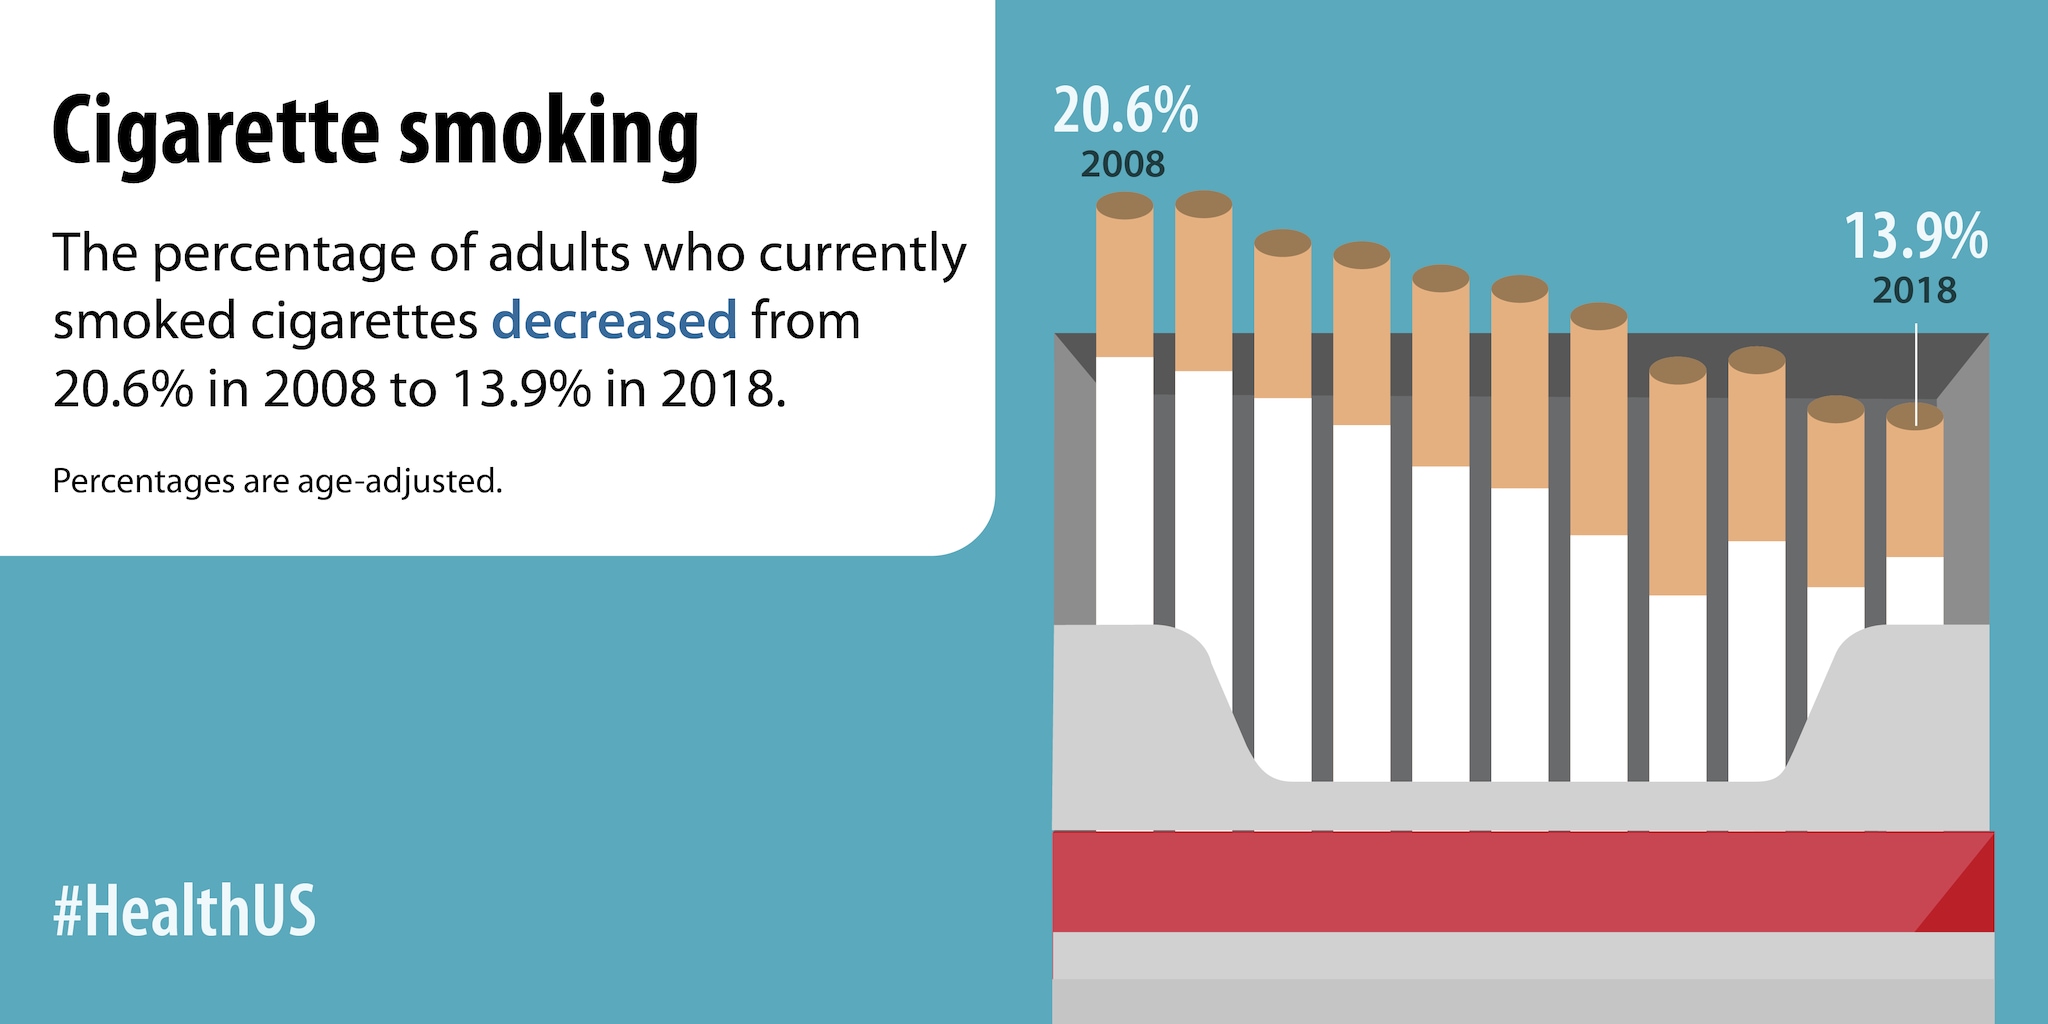
The percentage of adults who currently smoked cigarettes decreased from 20.6% in 2008 to 13.9% in 2018.
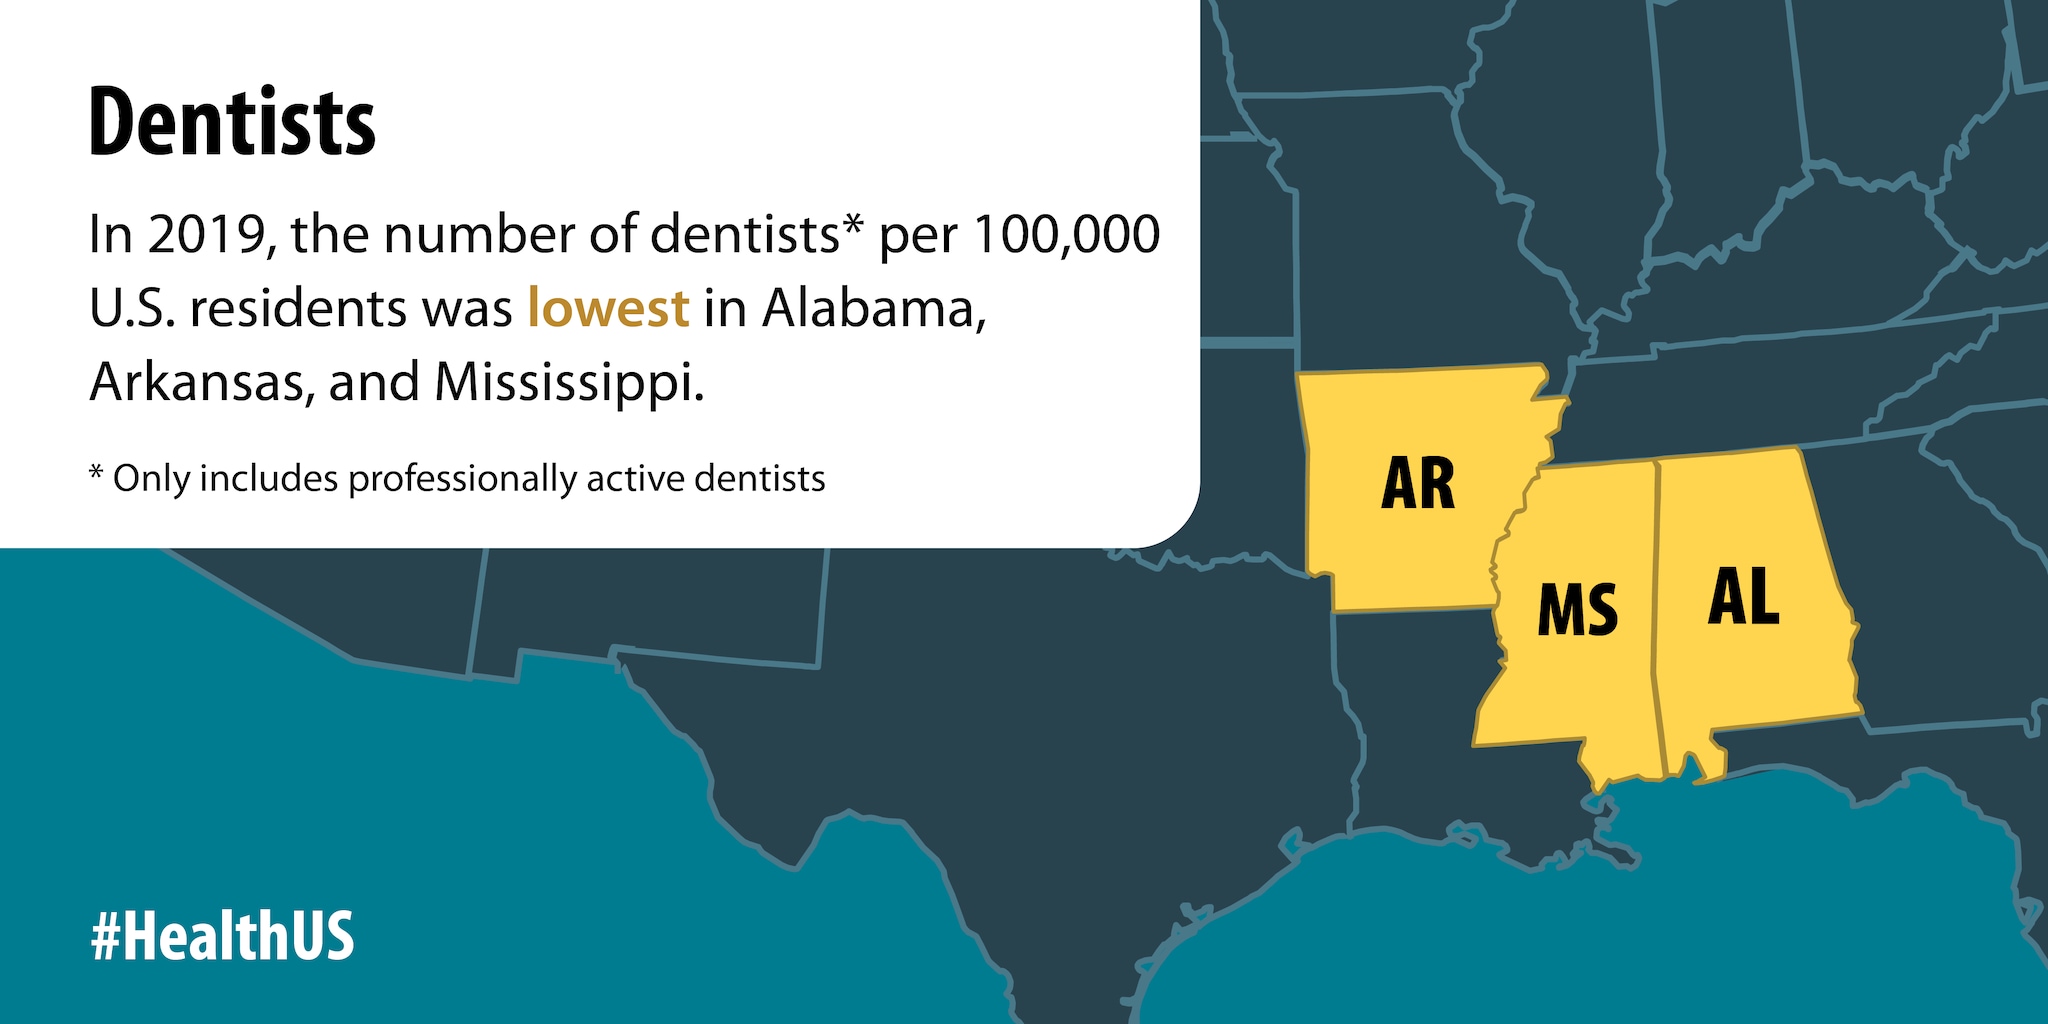
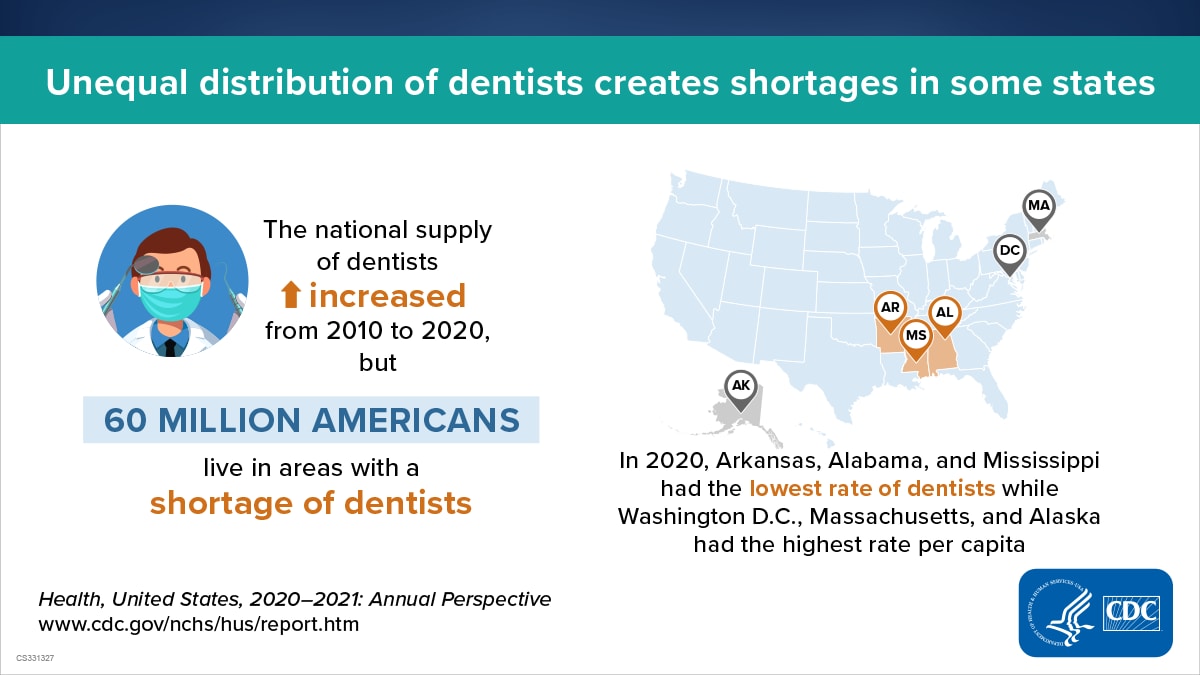
In 2019, the number of dentists per 100,000 U.S. residents was lowest in Alabama, Arkansas, and Mississippi.
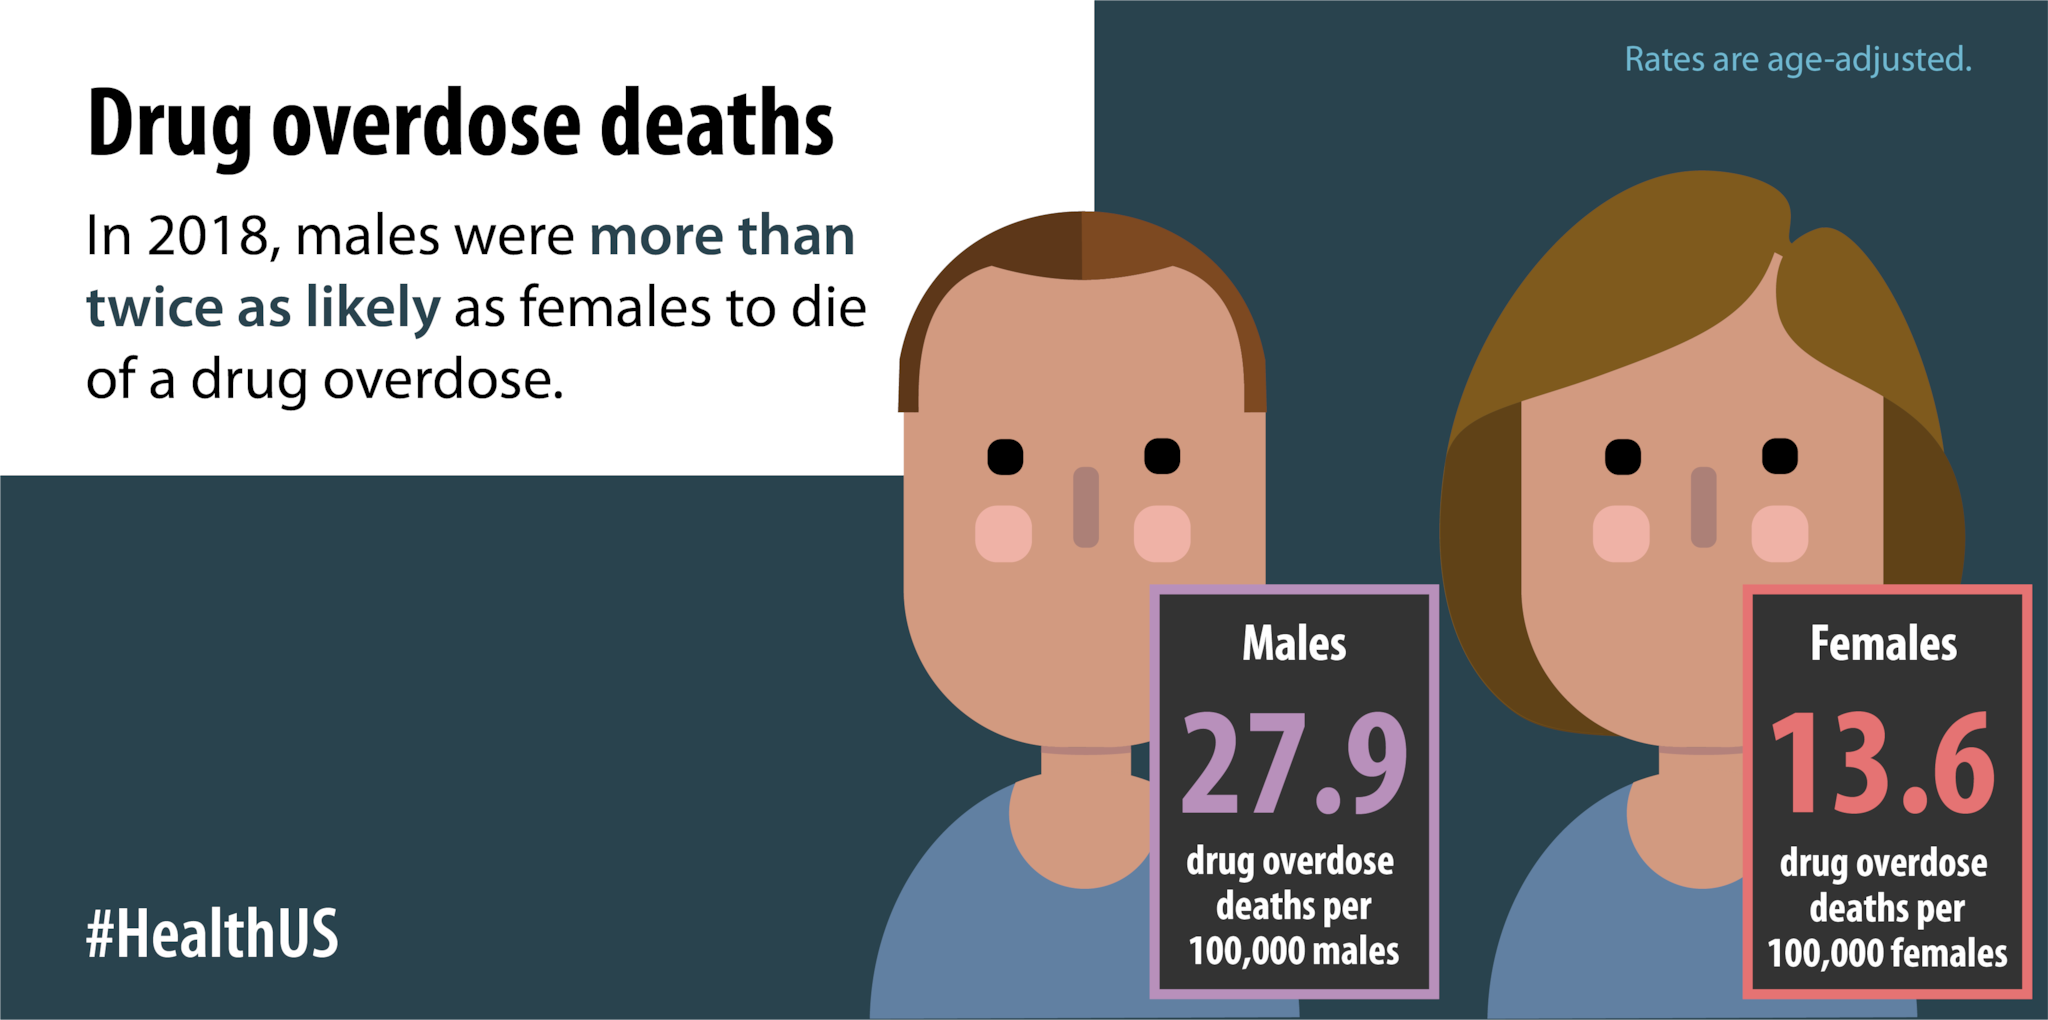
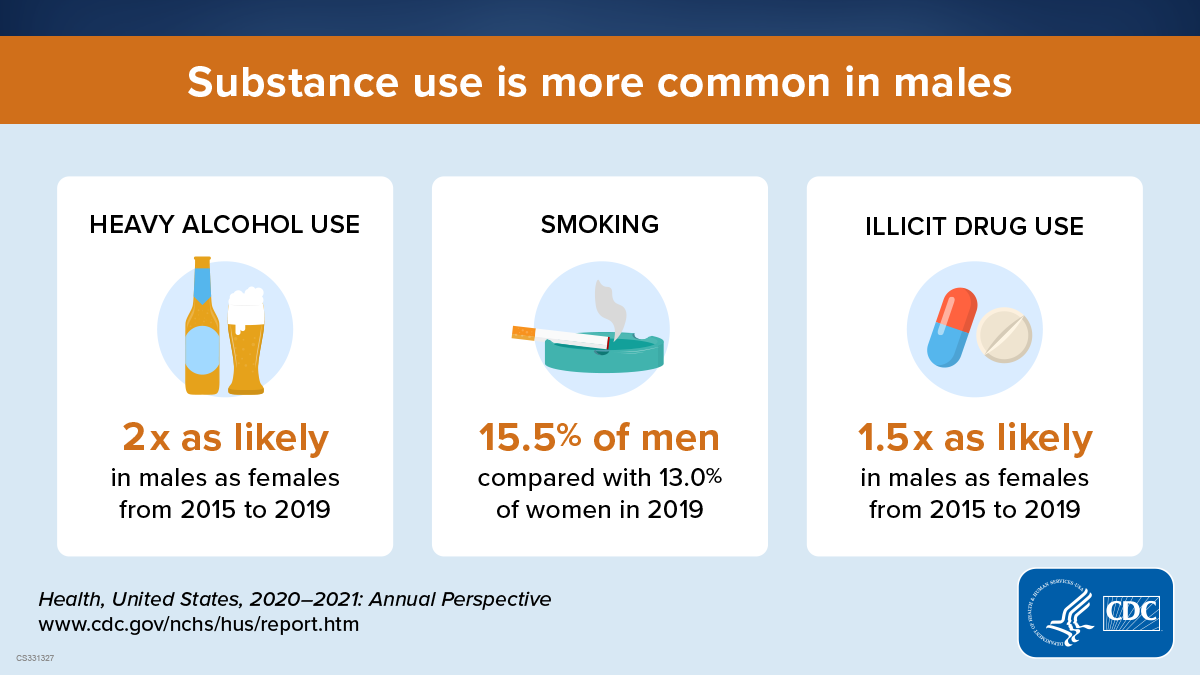
In 2018, males were more than twice as likely as females to die of a drug overdose.
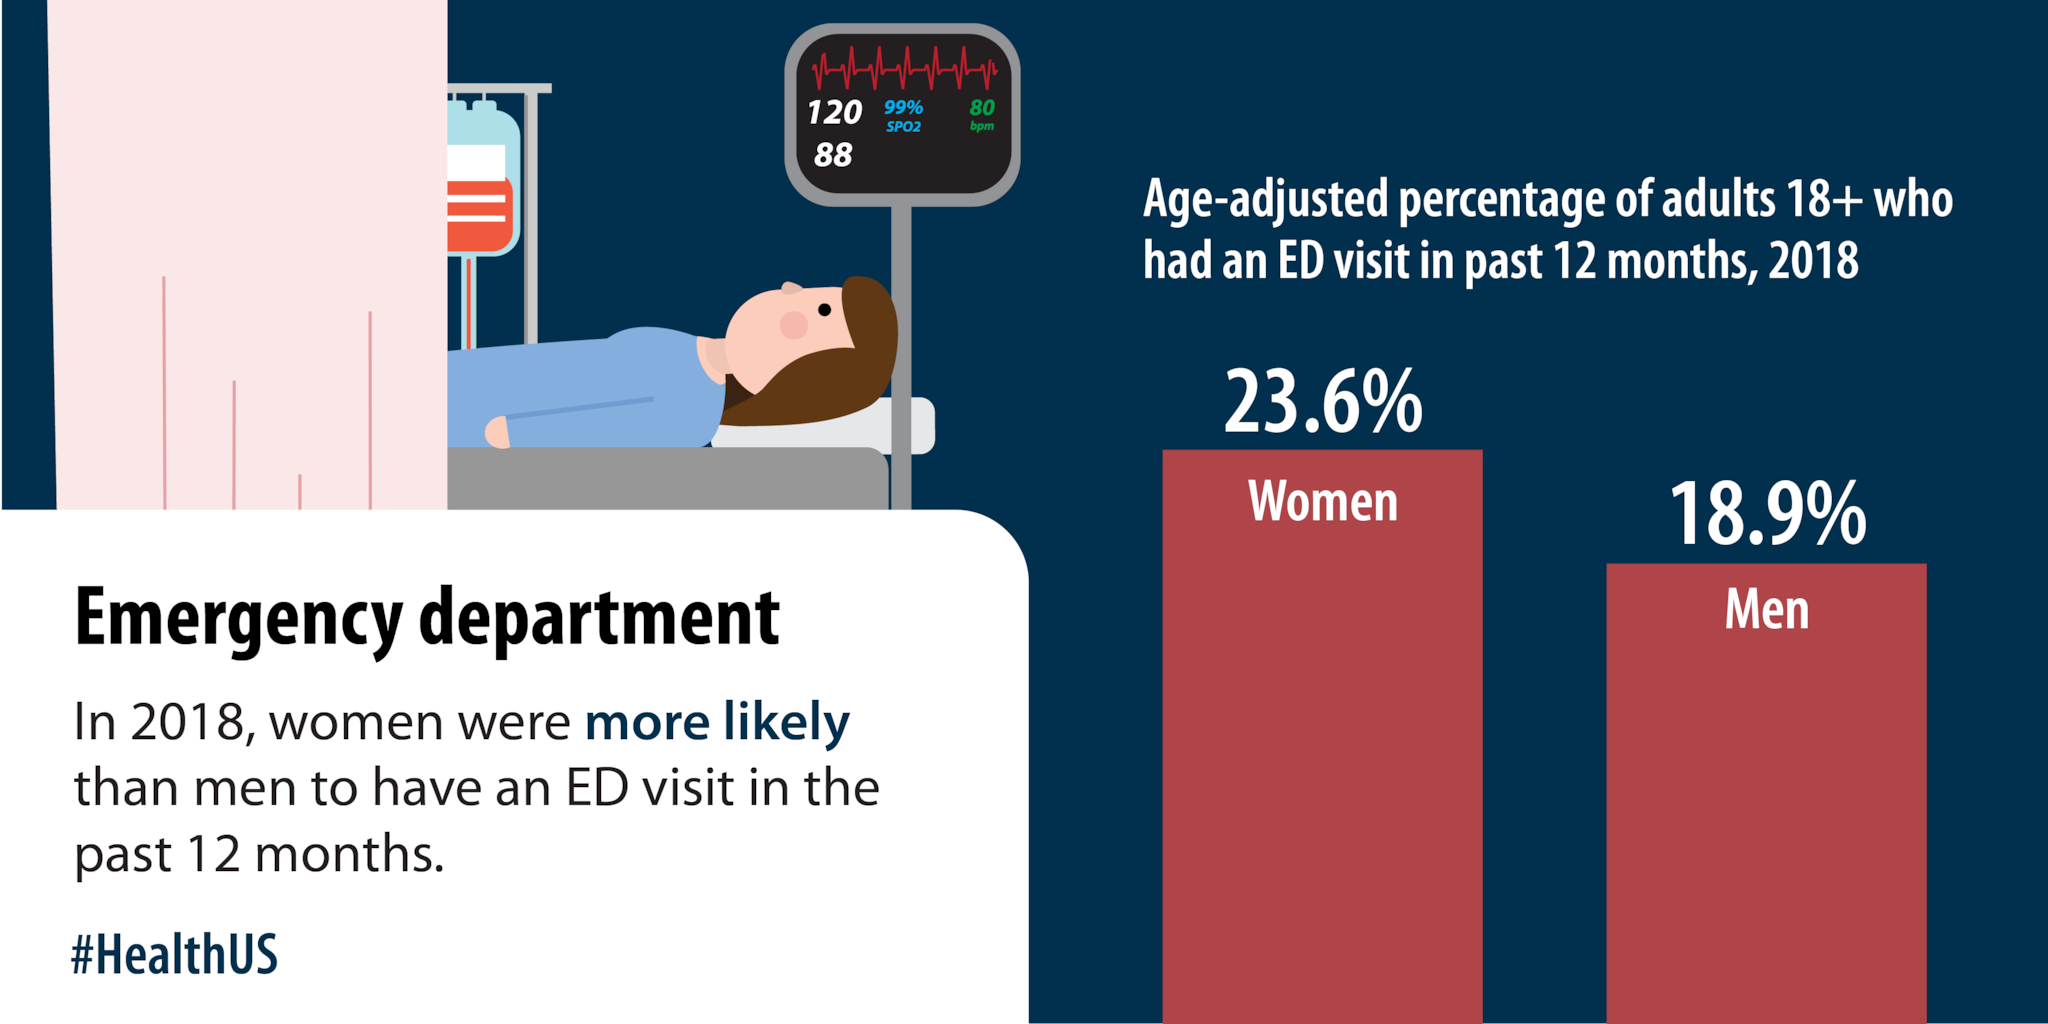
In 2018, women were more likely than men to have an ED visit in the past 12 months.
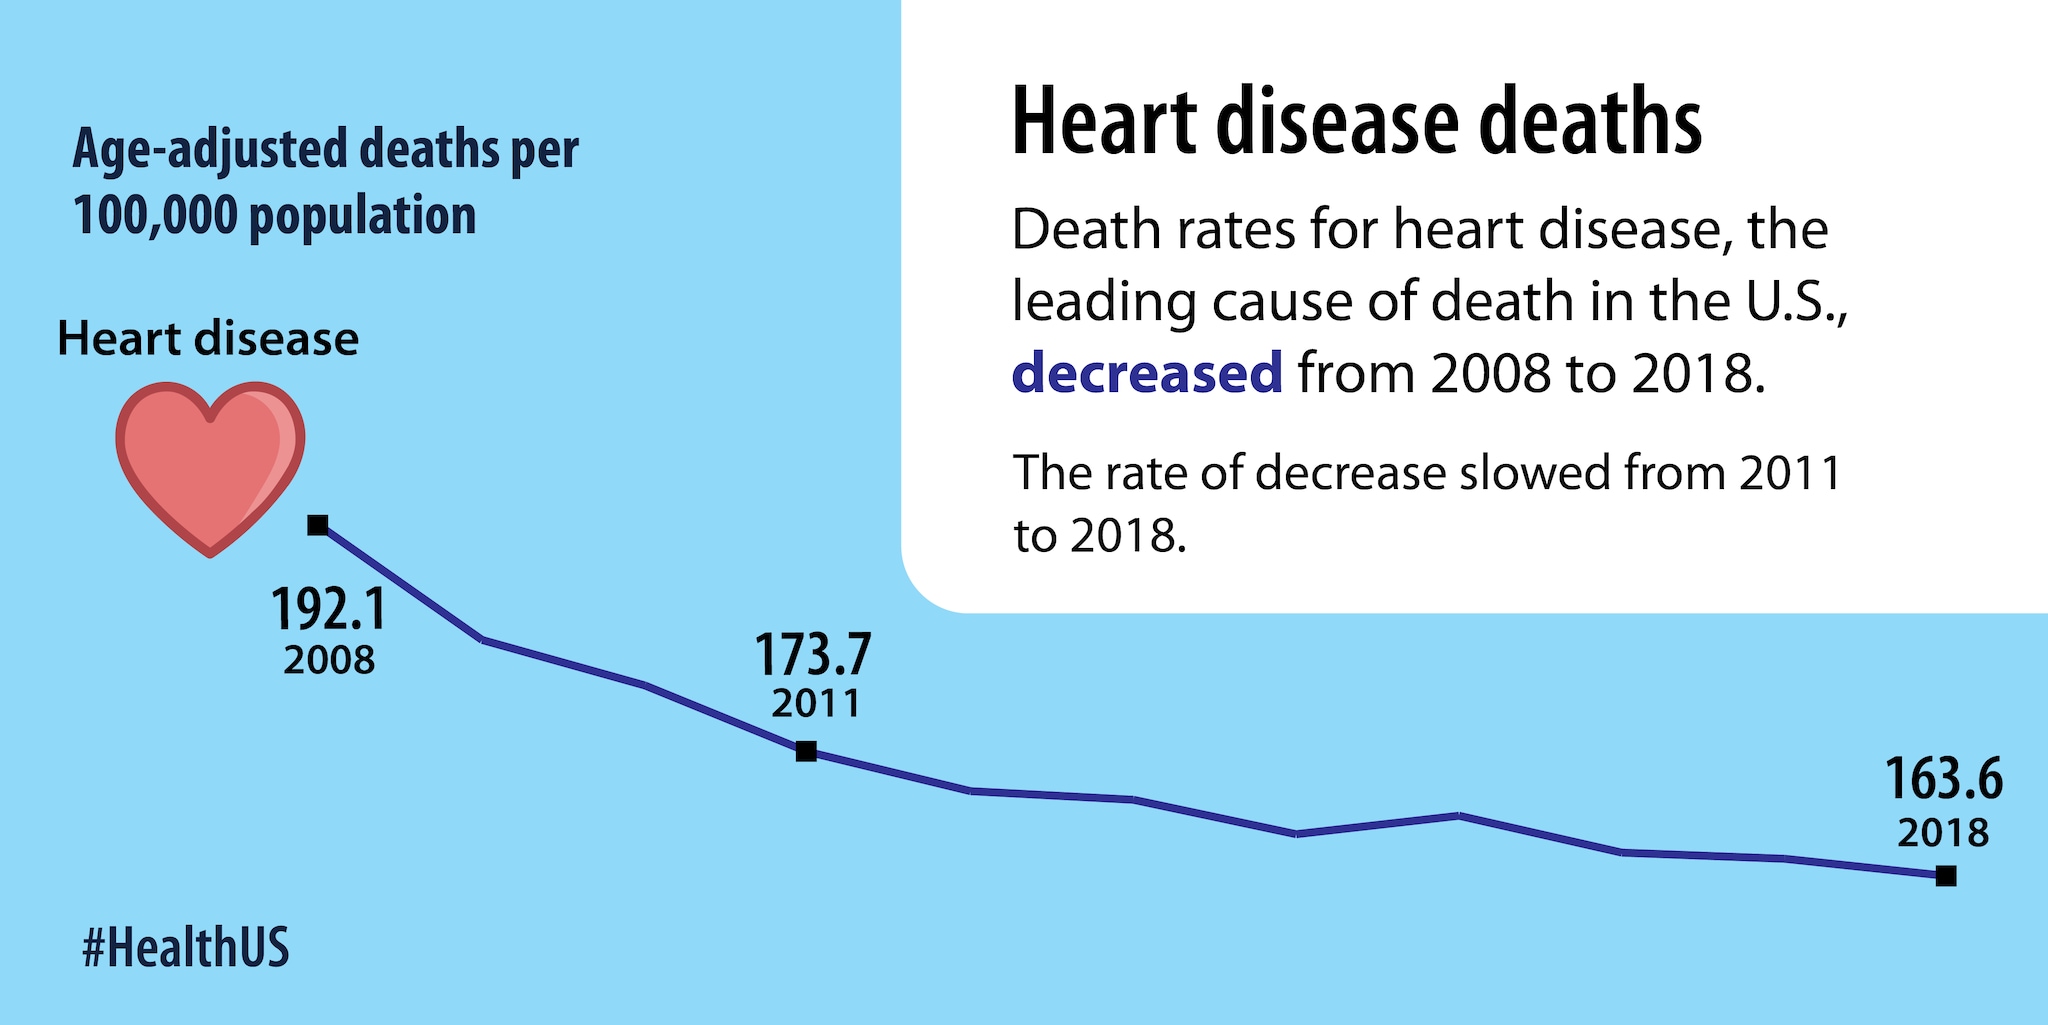
Death rates for heart disease, the leading cause of death in the U.S., decreased from 2008 to 2018.
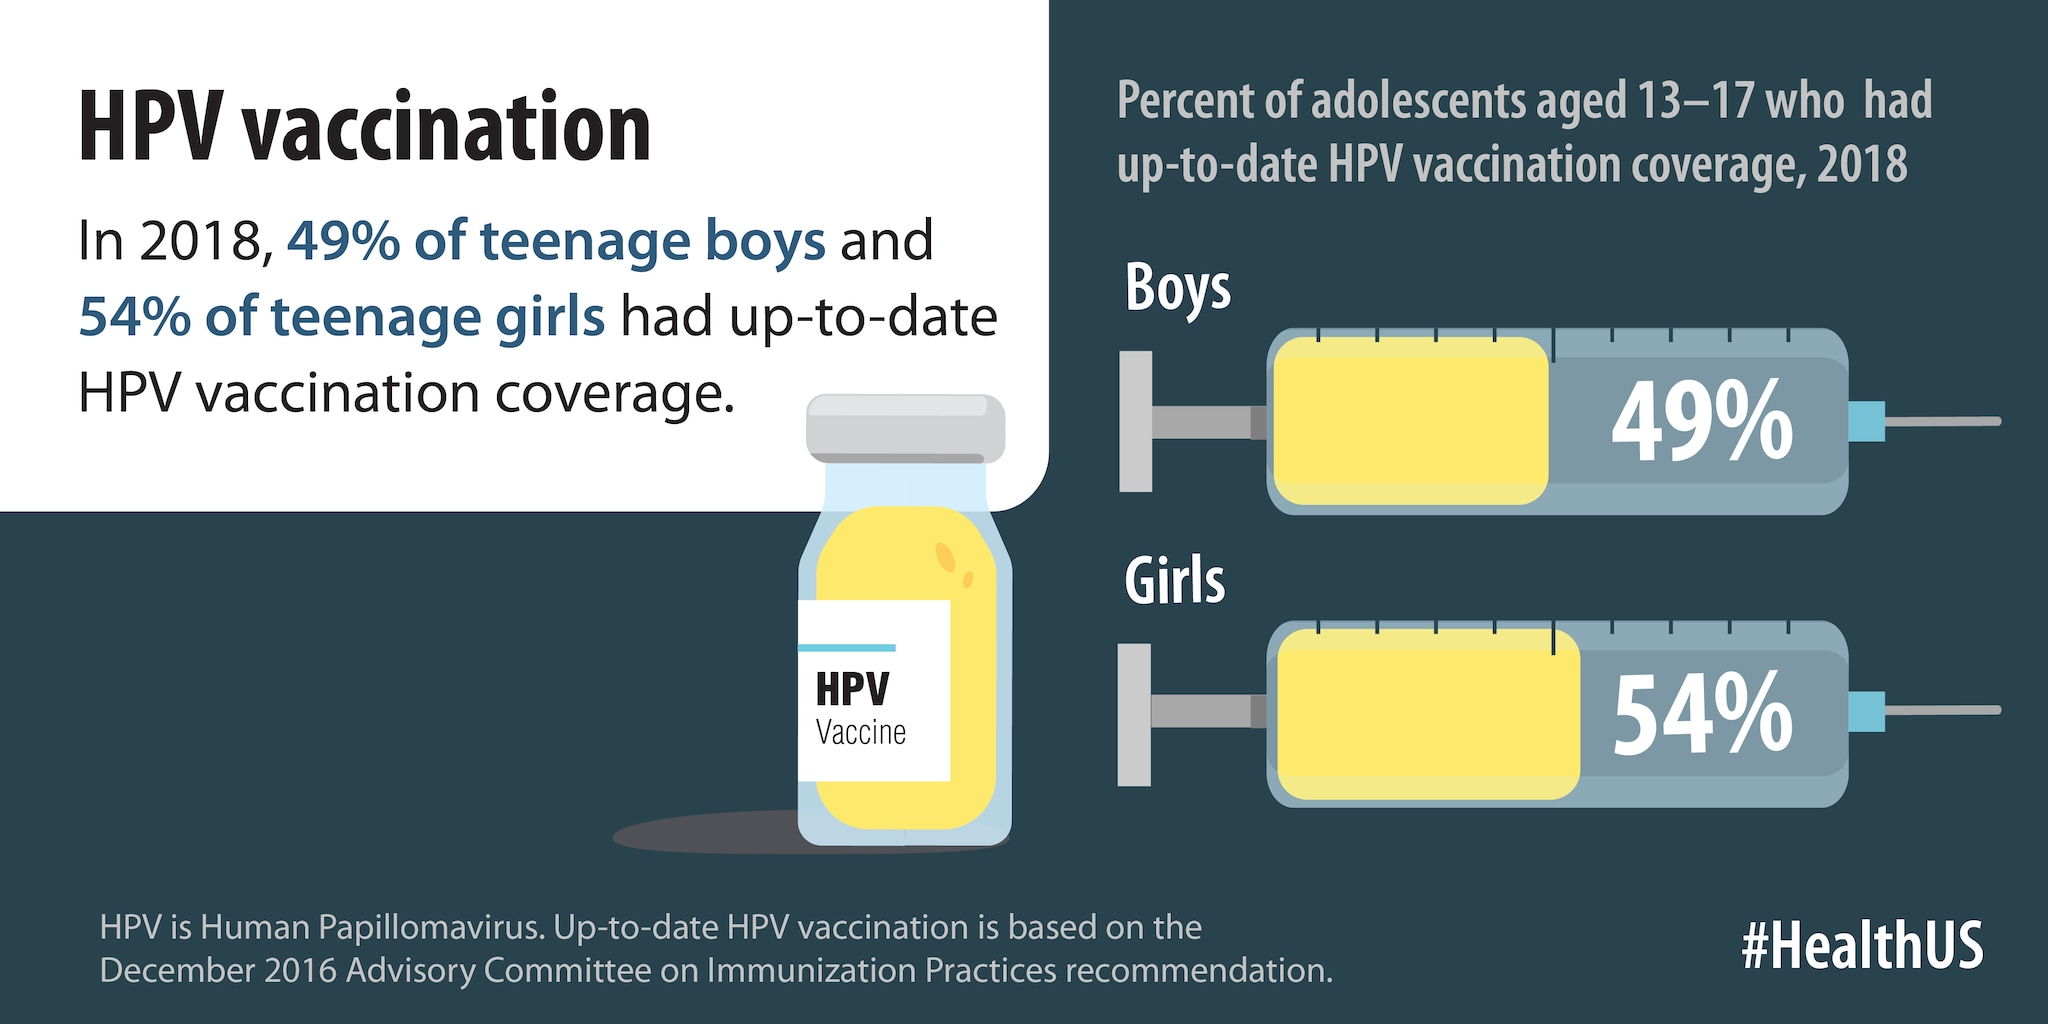
In 2018, 49% of teenage boys and 54% of teenage girls had up-to-date HPV vaccination coverage.
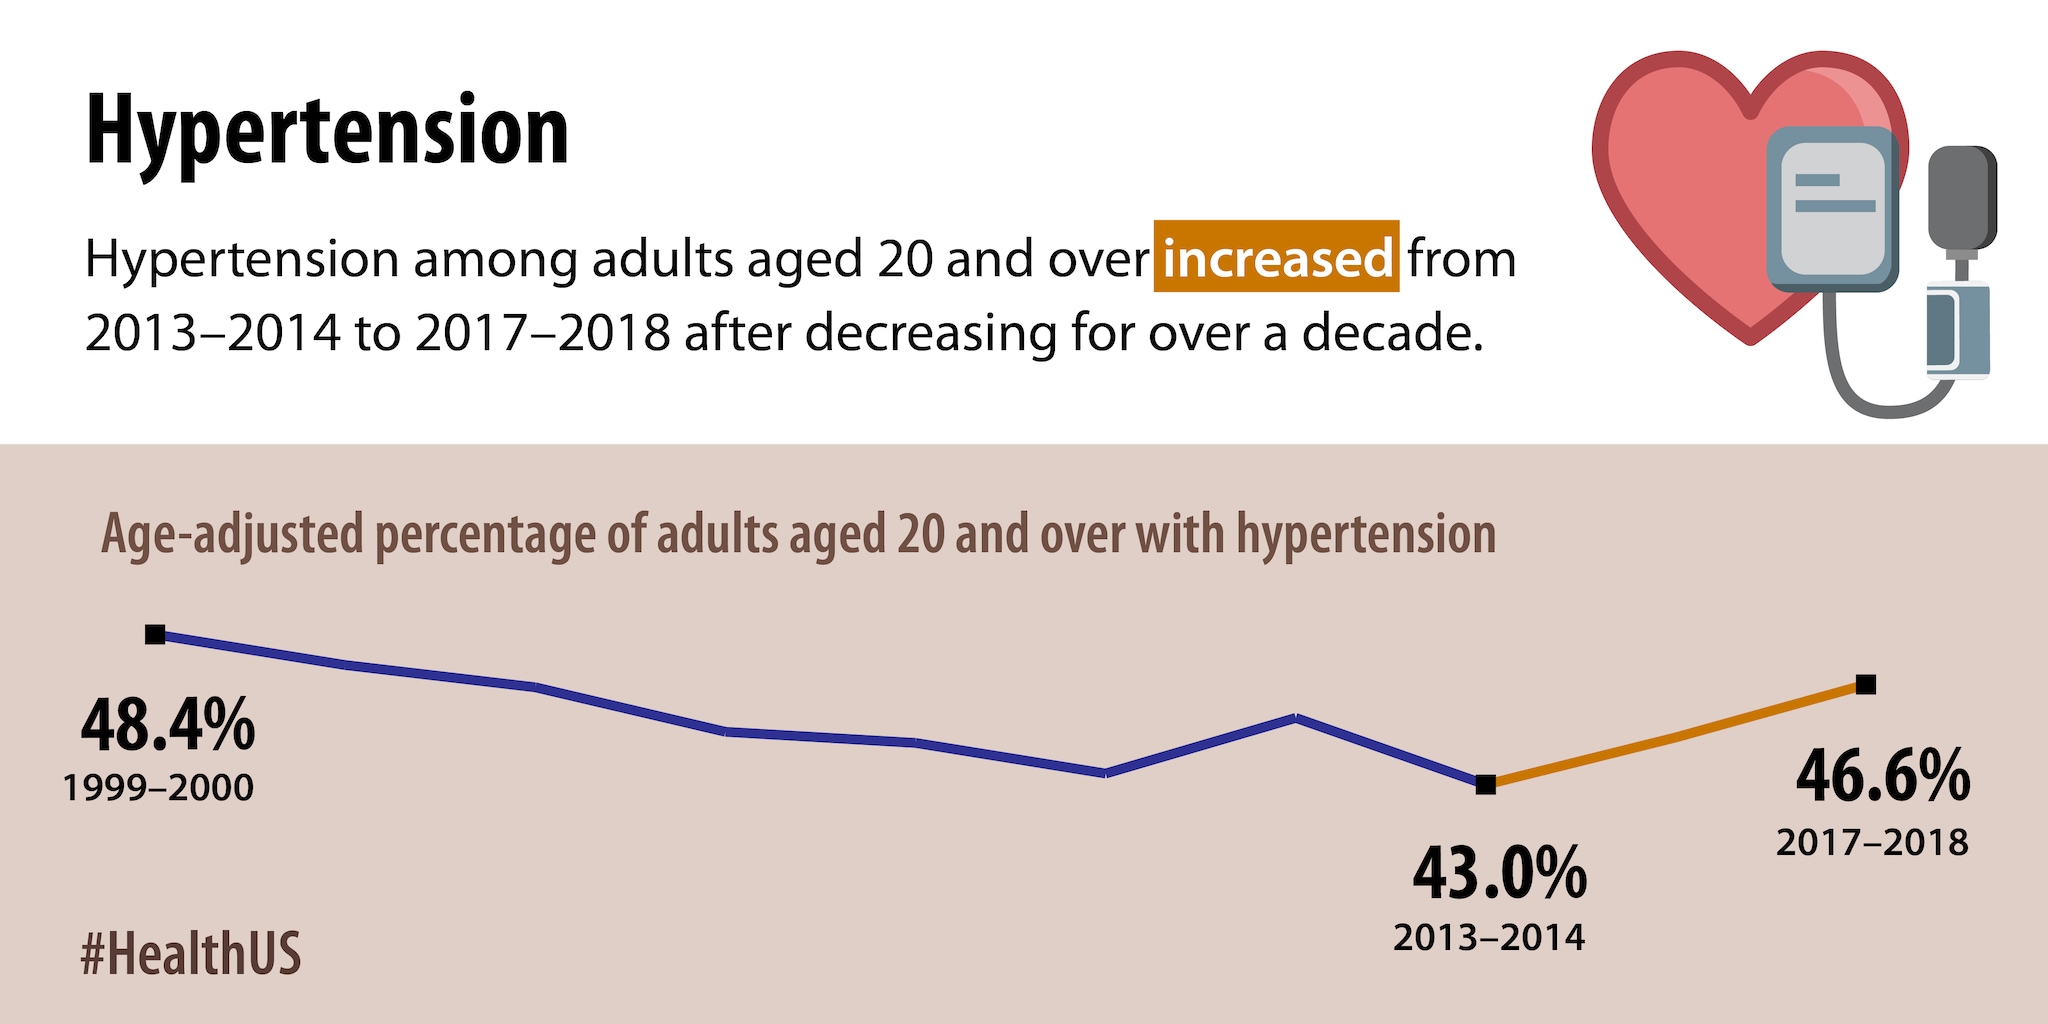
Hypertension among adults aged 20 and over increased from 2013-2014 to 2017-2018 after decreasing for over a decade.
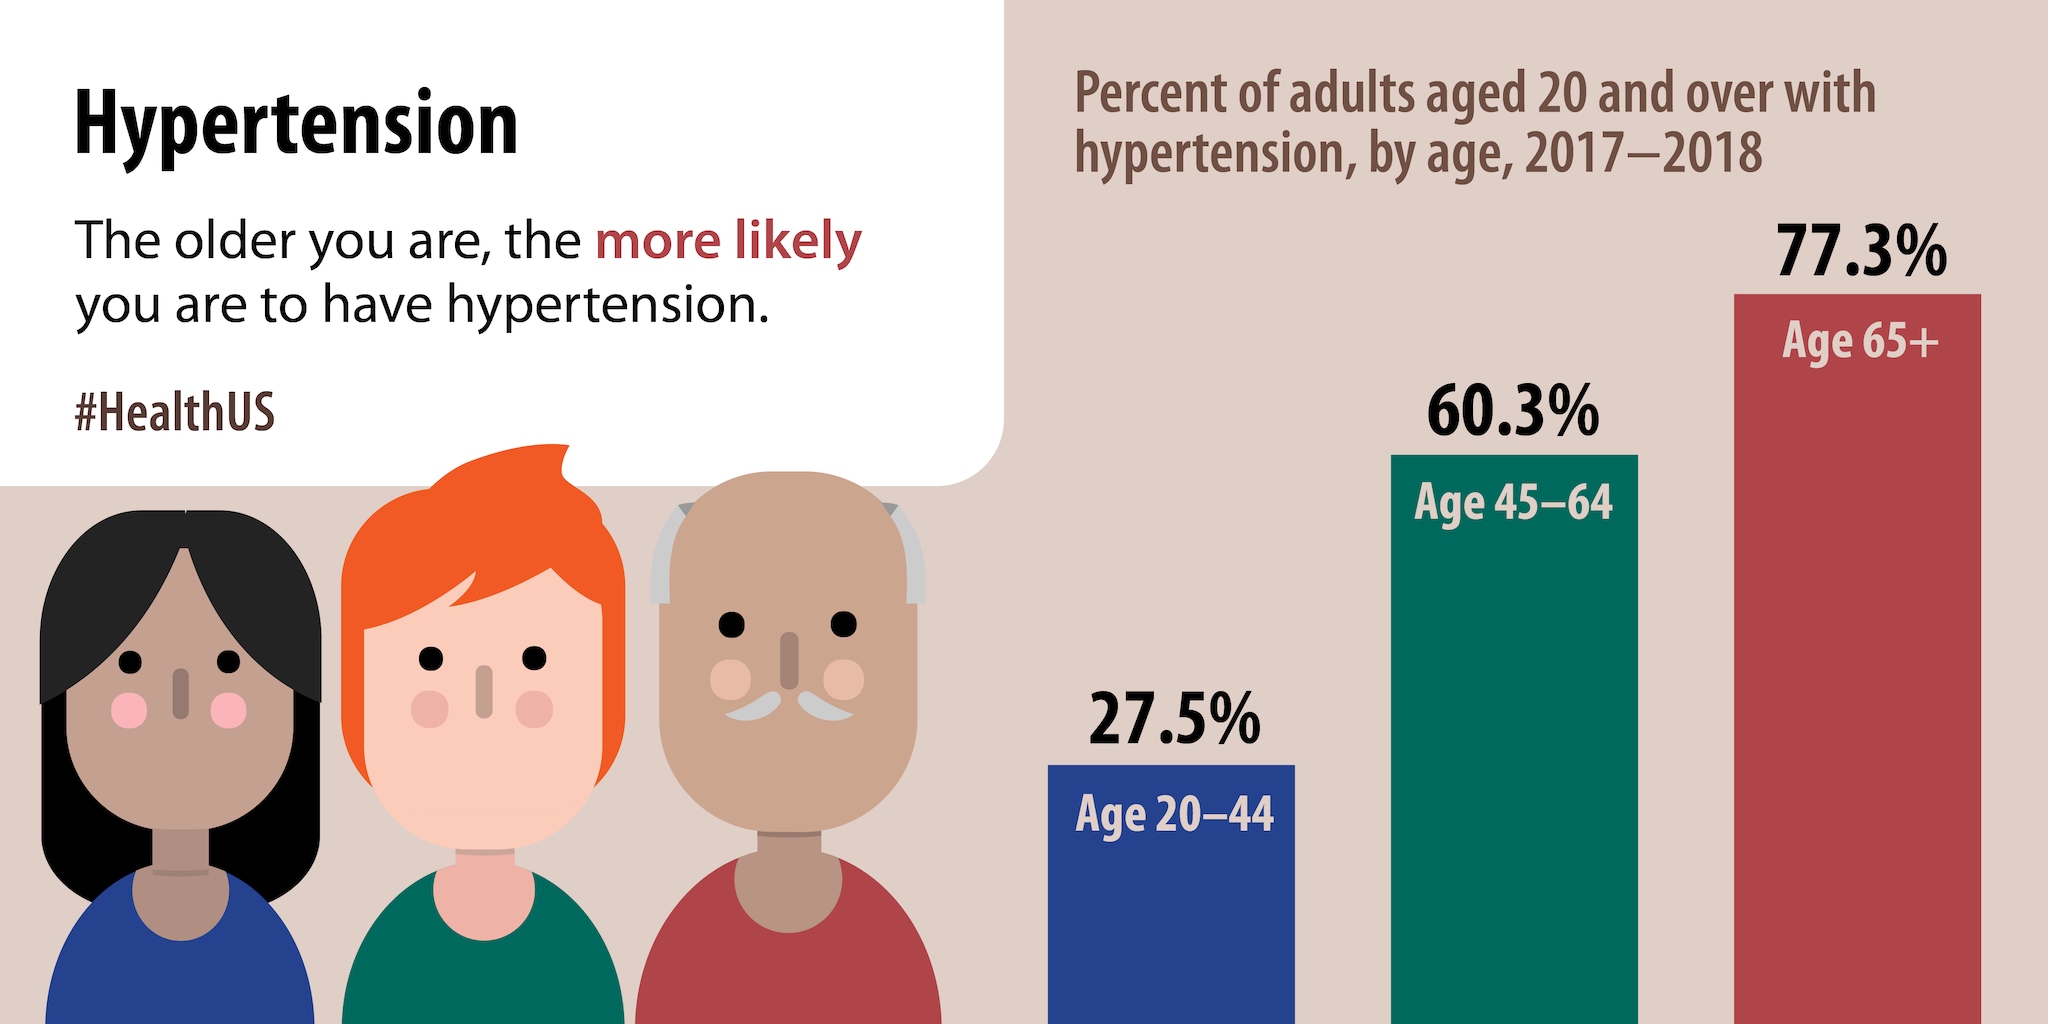
The older you are, the more likely you are to have hypertension.
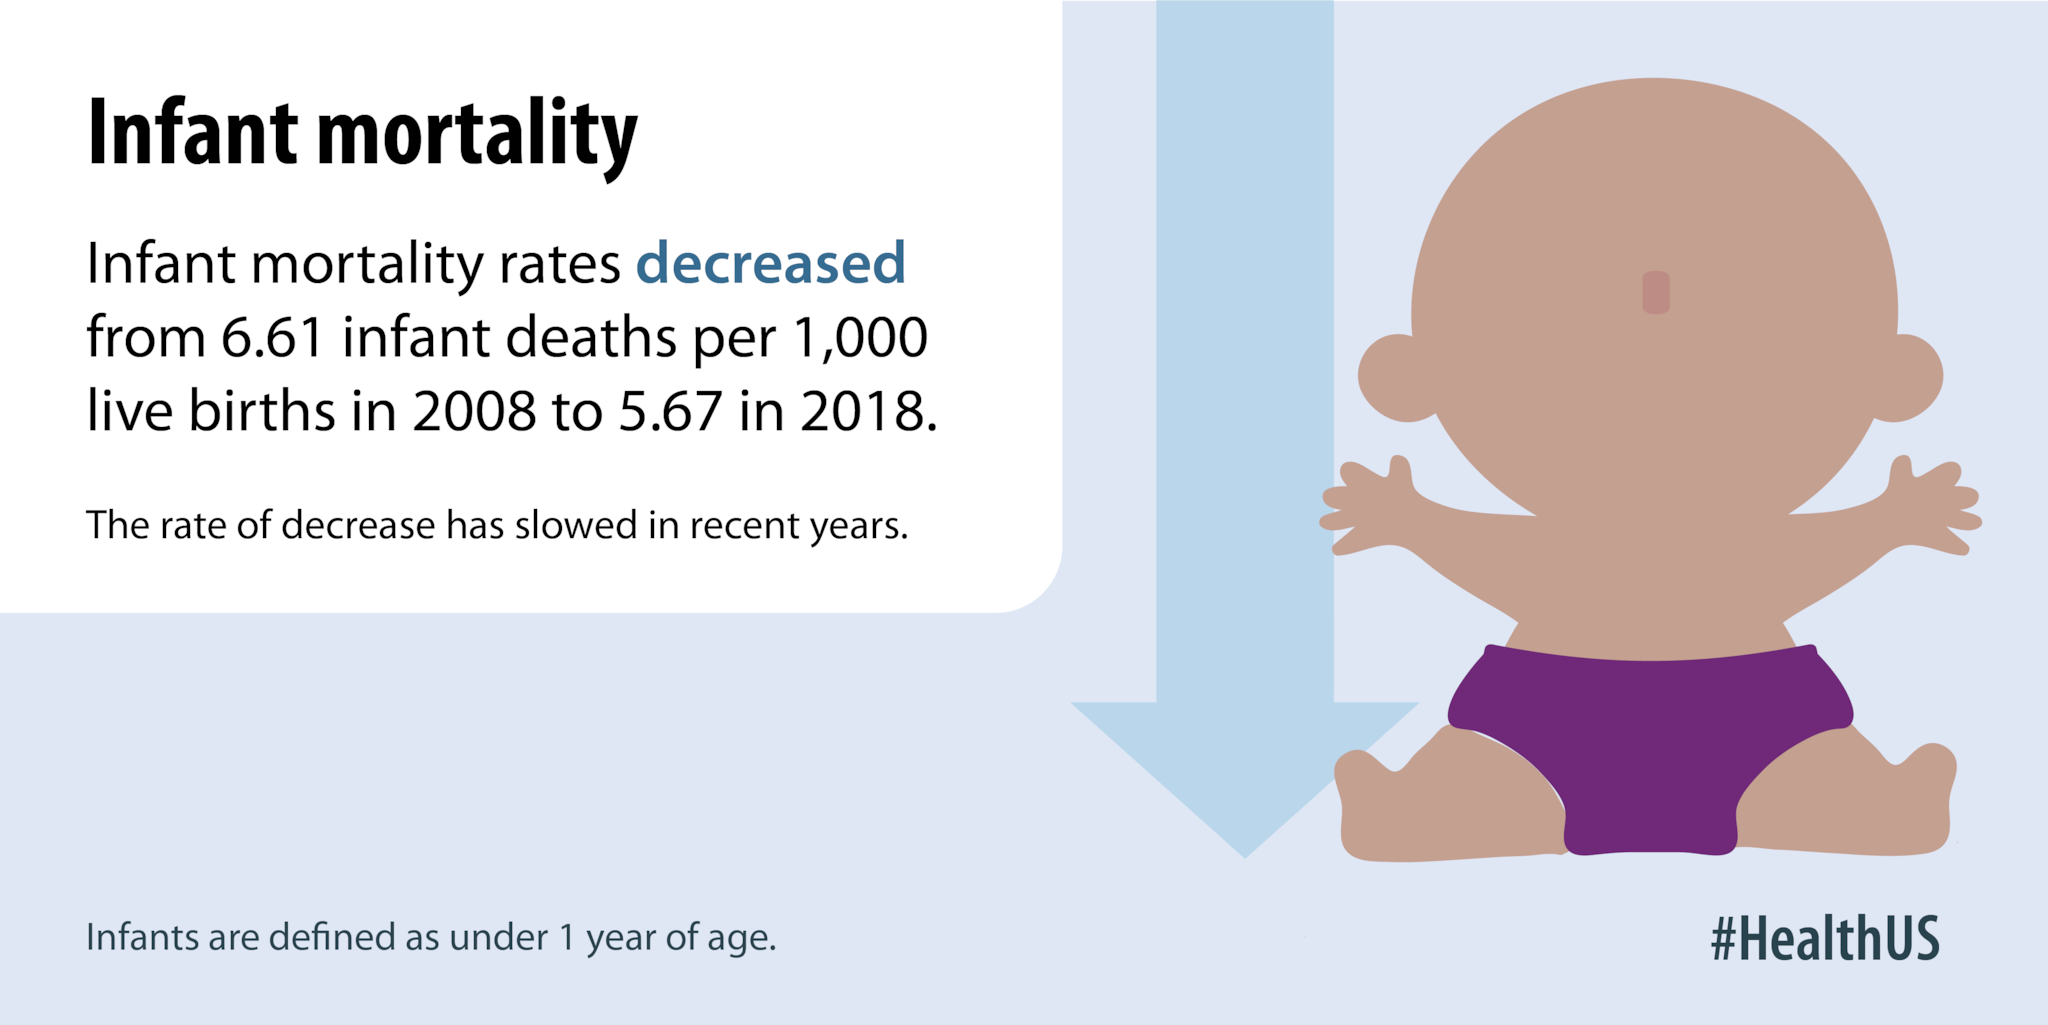
Infant mortality rates decreased from 6.61 infant deaths per 1,000 live births in 2008 to 5.67 in 2018.
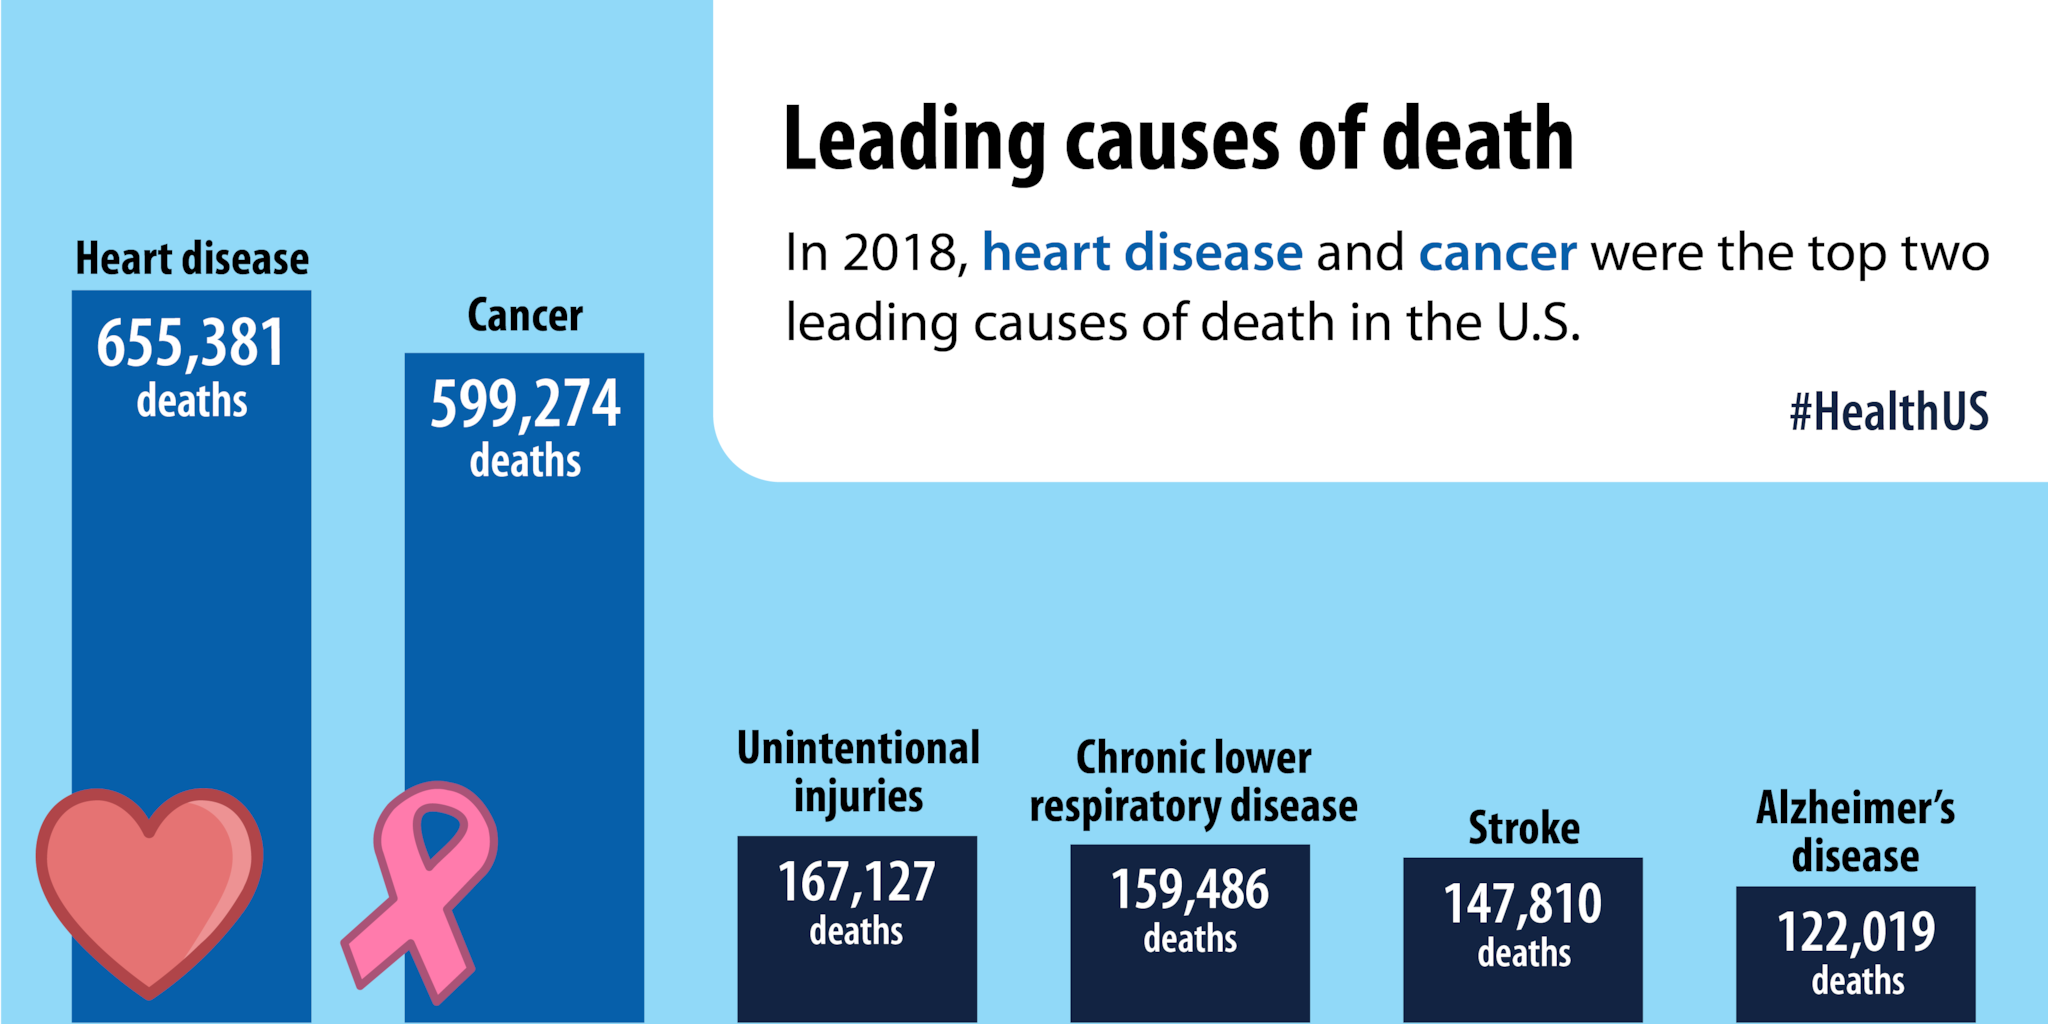
In 2018, heart disease and cancer were the top two leading causes of death in the U.S.
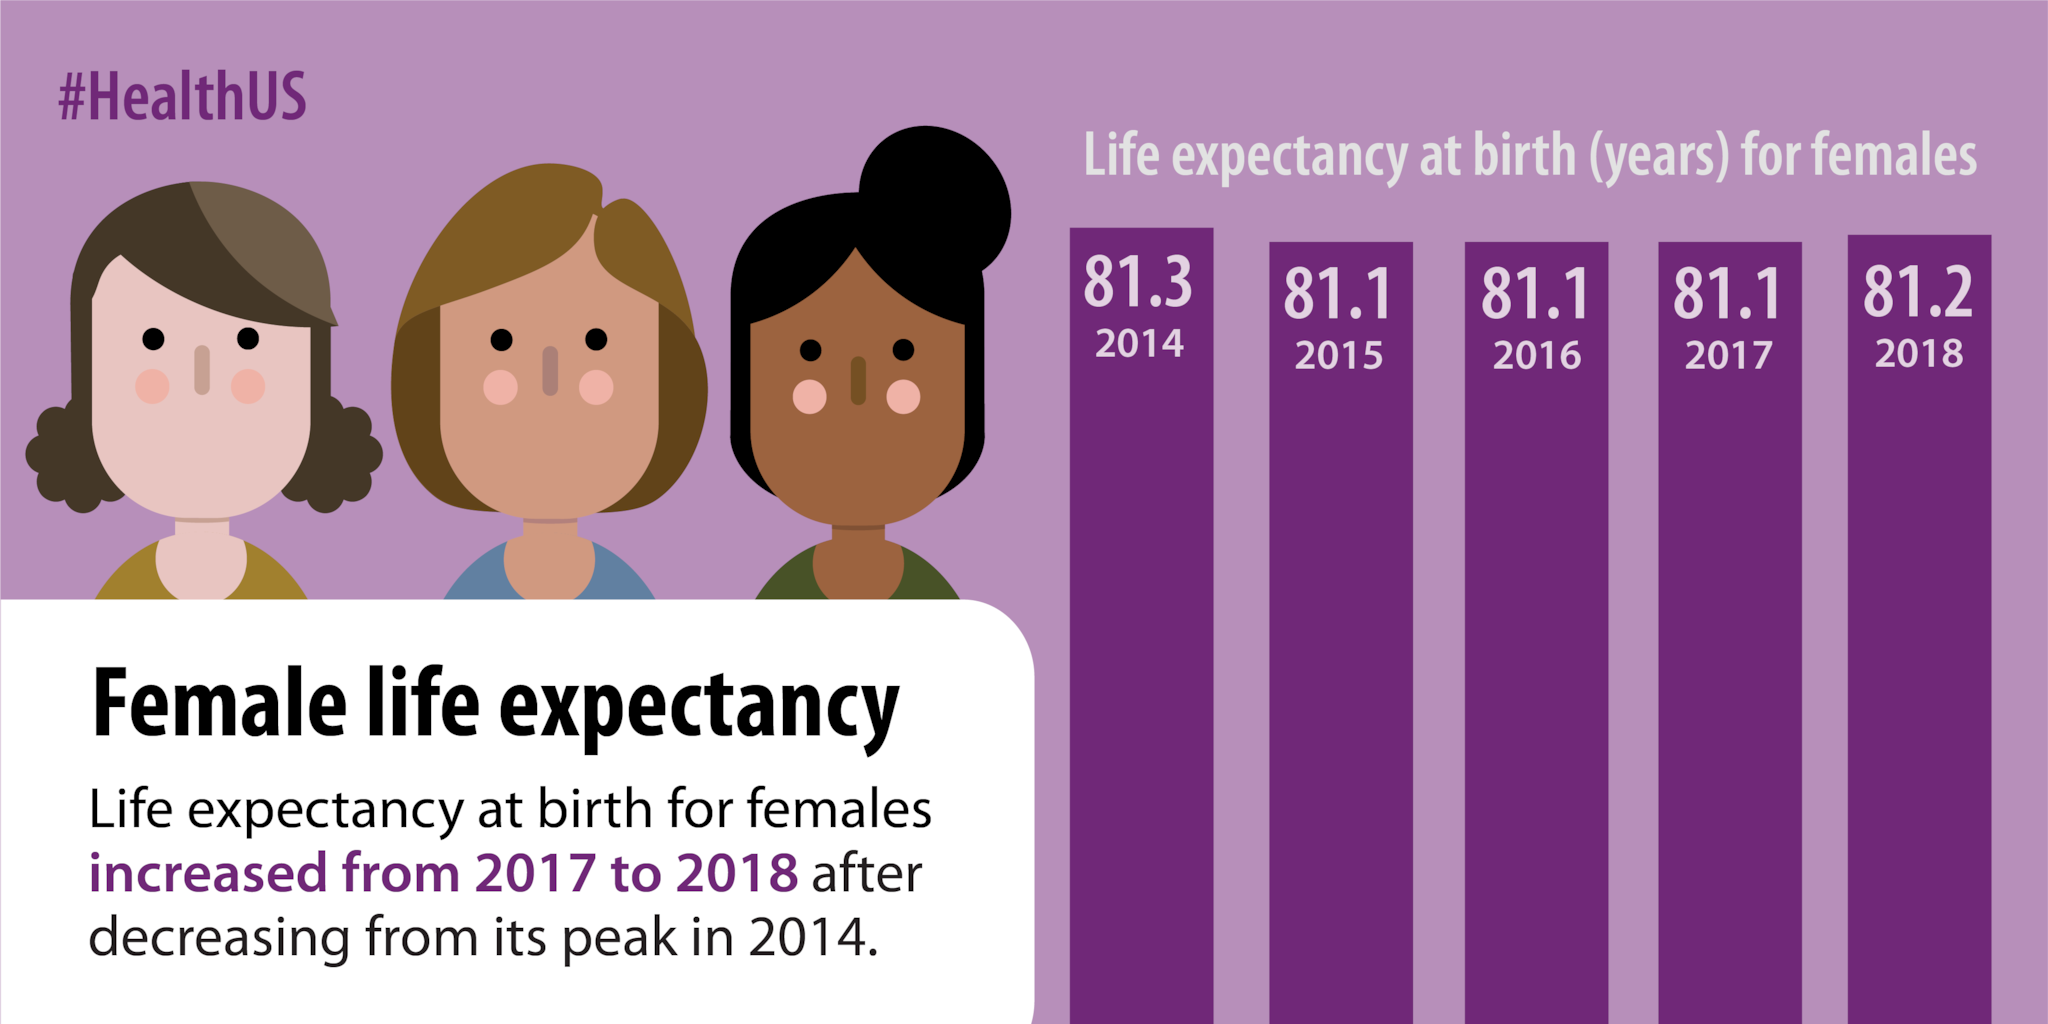
Life expectancy at birth for females increased from 2017 to 2018 after decreasing from its peak in 2014.
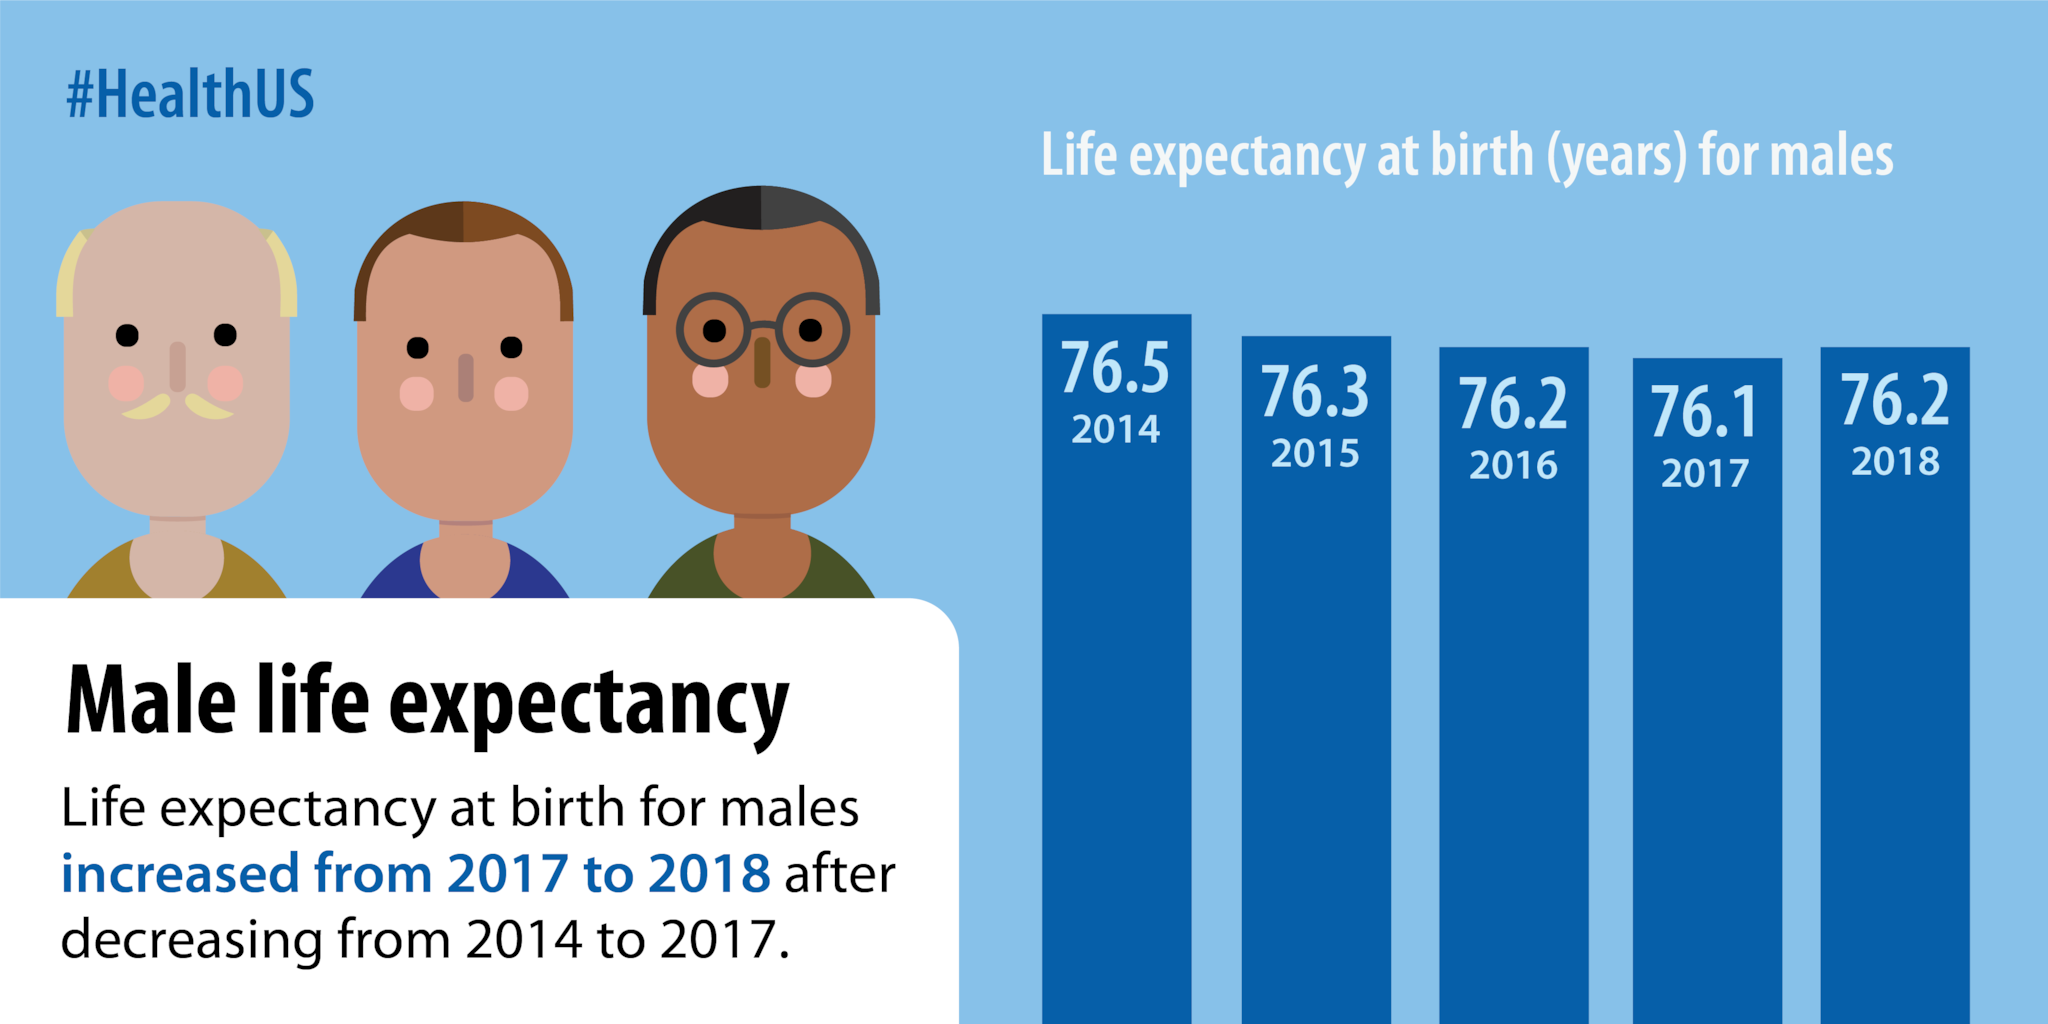
Life expectancy at birth for males increased from 2017 to 2018 after decreasing from 2014 to 2017.
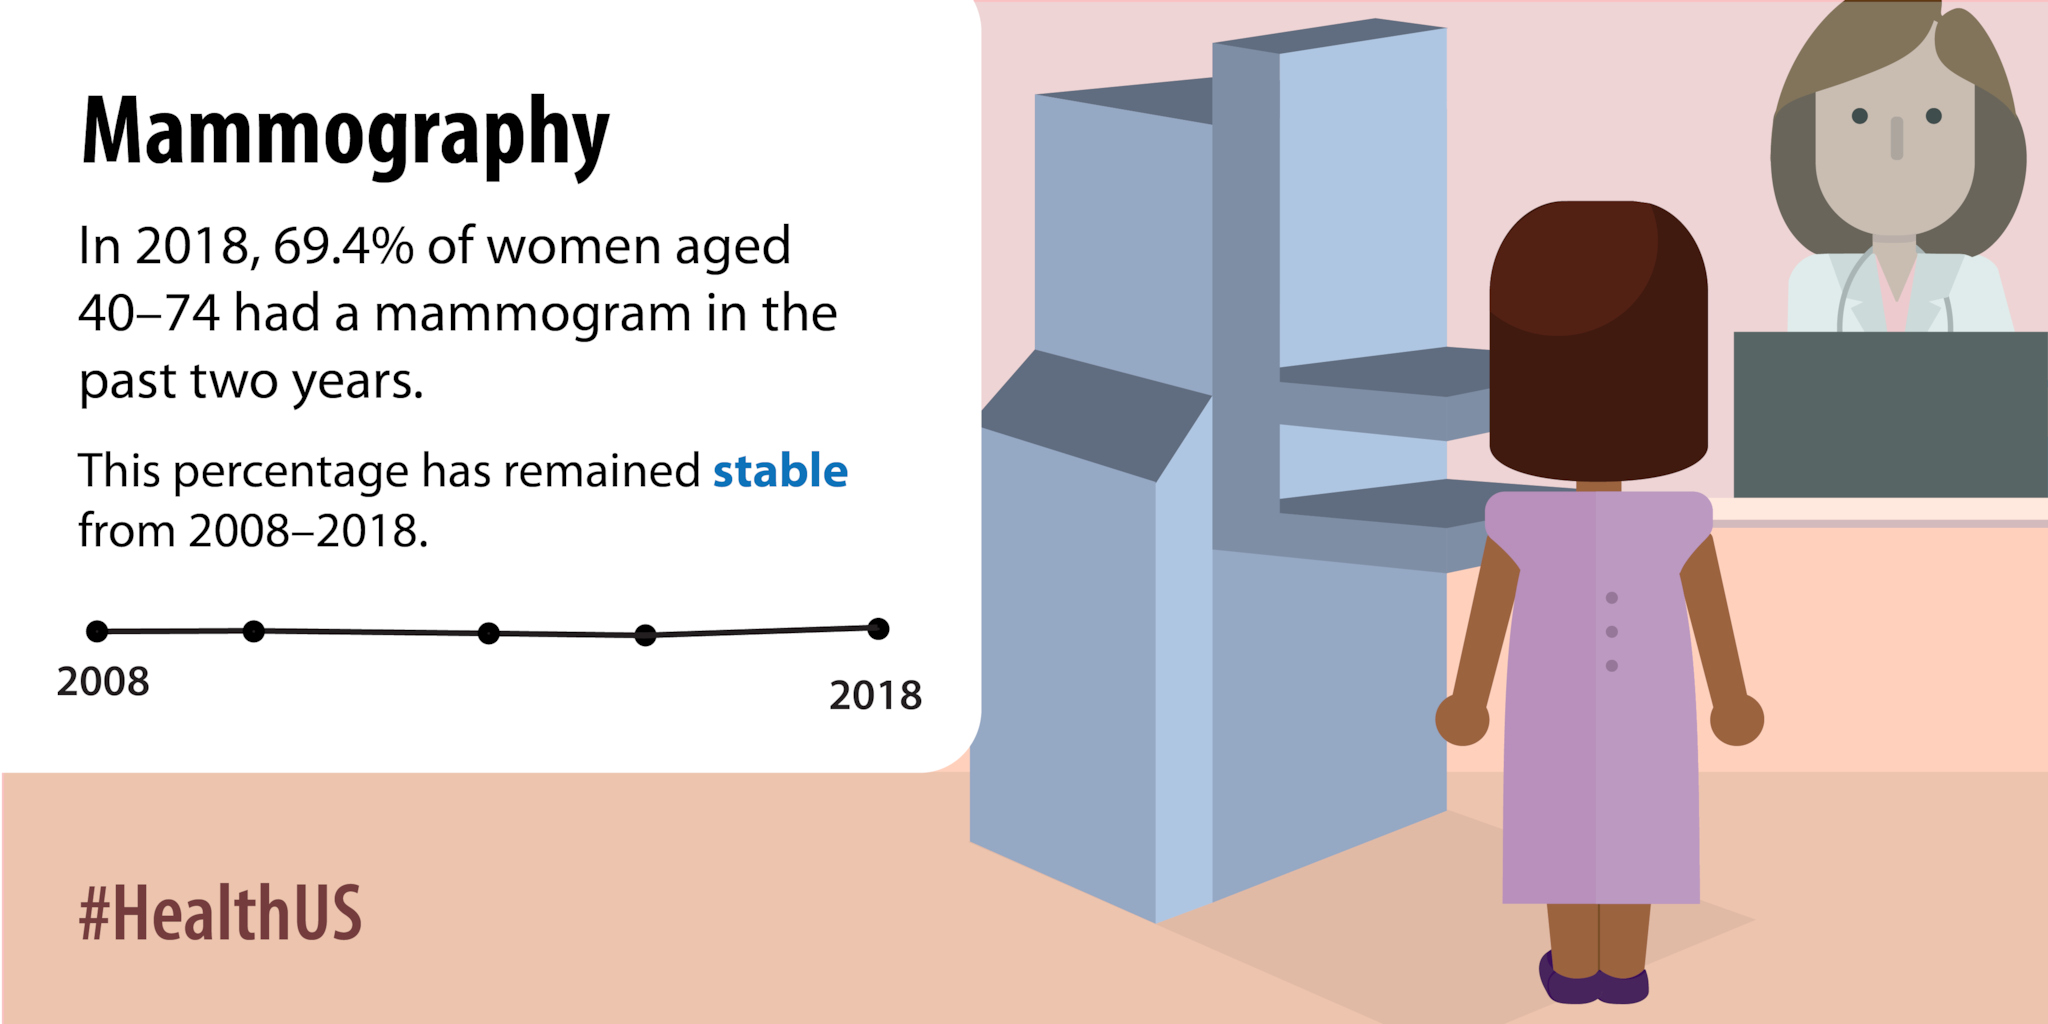
In 2018, 69.4% of women aged 40-74 had a mammogram in the past two years.
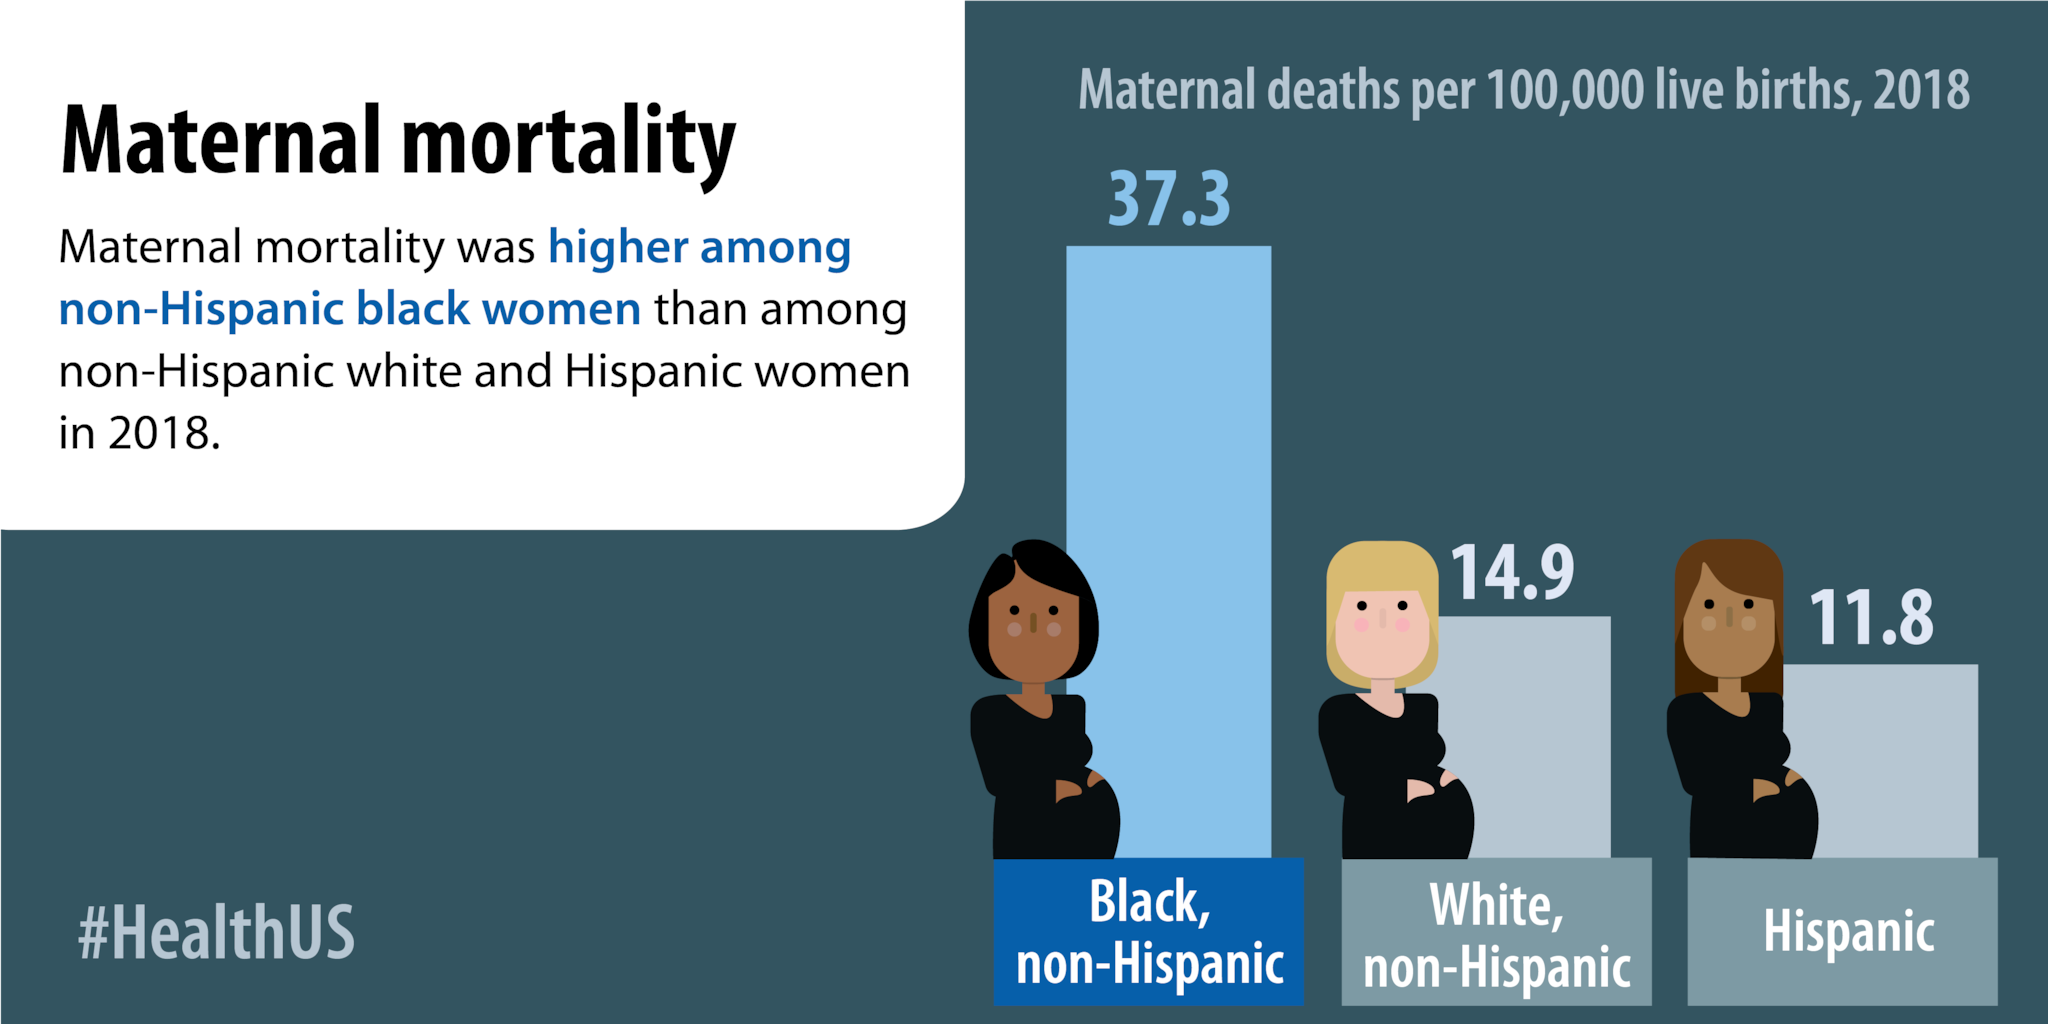
Maternal mortality was higher among non-Hispanic black women than among non-Hispanic white and Hispanic women in 2018.
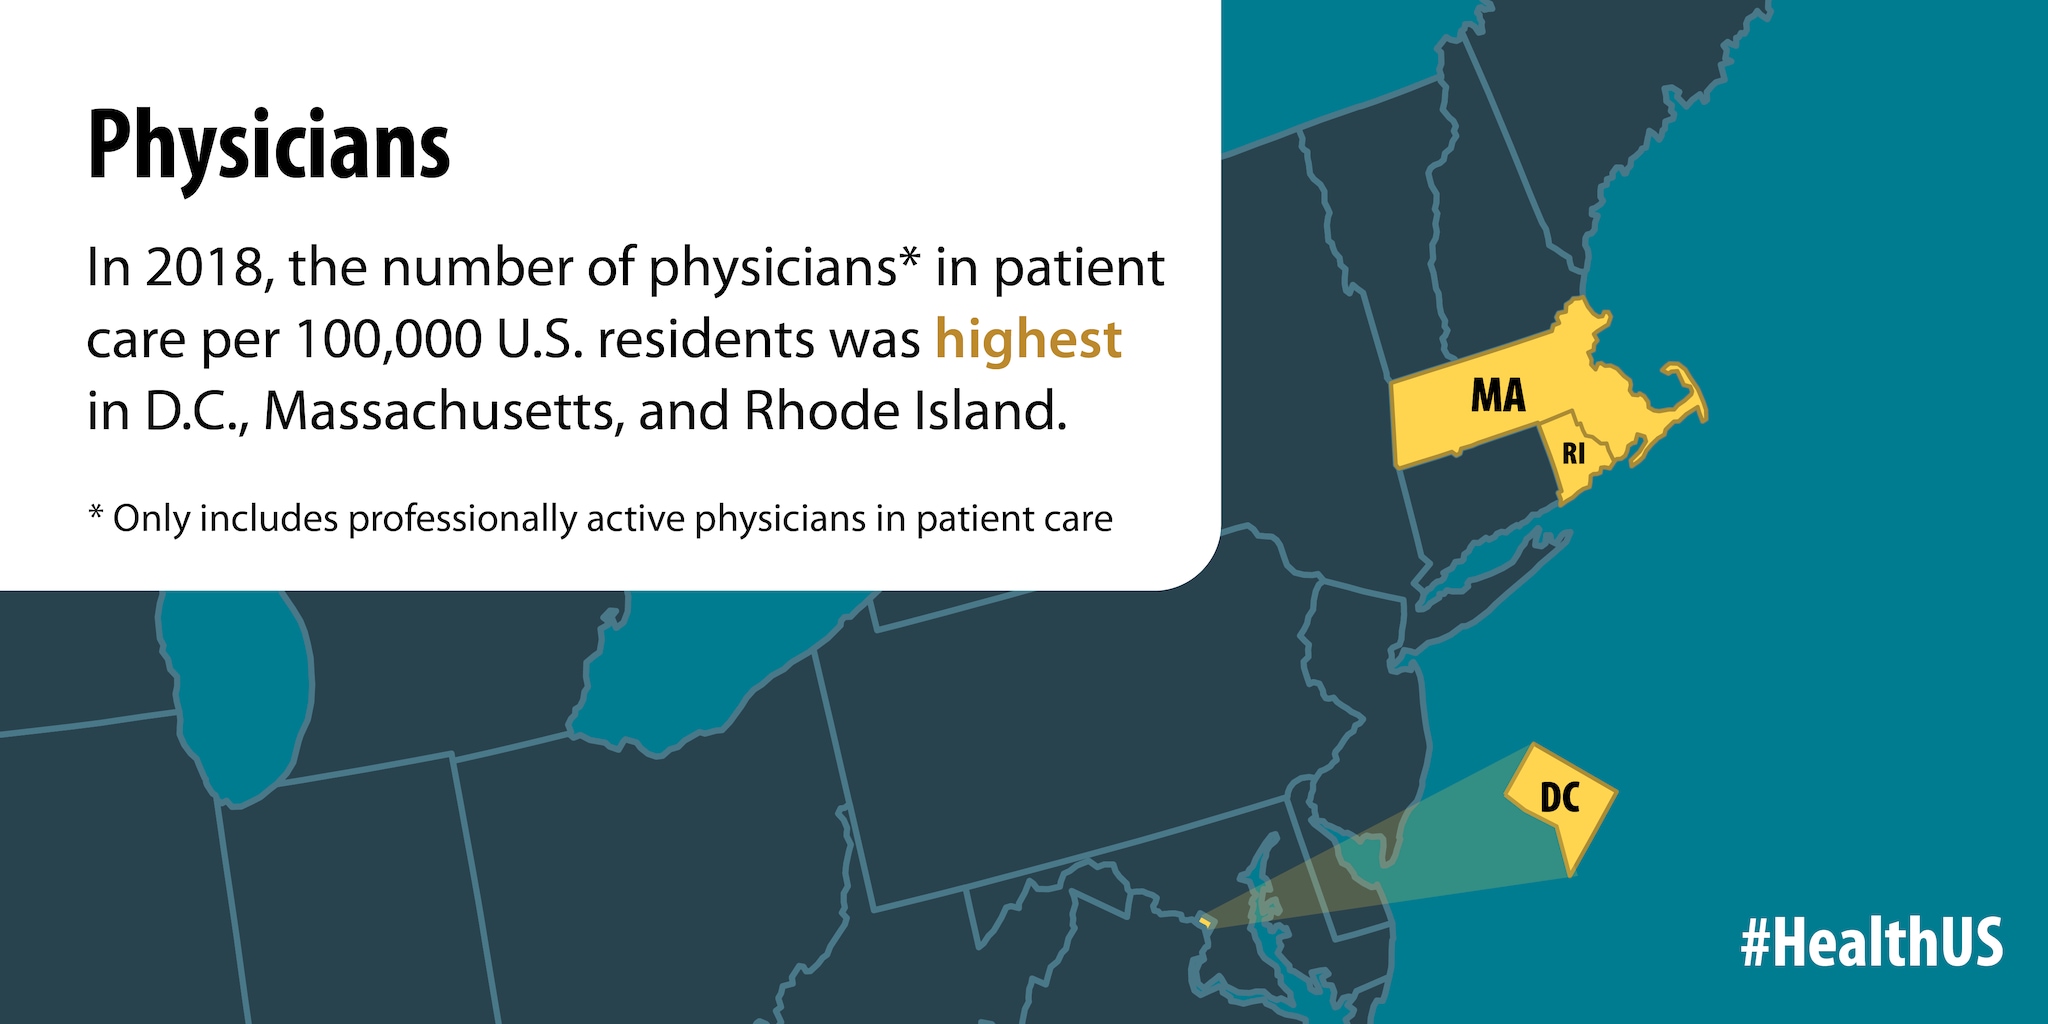
In 2018, the number of physicians in patient care per 100,000 U.S. residents was highest in D.C., Massachusetts, and Rhode Island.
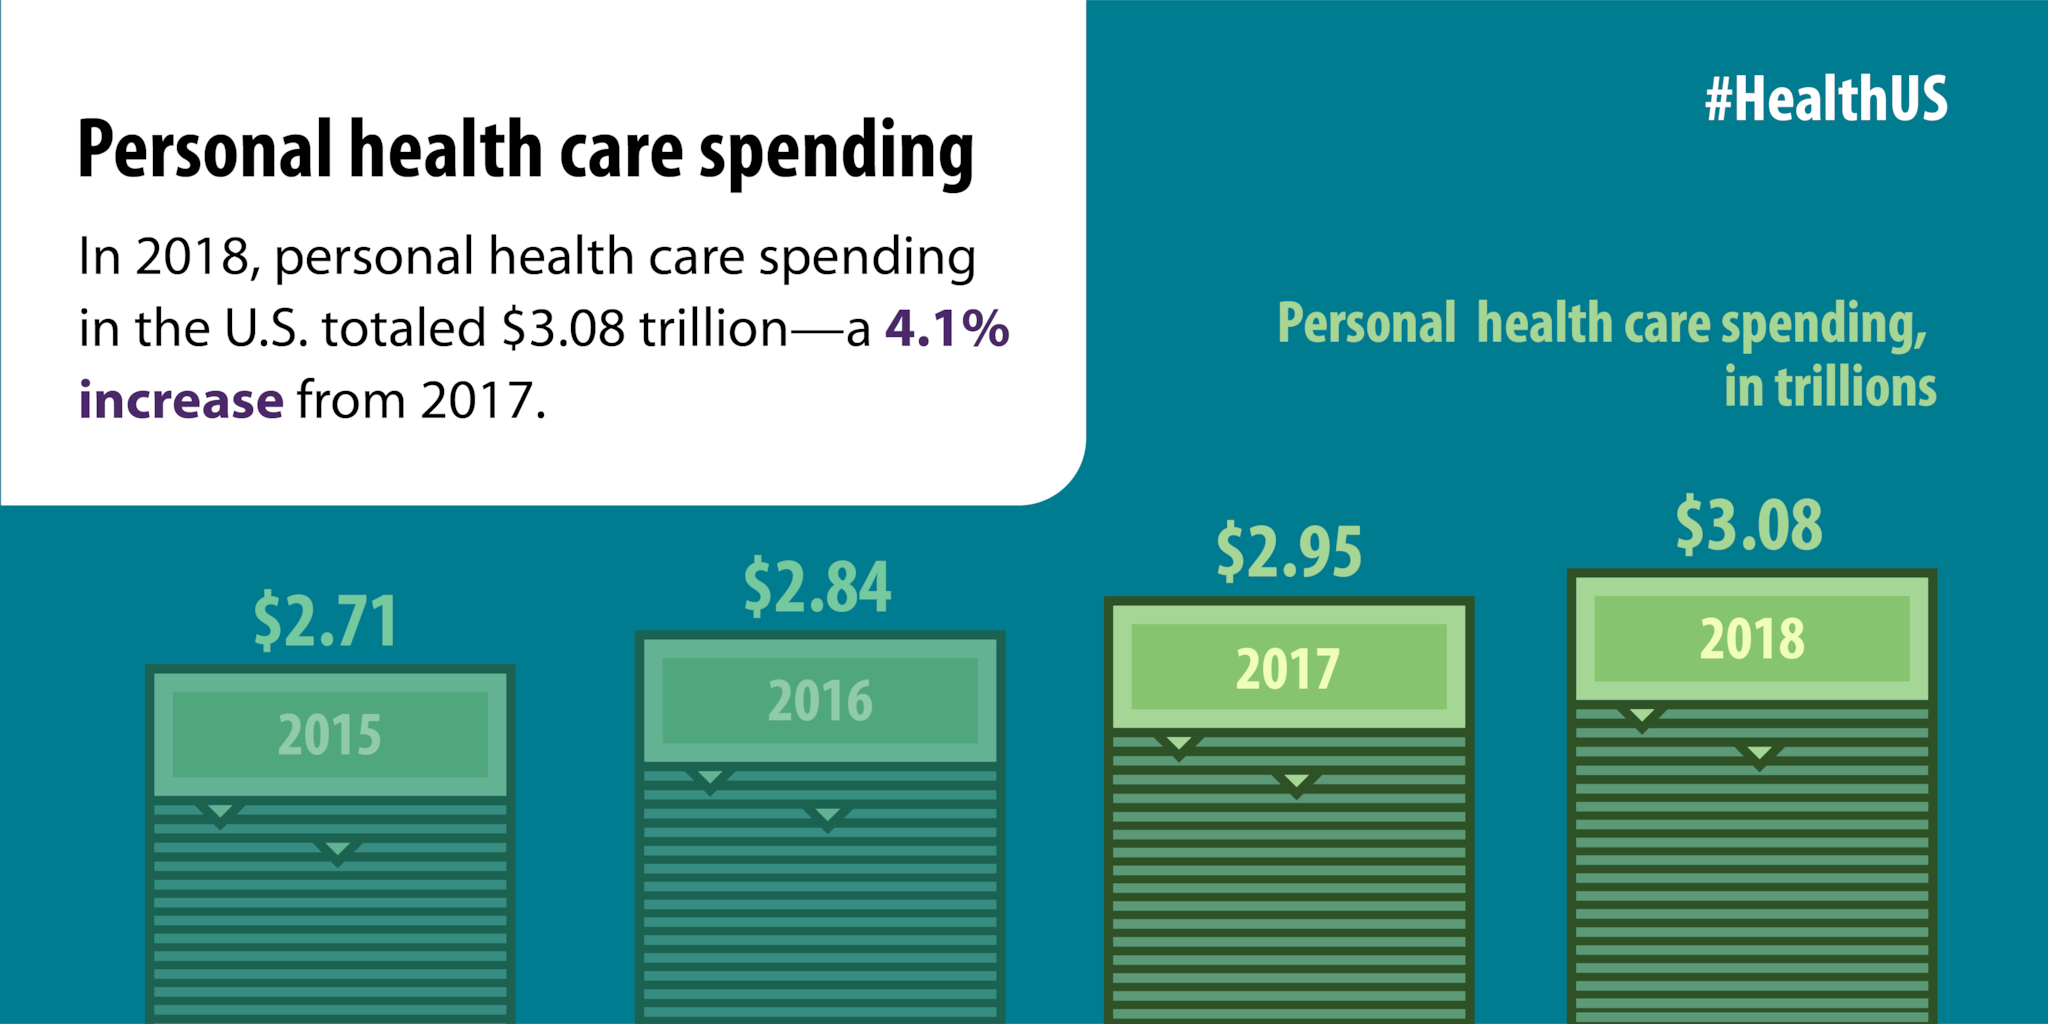
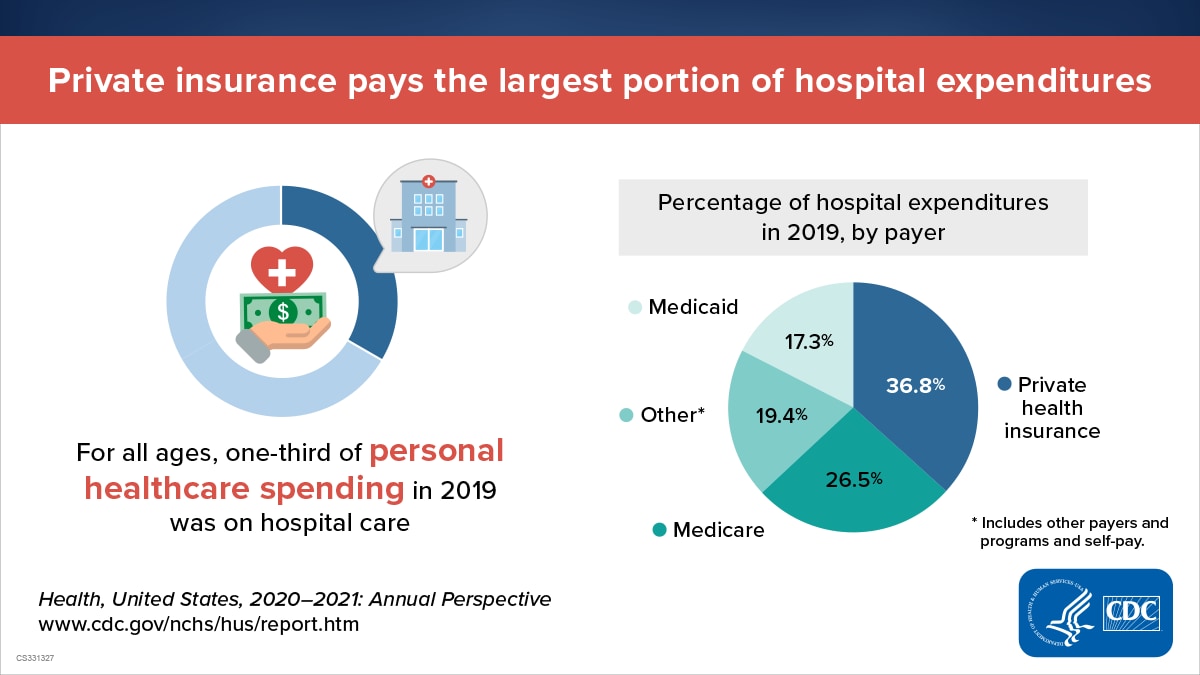
In 2018, personal health care spending in the U.S. totaled $3.08 trillion - a 4.1% increase from 2017.
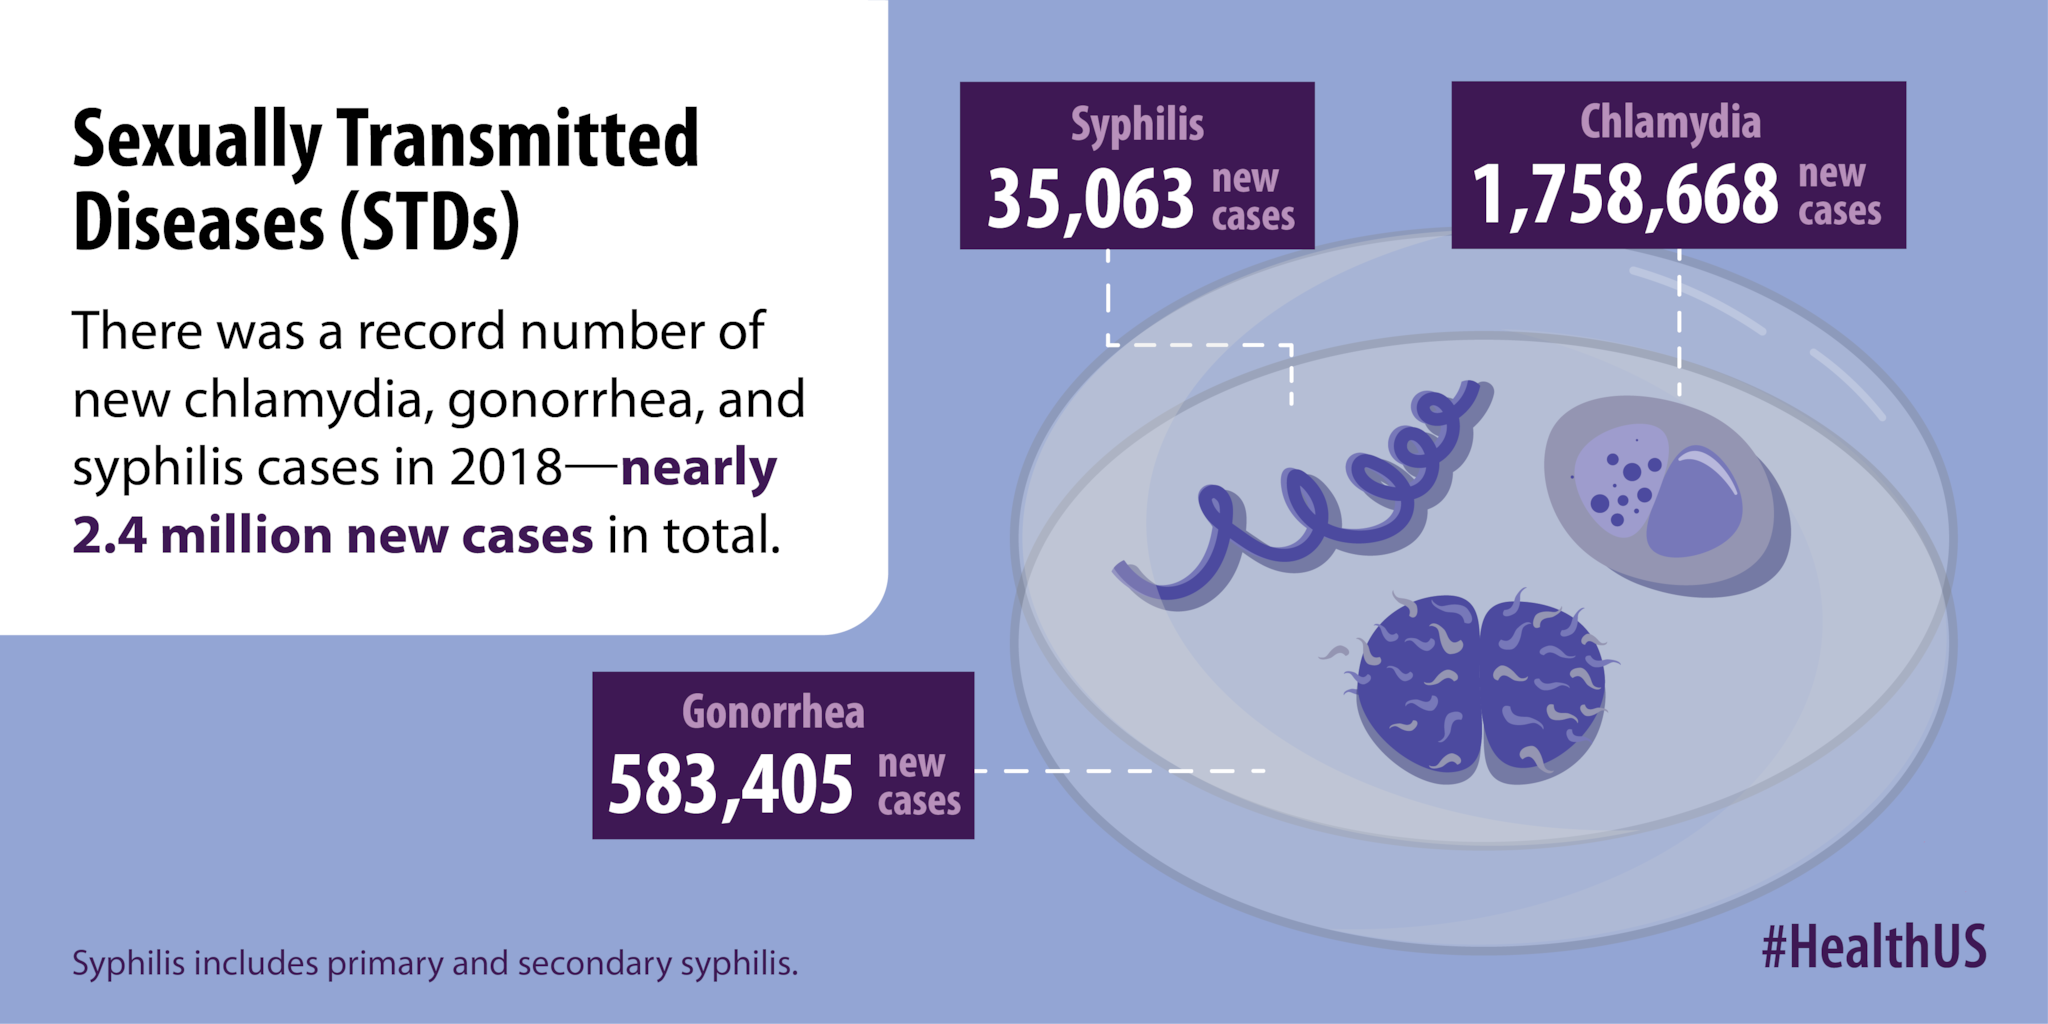
There was a record number of new chlamydia, gonorrhea, and syphilis cases in 2018 - nearly 2.4 million new cases in total.
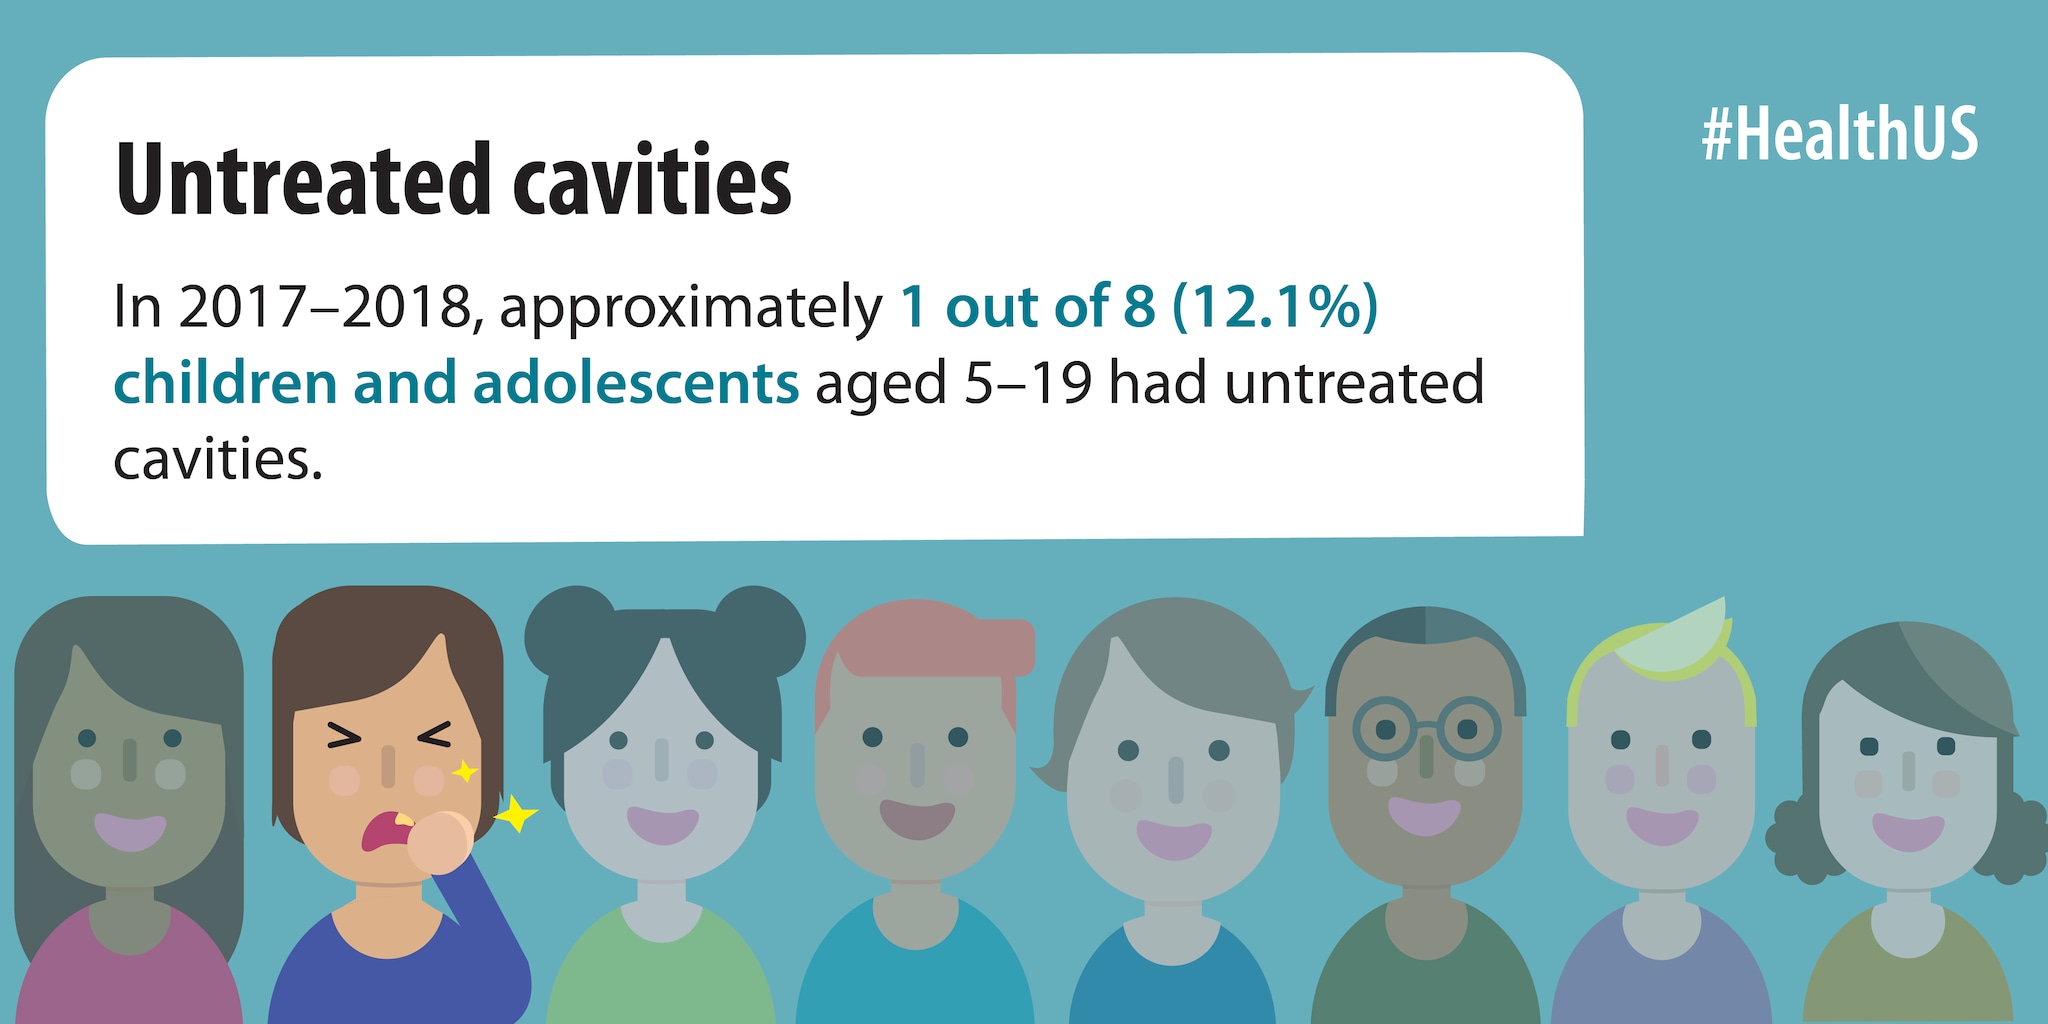
In 2017-2018, approximately 1 out of 8 (12.1%) children and adolescents aged 5-19 had untreated cavities.
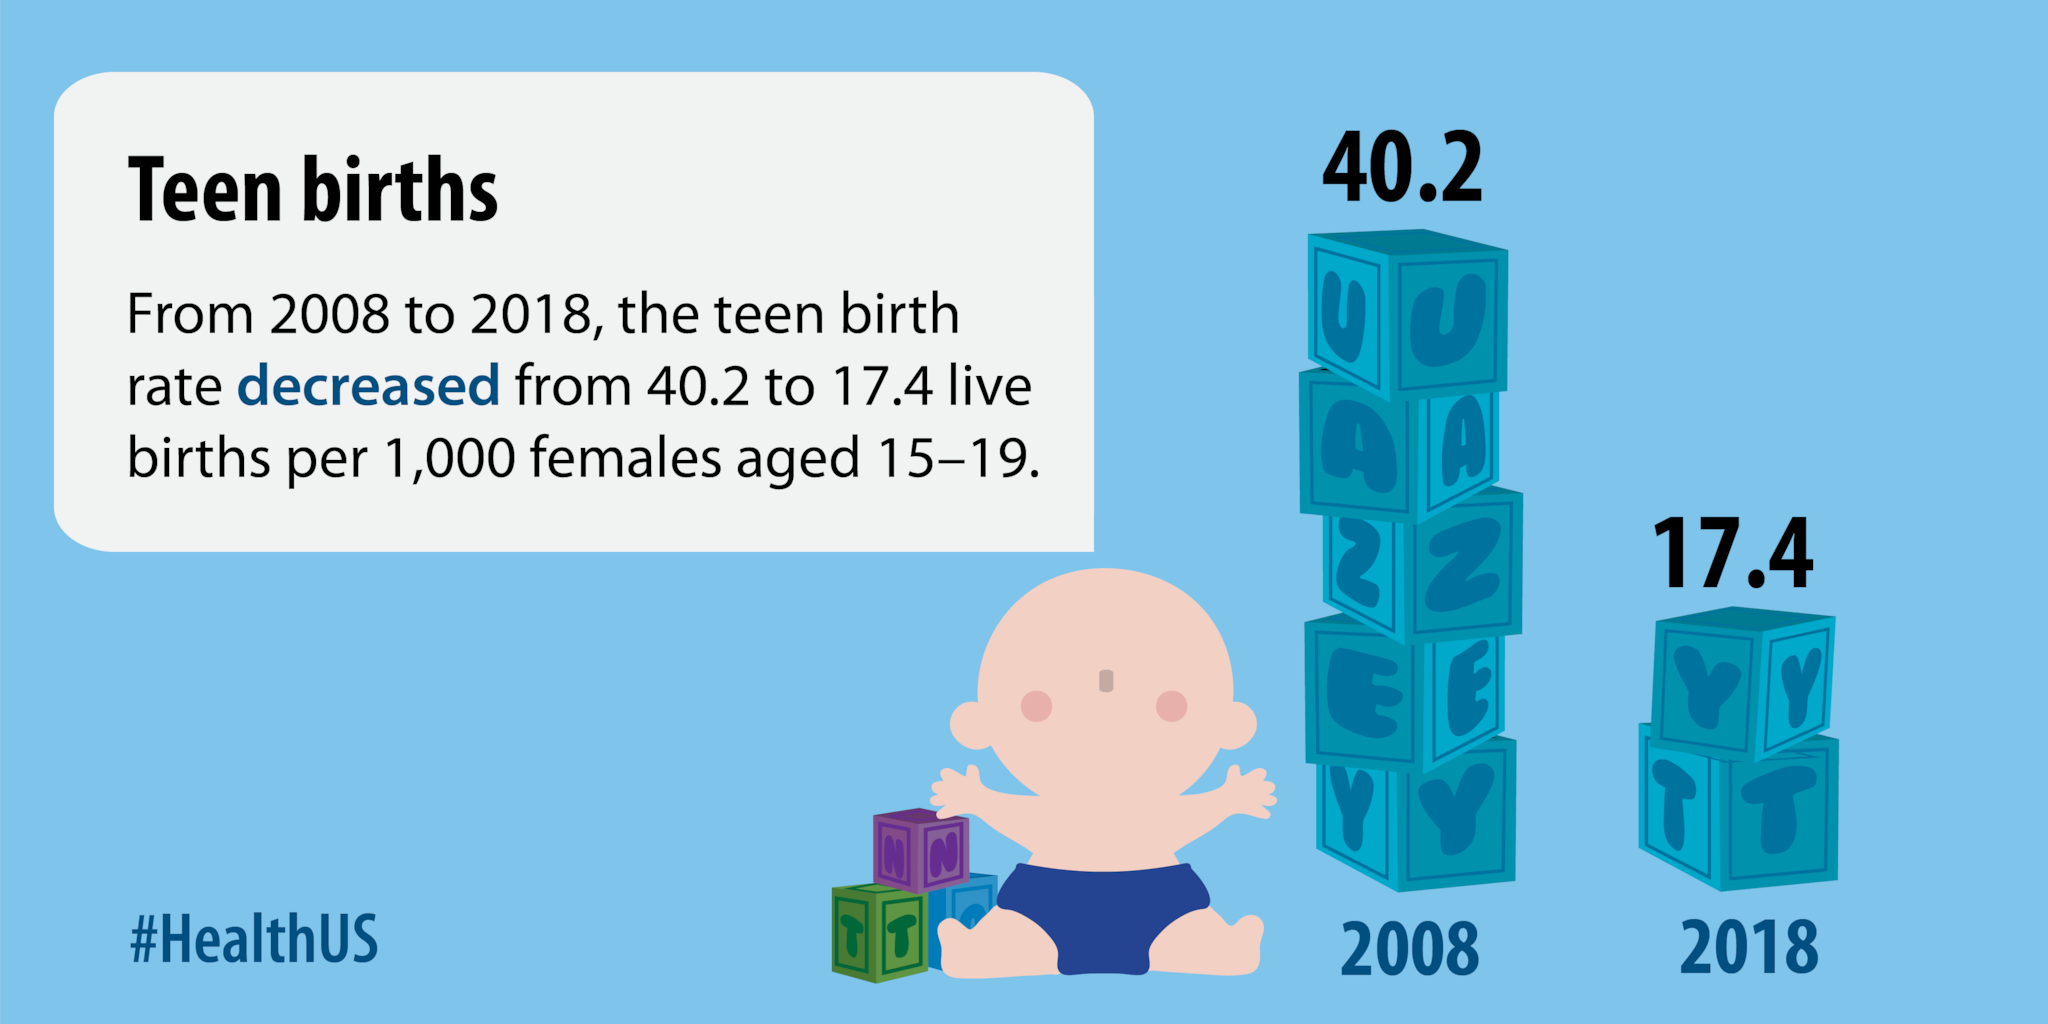
From 2008 to 2018, the teen birth rate decreased from 40.2 to 17.4 live births per 1,000 females aged 15-19.
Spotlight Infographics
The Health, United States Spotlight is an infographic series that explores topics of public health importance using data from the Health, United States annual report. Spotlights are published throughout the year and feature the most current data available at the time of publication. Consistent with the annual report, the Spotlight focuses on trends over time and features data from both NCHS and non-NCHS (government or private) sources. Health, United States data cover four subject areas: health status and determinants, utilization of health resources, health care resources, and health care expenditures and payers.

Includes data on heart disease deaths, respondent-reported heart disease prevalence, and four heart disease risk factors: hypertension, obesity, diabetes, and high total cholesterol


Includes data on access to needed care, supply of dentists, and flu vaccination coverage

Includes data on Medicaid coverage, Medicare managed care, and prescription drug spending

Includes data on causes of death, diabetes, substance use, and asthma & allergies

Includes data on cigarette smoking, nursing homes, emergency department visits, and health insurance coverage
Methodology
Where possible, changes over time and differences across groups are tested for statistical significance. Differences were assessed for statistical significance using statistical testing methods recommended by the individual data systems. Statistical significance is assessed at the 0.05 level without correction for multiple comparisons.
To describe differences across groups, terms such as “similar” and “no difference” are used to indicate that the estimates being compared were not found to be significantly different, while terms such as “higher” or “lower” indicate that a significant difference was detected. Lack of comment regarding the difference between estimates does not necessarily mean that differences were tested and found not to be significant.
To describe trends, terms such as “stable” and “no clear trend” are used to indicate that the slope of the segment was not statistically different from 0, while terms such as “increased” and “decreased” indicate that a significant slope was detected. Since the 2018 publication of the National Center for Health Statistics (NCHS) Guidelines for Analysis of Trends, the Health, United States infographics have adhered to these guidelines in order to analyze trends from NCHS complex sample surveys and the National Vital Statistics System.