NCHHSTP Workforce Fact Sheet Series

In 2021, NCHHSTP established its Equity Initiative to optimize synergies between the Center’s existing equity activities and help identify additional strategic opportunities to embed equity into the framework of NCHHSTP’s workplace operations and public health programs. Focus Area 2 of the Initiative is Workplace Policies and Procedures, with a goal to ensure fairness and equity in recruitment, hiring, career advancement, and other human resource policies and practices.
In support of this goal, the NCHHSTP Workforce Fact Sheet Series was developed to examine current NCHHSTP workforce data1, spotlight potential disparities, and guide action to ensure the Center’s workforce reflects diversity and equity by race, ethnicity, sexual orientation, gender identity, and ability.
This fact sheet series is composed of available information in human resource databases as well as aggregated, self-disclosed information collected from volunteer workforce surveys. Fact sheets will be updated as new data become available.
Using these data, NCHHSTP will establish new recruitment activities focused on:
- Increasing underrepresented populations in the applicant pool,
- Reducing any unconscious bias in the screening and interviewing process,
- Implementing a barrier analysis process to identify the root causes of disparities in our workforce diversity, and
- Removing any barriers that lead to disparities.
Diversity, equity, inclusion, and accessibility are central to the work of NCHHSTP, and everyone should feel welcome and encouraged to bring their whole self to work. Workforce data give NCHHSTP the tools necessary to advance workforce diversity programs, improve hiring practices, and ensure an inclusive workplace.
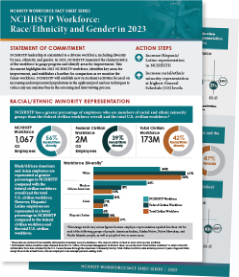
Race/Ethnicity and Gender in 2023
This fact sheet highlights the most recent race/ethnicity and gender (men/women) characteristics of NCHHSTP’s workforce. It also identifies key areas for improvement and establishes a baseline for comparison as we continue to improve race/ethnicity and gender parity in our workforce.
Fact sheet highlights:
- NCHHSTP has a greater percentage of racial and ethnic minority employees (56%) than the federal civilian workforce (39%) and the U.S. total civilian workforce (42%).
- Black/African American and Asian employees are represented at greater percentages (35% and 13%, respectively) in NCHHSTP compared with the federal civilian workforce2(18% and 7%, respectively) and the U.S. total civilian workforce3 (12% and 6%, respectively).
- Hispanic/Latino employees are represented at a lower percentage in NCHHSTP (6%) compared to the federal civilian workforce (10%) and the U.S. total civilian workforce (17%).
- American Indian, Alaska Native, Native Hawaiian, and Pacific Islander people, as well as people of two or more races, continue to represent less than 2% of the NCHHSTP, federal civilian, and total civilian workforces.
- NCHHSTP has a greater percentage of racial and ethnic minority employees in all general schedule (GS) levels compared with the federal civilian workforce (25%). NCHHSTP minority representation at the GS-15 level (40%) is above the minority representation within the federal civilian workforce (27%)
- NCHHSTP has a greater percentage of women employees (70%) than the federal civilian workforce (45%) and the U.S. total civilian workforce (47%).
- NCHHSTP has a greater percentage of female employees (70%) in all general schedule (GS) levels compared with the federal civilian workforce (45%). NCHHSTP female representation at the GS-15 level (63%) is above the female representation within the federal civilian workforce (42%).
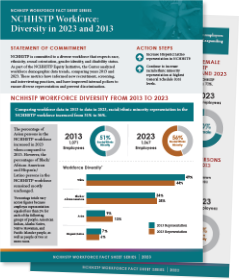
NCHHSTP Workforce: Diversity from 2013 to 2023
This fact sheet highlights NCHHSTP workforce demographic data trends, comparing the years 2013 and 2023. This data is informing NCHHSTP recruitment, screening, and interviewing practices. Other improvements include internal policies to ensure an increase in diverse representation and to prevent discrimination.
Fact sheet highlights:
- From 2013 to 2023, racial/ethnic minority representation in the NCHHSTP workforce increased from 51% to 56%.
- From 2013 to 2023, the percent of Black/African American persons in the NCHHSTP workforce increased from 34% to 35%.
- From 2013 to 2023, the percent of Asian persons in the NCHHSTP workforce increased from 9% to 13%.
- Hispanic/Latino representation at NCHHSTP remains low and decreased from 7% to 6% from 2013 to 2023 .
- From 2013 to 2023, representation of women employees increased from 66% to 70%.
- From 2013 to 2023, representation of persons with a known disability increased from 11% to 18%.
- From 2013 to 2023, racial/ethnic minority representation increased across general schedule (GS) levels 11-15.
- Racial/ethnic minority representation in GS 15 almost doubled from 21% to 40%
- From 2013 to 2023, racial/ethnic minority representation increased in both scientific and nonscientific job series – a 9% and 5% increase respectively.
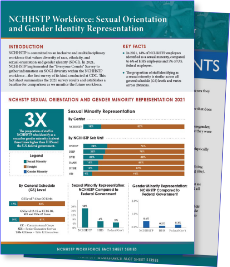
Sexual Orientation and Gender Identity Representation
NCHHSTP is committed to meeting the needs of lesbian, gay, bisexual, transgender, and queer or questioning (LGBTQ+) employees. Sexual orientation and gender identity (SOGI) data are essential for informing supportive workforce policies and practices.
In 2021, NCHHSTP implemented the “Everyone Counts” Survey to gather information on SOGI diversity within the NCHHSTP workforce—the first survey of its kind conducted at CDC. This fact sheet summarizes the results of this voluntary and anonymous survey and establishes a baseline for comparison as we monitor the future workforce.
Fact sheet highlights:
- The proportion of staff in NCHHSTP who identify as a sexual or gender minority is about three times higher than HHS and the U.S. federal government.
- In 2021, 18% of NCHHSTP employees identified as a sexual minority, compared to 6% of HHS employees and 5% of U.S. federal employees.
- The proportion of staff identifying as a sexual minority is similar across all general schedule (GS) levels and varies across divisions.
- In 2021, 19% of staff in the highest levels of NCHHSTP leadership (GS 13-15 positions, Commissioned Corps of the U.S. Public Health Service, Senior Executive Service, and Title 42 executives) identified as a sexual minority.
- NCHHSTP workforce data for the Race/Ethnicity and Gender in 2023 and Diversity in 2023 and 2013 only includes information on full-time employees. It does not include contract staff, Senior Executive Service, or Commission Corps of the U.S. Public Health Service.
- Federal civilian workforce data for the Race/Ethnicity and Gender in 2023 and Diversity in 2023 and 2013 fact sheetswere obtained from the U.S. Office of Personnel Management.
- NCHHSTP workforce data for the Sexual Orientation and Gender Identity Representation fact sheet includes information from full-time employees, Senior Executive Service, or Commission Corps of the U.S. Public Health Service. It does not include contract staff.
- The term, “total civilian workforce,” refers to civilian labor force data obtained by the U.S. Census Bureau through the American Community Survey. Total civilian workforce data includes persons 16 years of age and older, except those in the armed forces, who are employed or are unemployed and seeking work.