Health Insurance Coverage
‹View Table of Contents
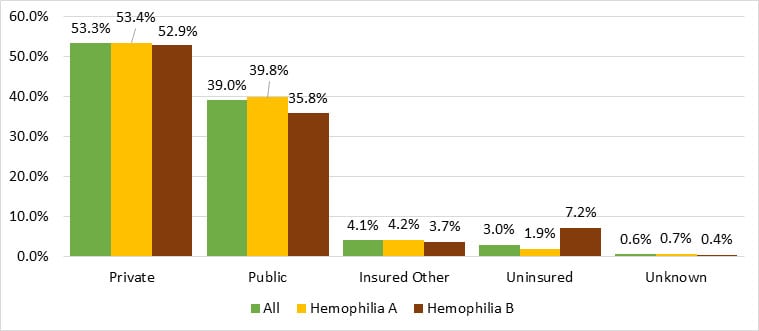
The majority of male Registry participants with hemophilia had private insurance (53% for both hemophilia A and B). Thirty-nine percent of males had public insurance (40% hemophilia A; 36% hemophilia B). Additionally, 4% of males with hemophilia A or B were covered by some other form of health insurance and 3% were uninsured (2% hemophilia A; 7% hemophilia B) (Figure 8). Private insurance includes commercial insurance and military insurance. Public insurance includes Medicaid, Medicare, state programs, and Indian Health Services.
Figure 8. Distribution of male Registry participants with hemophilia, by insurance and hemophilia type

| All | Hemophilia A | Hemophilia B | ||||
|---|---|---|---|---|---|---|
| Private | 4,890 | 53.3% | 3,886 | 53.4% | 1,004 | 52.9% |
| Public | 3,576 | 39.0% | 2,897 | 39.8% | 679 | 35.8% |
| Insured Other | 378 | 4.1% | 308 | 4.2% | 70 | 3.7% |
| Uninsured | 275 | 3.0% | 138 | 1.9% | 137 | 7.2% |
| Unknown | 54 | 0.6% | 47 | 0.7% | 7 | 0.4% |
Health Insurance Coverage by Age
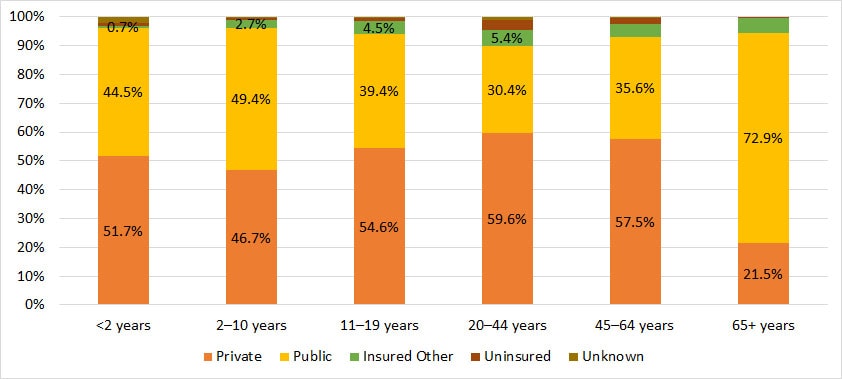
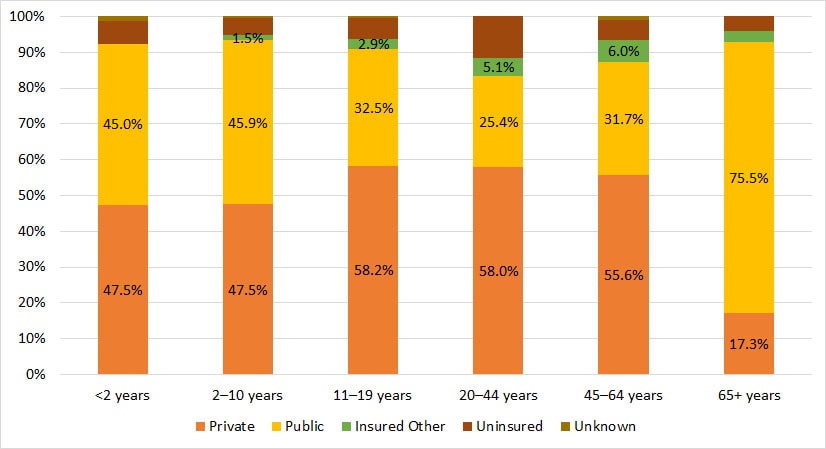
Both private and public health insurance are utilized as the primary form of insurance among male hemophilia participants in the Registry < 2 years of age (52% and 45%, respectively, for hemophilia A and 48% and 45%, respectively, for hemophilia B) and 2–10 years of age (47% and 49%, respectively, for hemophilia A and 48% and 46%, respectively, for hemophilia B). More than 55% of male Registry participants (both hemophilia A and B) between 11 and 64 years of age were using private insurance. In contrast, among Registry participants 65 years of age or older, 73% of hemophilia A participants and 76% of hemophilia B participants were using public insurance (Figures 9 and 10).
Figure 9. Distribution of male Registry participants with hemophilia A, by primary insurance and age group

| Private | Public | Insured Other | Uninsured | Unknown | ||||||
|---|---|---|---|---|---|---|---|---|---|---|
| <2 years | 150 | 51.7% | 129 | 44.5% | * | * | * | * | 6 | 2.1% |
| 2–10 years | 814 | 46.7% | 862 | 49.4% | 47 | 2.7% | 11 | 0.6% | 10 | 0.6% |
| 11–19 years | 961 | 54.6% | 694 | 39.4% | 80 | 4.5% | 19 | 1.1% | 6 | 0.4% |
| 20–44 years | 1402 | 59.6% | 716 | 30.4% | 128 | 5.4% | 85 | 3.6% | 21 | 1.0% |
| 45–64 years | 505 | 57.5% | 313 | 35.6% | 38 | 4.3% | * | * | * | * |
| 65+ years | 54 | 21.5% | 183 | 72.9% | * | * | * | * | * | * |
* Counts less than six have been suppressed to protect patient confidentiality
Figure 10. Distribution of male Registry participants with hemophilia B, by primary insurance and age group

| Private | Public | Insured Other | Uninsured | Unknown | ||||||
|---|---|---|---|---|---|---|---|---|---|---|
| <2 years | 38 | 47.5% | 36 | 45.0% | * | * | * | * | * | * |
| 2–10 years | 187 | 47.5% | 181 | 45.9% | 6 | 1.5% | * | * | * | * |
| 11–19 years | 258 | 58.2% | 144 | 32.5% | 13 | 2.9% | * | * | * | * |
| 20–44 years | 329 | 58.0% | 144 | 25.4% | 29 | 5.1% | * | * | * | * |
| 45–64 years | 175 | 55.6% | 100 | 31.7% | 19 | 6.0% | * | * | * | * |
| 65+ years | 17 | 17.3% | 74 | 75.5% | * | * | * | * | * | * |
* Counts less than six have been suppressed to protect patient confidentiality
Pages in this Report
- Highlights & Acknowledgements
- Background
- Methods
- Geographic Distribution of Registry Participants
- Diagnosis & Severity
- Registry Characteristics
- Age
- Race/Ethnicity
- Education
- Weight Status
- ›Health Insurance Coverage
- Viral and Vaccination History
- Healthcare Utilization and Absenteeism
- Family History and Genetic Mutation
- Complications
- Treatment
- Procedures and Comorbid Conditions
- Technical Notes
- Participating HTCs