Volume 30, Number 1—January 2024
Research
Predictive Mapping of Antimicrobial Resistance for Escherichia coli, Salmonella, and Campylobacter in Food-Producing Animals, Europe, 2000–2021
Ranya Mulchandani, Cheng Zhao, Katie Tiseo, João Pires, and Thomas P. Van Boeckel
Figure 3
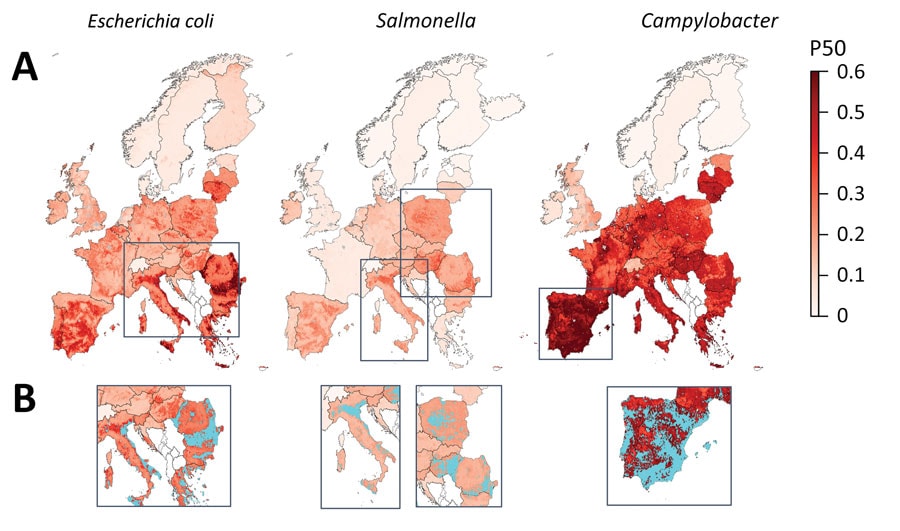
Figure 3. Mapping of predicted P50s and hotspot areas for antimicrobial resistance of Escherichia coli, Salmonella, and Campylobacter, Europe. A) Predicted proportions of antimicrobials with P50 at 10 × 10 km resolution per bacteria. B) Antimicrobial resistance hotspots (light blue) in eastern Europe, Italy, and Spain. Cutoffs: E. coli, 0.43; Salmonella, 0.23; Campylobacter, 0.6 (95% percentile). P50, >50% antimicrobial resistance.
Page created: November 24, 2023
Page updated: December 20, 2023
Page reviewed: December 20, 2023
The conclusions, findings, and opinions expressed by authors contributing to this journal do not necessarily reflect the official position of the U.S. Department of Health and Human Services, the Public Health Service, the Centers for Disease Control and Prevention, or the authors' affiliated institutions. Use of trade names is for identification only and does not imply endorsement by any of the groups named above.