Skip directly to site content Skip directly to page options Skip directly to A-Z link Skip directly to A-Z link Skip directly to A-Z link
Volume 29, Number 10—October 2023
Dispatch

Seafood-Associated Outbreak of ctx-Negative Vibrio mimicus Causing Cholera-Like Illness, Florida, USA

Meer T. Alam1, Sarah R. Stern1, Devin Frison, Katie Taylor, Massimiliano S. Tagliamonte, S. Sakib Nazmus, Taylor Paisie, Nicole B. Hilliard, Riley G. Jones, Nicole M. Iovine, Kartik Cherabuddi, Carla Mavian, Paul Myers, Marco Salemi, Afsar Ali2, and J. Glenn Morris2Comments to Author 
Author affiliations: University of Florida Emerging Pathogens Institute, Gainesville, Florida, USA (M.T. Alam, M.S. Tagliamonte, S.N. Sakib, T. Paisie, C. Mavian, M. Salemi, A. Ali, J.G Morris, Jr.); University of Florida College of Public Health and Health Professions, Gainesville (M.T. Alam, S.S. Nazmus, A. Ali); University of Florida College of Medicine, Gainesville (S.R. Stern, K. Taylor, M.S. Tagliamonte, T. Paisie, R.G. Jones, N.M. Iovine, K. Cherabuddi, C. Mavian, M. Salemi, J.G. Morris, Jr.); Florida Department of Health in Alachua County, Gainesville (D. Frison, P. Myers); University of Florida Health and Shands Hospital, Gainesville (N.B. Hilliard, N.M. Iovine, K. Cherabuddi)

Main Article

Figure

Maximum-likelihood tree of Vibrio mimicus strains. The tree was calculated by using 35 sequences; the best evolutionary model was selected by Bayesian information criterion. Nodes marked by a gray circle have bootstrap support (1,000 replicates) >90%. Scale bar represents the number of substitutions per site. The phylogenetic signal of the alignment was determined by likelihood mapping, as shown by the triangle in the top right corner. Likelihood mapping method is based on the analysis of maximum likelihoods for quartets of sequences randomly extracted from the alignment. There are only 3 possible fully resolved tree topologies deriving from 4 sequences (e.g., with 4 sequences named A,B,C, and D, sequence A can cluster with B and C with D; or A with C and D with B; or A with D and B with C); alternatively, if there is not enough information in the sequences, the result will be a star-like topology. The likelihoods of the 3 possible topologies are represented as 1 point in an equilateral triangle, in which each vertex represents 1 of the possible topologies. The triangle is partitioned in 7 regions: the region in the center represents completely unresolved quartets with star-like evolution topology; the 3 regions in the corners represent well-resolved topologies; the regions along the sides represent the situation in which it is difficult to decide between 2 of the 3 possible topologies. Percentages in the triangle reflect the number of quartets assigned to each region. A higher sum of the percentages in the triangle corners (completely resolved quartets) indicates a higher phylogenetic signal contained in the alignment. The alignment signal of >99% therefore shows a strong phylogenetic signal, which enables reliable calculation of the tree.

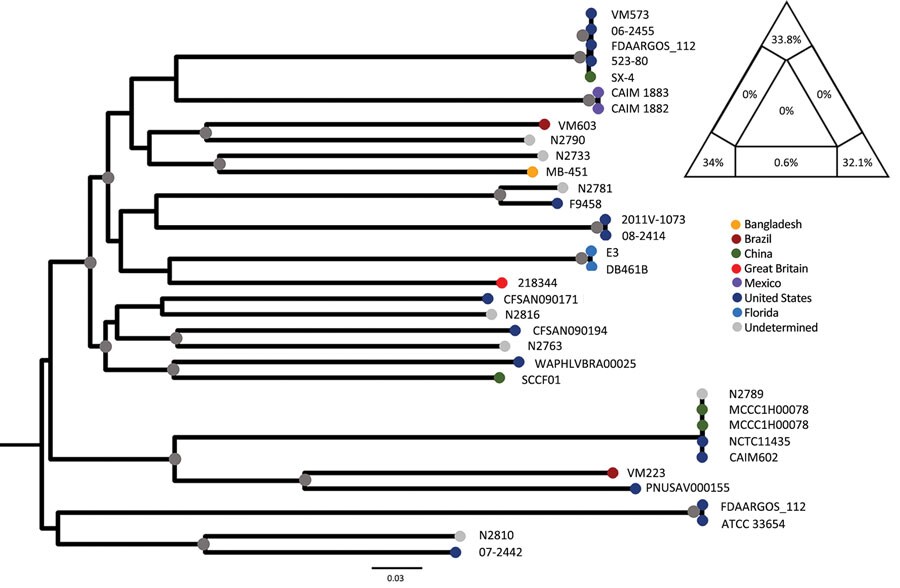
Figure. Maximum-likelihood tree of Vibrio mimicus strains. The tree was calculated by using 35 sequences; the best evolutionary model was selected by Bayesian information criterion. Nodes marked by a gray circle have bootstrap support (1,000 replicates) >90%. Scale bar represents the number of substitutions per site. The phylogenetic signal of the alignment was determined by likelihood mapping, as shown by the triangle in the top right corner. Likelihood mapping method is based on the analysis of maximum likelihoods for quartets of sequences randomly extracted from the alignment. There are only 3 possible fully resolved tree topologies deriving from 4 sequences (e.g., with 4 sequences named A,B,C, and D, sequence A can cluster with B and C with D; or A with C and D with B; or A with D and B with C); alternatively, if there is not enough information in the sequences, the result will be a star-like topology. The likelihoods of the 3 possible topologies are represented as 1 point in an equilateral triangle, in which each vertex represents 1 of the possible topologies. The triangle is partitioned in 7 regions: the region in the center represents completely unresolved quartets with star-like evolution topology; the 3 regions in the corners represent well-resolved topologies; the regions along the sides represent the situation in which it is difficult to decide between 2 of the 3 possible topologies. Percentages in the triangle reflect the number of quartets assigned to each region. A higher sum of the percentages in the triangle corners (completely resolved quartets) indicates a higher phylogenetic signal contained in the alignment. The alignment signal of >99% therefore shows a strong phylogenetic signal, which enables reliable calculation of the tree.

Main Article

1These first authors contributed equally to this article.

2These senior authors contributed equally to this article.

Page created: August 16, 2023
Page updated: September 20, 2023
Page reviewed: September 20, 2023
The conclusions, findings, and opinions expressed by authors contributing to this journal do not necessarily reflect the official position of the U.S. Department of Health and Human Services, the Public Health Service, the Centers for Disease Control and Prevention, or the authors' affiliated institutions. Use of trade names is for identification only and does not imply endorsement by any of the groups named above.
file_external