Plasmodium falciparum pfhrp2 and pfhrp3 Gene Deletions from Persons with Symptomatic Malaria Infection in Ethiopia, Kenya, Madagascar, and Rwanda
Eric Rogier

, Jessica N. McCaffery, Doug Nace, Samaly Souza Svigel, Ashenafi Assefa, Jimee Hwang, Simon Kariuki, Aaron M. Samuels, Nelli Westercamp, Arsène Ratsimbasoa, Milijaona Randrianarivelojosia, Aline Uwimana, Venkatachalam Udhayakumar, and Eric S. Halsey
Author affiliations: Centers for Disease Control and Prevention, Atlanta, Georgia, USA (E. Rogier, J.N. McCaffery, D. Nace, S.S. Svigel, A.M. Samuels, N. Westercamp, V. Udhayakumar); Ethiopia Public Health Institute, Addis Ababa, Ethiopia (A. Assefa); Centers for Disease Control and Prevention, Atlanta, Georgia, USA (J. Hwang, E.S. Halsey); Centre for Global Health Research, Kenya Medical Research Institute, Kisumu, Kenya (S. Kariuki); Centers for Disease Control and Prevention, Kisumu (A.M. Samuels); Madagascar National Malaria Control Program, Antananarivo, Madagascar (A. Ratsimbasoa); Institut Pasteur de Madagascar, Antananarivo (M. Randrianarivelojosia); Université de Toliara, Toliara, Madagascar (M. Randrianarivelojosia); Rwanda Biomedical Center, Kigali, Rwanda (A. Uwimana)
Main Article
Figure 3
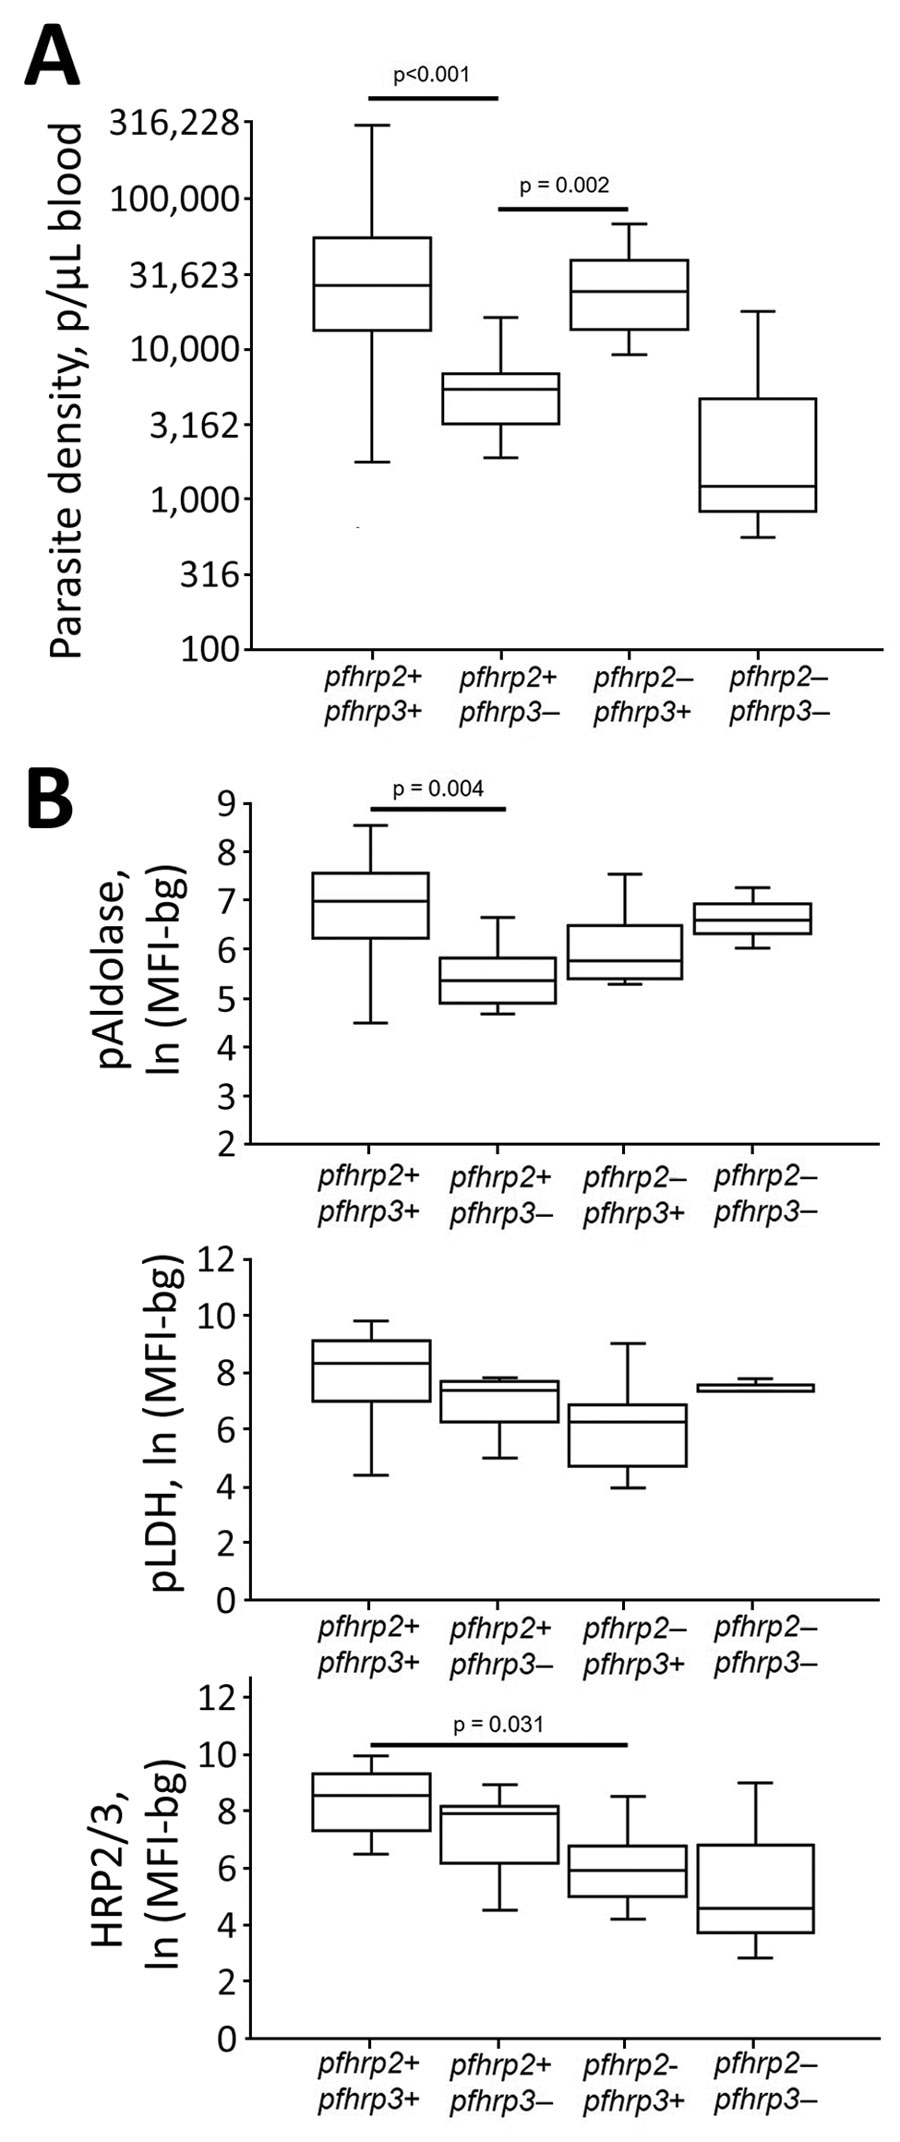
Figure 3. Plasmodium falciparum parasite density and antigen levels by pfhrp2/3 genotype in study of Plasmodium falciparum malaria-infected participants, Ethopia, Kenya, Madagascar, and Rwanda, 2016–2018. A) Peripheral blood parasite density as determined by light microscopy. B) Log-transformed assay signal to pAldolase, pLDH, and HRP2/3 antigens. Boxes display interquartile range, horizontal lines within boxes indicate medians, and whiskers indicate 1.5× interquartile range. Significant differences in means are indicated with corresponding p values. Within each plot, all other differences among genotypes did not reach statistical significance at α = 0.05. HRP2/3, histidine-rich protein 2/3; ln (MFI-bg), log-transformed median fluorescence intensity minus background value; pAldolase, pan-Plasmodium aldolase; pLDH, pan-Plasmodium lactate dehydrogenase.
Main Article
Page created: January 12, 2022
Page updated: February 21, 2022
Page reviewed: February 21, 2022
The conclusions, findings, and opinions expressed by authors contributing to this journal do not necessarily reflect the official position of the U.S. Department of Health and Human Services, the Public Health Service, the Centers for Disease Control and Prevention, or the authors' affiliated institutions. Use of trade names is for identification only and does not imply endorsement by any of the groups named above.