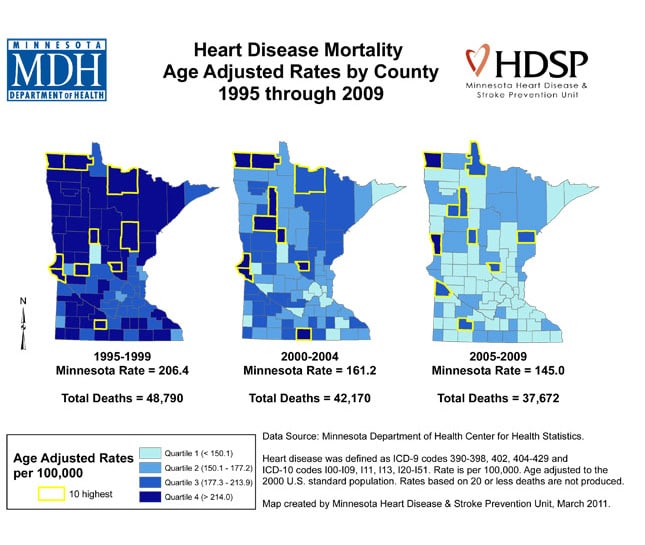
Map Details – Minnesota Heart Disease Mortality Age Adjusted Rates by County
Impact Statement
This map shows the overall heart disease mortality rate for the state and the total number of deaths. Age adjusted heart disease mortality rates by Minnesota county are shown in three 5-year time periods from 1995 through 2009.