Infant Mortality by Age at Death in the United States, 2016
- Key findings
- Total infant, neonatal, and postneonatal mortality rates did not change significantly between 2015 and 2016.
- Infants of non-Hispanic black women had the highest total infant and neonatal mortality rates.
- Total infant and postneonatal mortality rates were highest for infants of women under age 20.
- In 2016, for the five leading causes of death, the rate of mortality from congenital malformations was second highest for neonatal infant deaths and highest for postneonatal infant deaths.
- Summary
- Definitions
- Data sources and methods
- About the authors
- References
- Suggested citation
PDF Version (481 KB)
Danielle M. Ely, Ph.D., Anne K. Driscoll, Ph.D., and T.J. Mathews, M.S.
Key findings
Data from the National Vital Statistics System
- The total infant mortality rate declined from 6.75 infant deaths per 1,000 births in 2007 to 6.07 in 2011, but did not change significantly from 2011 through 2016 (5.87).
- In 2016, neonatal mortality rates were highest among infants of non-Hispanic black women (7.41). Postneonatal mortality rates were highest among infants of non-Hispanic black (3.81) and American Indian or Alaska Native (3.93) women.
- In 2016, neonatal mortality rates were highest among infants of women under age 20 and 40 and over compared with infants of other maternal age groups. Postneonatal mortality rates were highest among infants of women under age 20.
- Low birthweight accounted for the highest rate of neonatal mortality, whereas congenital malformations and sudden infant death syndrome accounted for the highest rates of postneonatal deaths.
Infant mortality is an important public health measure in the United States and other countries (1–3). The United States’ infant mortality rate started to decline in 2007 (the most recent high), but has remained relatively unchanged in recent years (4,5). Previous research shows differences in infant mortality rates by age at death (i.e., neonatal, or deaths to infants aged 0–27 days, and postneonatal, or deaths to infants aged 28–364 days), age and race and Hispanic origin of the mother, and leading causes of death (4–6). This report examines infant mortality rates for the United States by age at death in 2016, by maternal age and race and Hispanic origin, and for the five leading causes of neonatal and postneonatal mortality.
Keywords: infant death, births, infant health, National Vital Statistics System
Total infant, neonatal, and postneonatal mortality rates did not change significantly between 2015 and 2016.
- The overall infant mortality rate did not change significantly from 2011 through 2016, after a 10% decline from 2007 through 2011. In 2016, the total infant mortality rate was 5.87 deaths per 1,000 births (Figure 1).
- The neonatal mortality rate declined from 4.42 in 2007 to 3.88 in 2016, but was essentially unchanged between 2015 and 2016 (3.94).
- The postneonatal mortality rate declined from 2.33 in 2007 to 1.87 in 2014 and did not change significantly from 2014 (1.87) through 2016 (1.99).
Figure 1. Total infant, neonatal, and postneonatal mortality rates: United States, 2007–2016

1Significant decreasing trend for 2007–2011 (p < 0.05); stable trend for 2011–2016.
2Significant decreasing trend for 2007–2016 (p < 0.05).
3Significant decreasing trend for 2007–2014 (p < 0.05); stable trend for 2014–2016.
NOTES: Access data table for Figure 1.
SOURCE: NCHS, National Vital Statistics System, Linked birth/infant death data set.
Infants of non-Hispanic black women had the highest total infant and neonatal mortality rates.
- The mortality rate among infants born to non-Hispanic black women was 11.21 deaths per 1,000 births in 2016, compared with 8.61 among American Indian or Alaska Native, 4.96 among Hispanic, 4.87 among non-Hispanic white, and 3.97 among Asian or Pacific Islander infants (Figure 2).
- The neonatal mortality rate among infants of non-Hispanic black women was 7.41 compared with infants of non-Hispanic white (3.10), American Indian or Alaska Native (4.68), Asian or Pacific Islander (2.83), and Hispanic (3.45) women.
- Postneonatal mortality rates were highest among infants of non-Hispanic black women (3.81) and infants of American Indian or Alaska Native women (3.93) compared with infants of non-Hispanic white (1.78), Asian or Pacific Islander (1.14), and Hispanic (1.51) women.
Figure 2. Total infant, neonatal, and postneonatal mortality rates, by race and Hispanic origin: United States, 2016
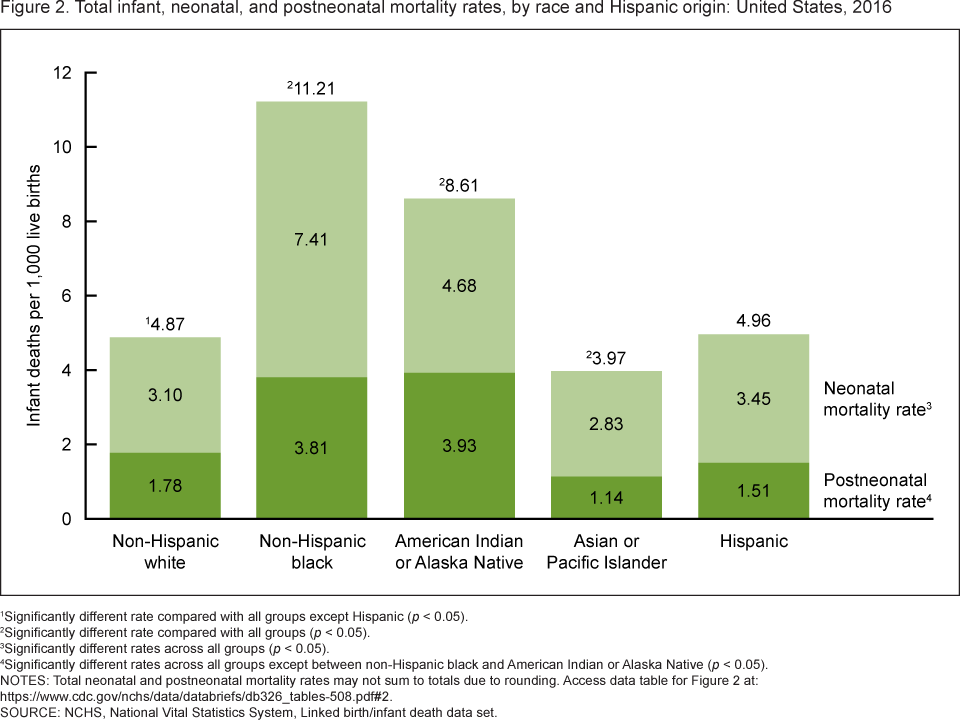
1Significantly different rate compared with all groups except Hispanic (p < 0.05).
2Significantly different rate compared with all groups (p < 0.05).
3Significantly different rates across all groups (p < 0.05).
4Significantly different rates across all groups except between non-Hispanic black and American Indian or Alaska Native (p < 0.05).
NOTES: Total neonatal and postneonatal mortality rates may not sum to totals due to rounding. Access data table for Figure 2.
SOURCE: NCHS, National Vital Statistics System, Linked birth/infant death data set.
Total infant and postneonatal mortality rates were highest for infants of women under age 20.
- The total mortality rate for infants of women under age 20 was 8.69 deaths per 1,000 births in 2016; infants of women aged 30–34 had the lowest total mortality rate (4.86) (Figure 3).
- Neonatal mortality rates were highest for infants of women under age 20 and aged 40 and over (5.32 each); infants of women aged 30–34 had the lowest neonatal mortality rates (3.44).
- Postneonatal mortality rates were highest for infants of women under age 20 (3.36); infants of women in their thirties had the lowest postneonatal mortality rates (1.42 for infants of women aged 30–34 and 1.46 for infants of women aged 35–39).
Figure 3. Total infant, neonatal, and postneonatal mortality rates, by maternal age: United States, 2016

1Significantly different from all other maternal age groups (p < 0.05).
2Significantly different from all other maternal age groups except aged 40 and over (p < 0.05).
3Significant difference between all age groups except between those under age 20 and aged 40 and over, and between those aged 25–29 and 35–39 (p < 0.05).
4Significant difference between all age groups except between those aged 25–29 and 40 and over, and between those aged 30–34 and 35–39 (p < 0.05).
NOTES: Total neonatal and postneonatal mortality rates may not sum to totals due to rounding. Access data table for Figure 3.
SOURCE: NCHS, National Vital Statistics System, Linked birth/infant death data set.
In 2016, for the five leading causes of death, the rate of mortality from congenital malformations was second highest for neonatal infant deaths and highest for postneonatal infant deaths.
- Mortality rates for the five leading causes of neonatal death were 97.7 neonatal deaths per 100,000 births for low birthweight; 86.4 for congenital malformations; 35.3 for maternal complications; 21.0 for placenta, cord, and membrane complications; and 14.0 for bacterial sepsis (Figure 4).
- Mortality rates for the five leading causes of postneonatal death were 35.8 for congenital malformations, 34.9 for sudden infant death syndrome (SIDS), 27.4 for unintentional injuries, 9.1 for diseases of the circulatory system, and 6.4 for homicide.
- Neonatal mortality rates for low birthweight and congenital malformations were two to seven times higher than rates for maternal complications; placenta, cord, and membrane complications; and bacterial sepsis.
- Postneonatal mortality rates for congenital malformations and SIDS were three to six times higher than rates for diseases of the circulatory system and homicide.
Figure 4. Neonatal and postneonatal mortality rates for five leading causes of neonatal and postneonatal death: United States, 2016

1Significantly different rates across all leading causes of death (p < 0.05).
2Significantly different rates across all leading causes of death except between congenital malformations and sudden infant death syndrome (p < 0.05).
NOTE: Access data table for Figure 4.
SOURCE: NCHS, National Vital Statistics System, Linked birth/infant death data set.
Summary
Total infant, neonatal, and postneonatal mortality rates in 2016 were generally unchanged from 2015. After the decline from 2007 through 2011, the total infant mortality rate in the United States has been relatively stable through 2016. Neonatal mortality rates decreased over the 2007–2016 period, while postneonatal mortality rates declined from 2007 through 2014 but remained stable from 2014 through 2016. A recent report also found a recent lack of change in perinatal mortality overall, and in late fetal and early neonatal mortality (7). Concurrently, rates of preterm and low birthweight, newborn outcomes associated with infant death, have been on the rise (8,9).
In 2016, total infant, neonatal, and postneonatal mortality rates in the United States continue to vary by maternal characteristics such as mother’s race and Hispanic origin and age. Infants of non-Hispanic black and American Indian or Alaska Native women continue to have higher overall mortality rates, as well as higher neonatal and postneonatal mortality rates, than infants of women of other race and Hispanic-origin groups; this pattern has remained stable over time (4,10). Both neonatal and postneonatal mortality rates were generally higher for infants of the youngest and oldest mothers. This pattern reflects risk factors for infant death among women under age 20 and aged 40 and over, such as higher rates of low birthweight and preterm births and lower rates of timely prenatal care (9). Although rates have decreased since 2007 among all groups, significant variations across groups remain (4,5).
Neonatal and postneonatal infant deaths are largely due to different causes. With the exception of congenital malformations, the leading causes differed by age at death, and the highest neonatal mortality rate from low birthweight was more than 2.5 times the highest postneonatal mortality rates for congenital malformations or SIDS.
Definitions
Cause-of-death classification: Medical information—including injury diagnoses and external causes of injury—is entered on death certificates filed in the United States and classified and coded in accordance with the International Statistical Classification of Diseases and Related Health Problems, 10th Revision (ICD–10) (6). Corresponding abbreviations of infant cause-of-death categories and ICD–10 codes presented in this report are:
- Diseases of the circulatory system (I00–I99)
- Maternal complications: Newborn affected by maternal complications of pregnancy (P01)
- Placenta, cord and membrane complications: Newborn affected by complications of placenta, cord and membrane (P02)
- Low birthweight: Disorders related to short gestation and low birthweight, not elsewhere classified (P07)
- Bacterial sepsis (P36)
- Congenital malformations: Congenital malformations, deformations, and chromosomal abnormalities (Q00–Q99)
- Sudden infant death syndrome (R95)
- Unintentional injuries: Accidents [unintentional injuries (V01–X59)]
- Homicide: Assault [homicide (*U01.0, X85–Y09)]
Infant mortality rate: Number of infant (under 1 year) deaths per 1,000 live births.
Leading causes of death: Ranked according to the number of deaths assigned to rankable causes (6).
Neonatal mortality rate: Number of deaths to infants aged 0–27 days per 1,000 live births.
Postneonatal mortality rate: Number of deaths to infants aged 28 to 364 days per 1,000 live births.
Data sources and methods
This report contains data from the period linked birth/infant death data set, which is part of the National Vital Statistics System (5). The period linked birth/infant death data set includes all infant deaths under 1 year of age reported on death certificates and all births reported from birth certificates. The period linked birth/infant death data set is the primary data set for analyzing infant mortality trends and patterns in the United States, and it is the only source for examining race and Hispanic-origin infant mortality and for examining factors related to birth (5,11). Race and Hispanic origin are self-reported by the mother on the birth certificate.
Linked birth/infant death data sets are available from: Vital Statistics Online Data Portal.
References to increases or decreases in rates indicate that differences are statistically significant at the 0.05 level (5). References to trends in rates for Figure 1 were evaluated using the Joinpoint Regression Program. A maximum of one joinpoint was allowed during the 2007–2016 period, which is the default setting. The default settings were also selected for the other parameters of the analysis (12).
About the authors
Danielle M. Ely, Anne K. Driscoll, and T.J. Mathews are with the National Center for Health Statistics, Division of Vital Statistics.
References
- Chen A, Oster E, Williams H. Why is infant mortality higher in the United States than in Europe? Am Econ J Econ Policy 8(2):89–124. 2016.
- Jacob JA. US infant mortality rate declines but still exceeds other developed countries. JAMA 315(5):451–2. 2016.
- MacDorman MF, Mathews TJ, Mohangoo AD, Zeitlin J. International comparisons of infant mortality and related factors: United States and Europe, 2010. National Vital Statistics Reports; vol 63 no 5. Hyattsville, MD: National Center for Health Statistics. 2014.
- Mathews TJ, Driscoll AK. Trends in infant mortality in the United States, 2005–2014. NCHS Data Brief, no 279. Hyattsville, MD: National Center for Health Statistics. 2017.
- Mathews TJ, MacDorman MF, Thoma ME. Infant mortality statistics from the 2013 period linked birth/infant death data set. National Vital Statistics Reports; vol 64 no 9. Hyattsville, MD: National Center for Health Statistics. 2015.
- Heron M. Deaths: Leading causes for 2015. National Vital Statistics Reports; vol 66 no 5. Hyattsville, MD: National Center for Health Statistics. 2017.
- Gregory ECW, Drake P, Martin JA. Lack of change in perinatal mortality in the United States, 2014–2016. NCHS Data Brief, no 316. Hyattsville, MD: National Center for Health Statistics. 2018.
- Martin JA, Osterman MJK. Describing the increase in preterm births in the United States, 2014–2016. NCHS Data Brief, no 312. Hyattsville, MD: National Center for Health Statistics. 2018.
- Martin JA, Hamilton BE, Osterman MJK, Driscoll AK, Drake P. Births: Final data for 2016. National Vital Statistics Reports; vol 67 no 1. Hyattsville, MD: National Center for Health Statistics. 2018.
- MacDorman MF, Mathews TJ. Recent trends in infant mortality in the United States. NCHS Data Brief, no 9. Hyattsville, MD: National Center for Health Statistics. 2008.
- Kochanek KD, Murphy SL, Xu JQ, Tejada-Vera B. Deaths: Final data for 2014. National Vital Statistics Reports; vol 65 no 4. Hyattsville, MD: National Center for Health Statistics. 2016.
- National Cancer Institute. Joinpoint Regression Program (Version 4.6.0.0) [computer software]. 2018.
Suggested citation
Ely DM, Driscoll AK, Mathews TJ. Infant mortality by age at death in the United States, 2016. NCHS Data Brief, no 326. Hyattsville, MD: National Center for Health Statistics. 2018.
Copyright information
All material appearing in this report is in the public domain and may be reproduced or copied without permission; citation as to source, however, is appreciated.
National Center for Health Statistics
Charles J. Rothwell, M.S., M.B.A., Director
Jennifer H. Madans, Ph.D., Associate Director for Science
Division of Vital Statistics
Steven Schwartz, Ph.D., Director
Hanyu Ni, Ph.D., M.P.H., Associate Director for Science