 |
|
|
|
|
|
|
| ||||||||||
|
|
|
|
|
|
|
||||
| ||||||||||
|
|
|
|
|
Persons using assistive technology might not be able to fully access information in this file. For assistance, please send e-mail to: mmwrq@cdc.gov. Type 508 Accommodation and the title of the report in the subject line of e-mail. Practice and ExperienceDeciphering Data Anomalies in BioSenseLeslie Z. Sokolow,1,2 N. Grady,3 H.
Rolka,2 D. Walker,2 P. McMurray,3 R. English-Bullard,2 J. Loonsk2
Corresponding author: Leslie Z. Sokolow, CDC, 1600 Clifton Rd., NE, MS E-06, Atlanta, GA 30333. Telephone: 404-4986331; Fax: 404498-6145; Email: lsokolow@cdc.gov. Disclosure of relationship: The contributors of this report have disclosed that they have no financial interest, relationship, affiliation, or other association with any organization that might represent a conflict of interest. In addition, this report does not contain any discussion of unlabeled use of commercial products or products for investigational use. AbstractIntroduction: Since June 2004, CDC's BioIntelligence Center has monitored daily nationwide syndromic data by using the BioSense surveillance application. Objectives: The BioSense application has been monitored by a team of full-time CDC analysts. This report examines their role in identifying and deciphering data anomalies. It also discusses the limitations of the current surveillance application, lessons learned, and potential next steps to improve national syndromic surveillance methodology. Methods: Data on clinical diagnoses (International Classification of Diseases, Ninth Revision, Clinical Modifications [ICD-9-CM]) and medical procedures (CPT codes) are provided by Department of Veterans Affairs and Department of Defense ambulatory-care clinics; data on select sales of over-the-counter health-care products are provided by participating retail pharmacies; and data on laboratory tests ordered are provided by Laboratory Corporation of America, Inc. All data are filtered to exclude information irrelevant to syndromic surveillance. Results: During June--November 2004, of the approximately 160 data anomalies examined, no events involving disease outbreaks or deliberate exposure to a pathogen were detected. Data anomalies were detected by using a combination of statistical algorithms and analytical visualization features. The anomalies primarily reflected unusual changes in either daily data volume or in types of clinical diagnoses and procedures. This report describes steps taken in routine monitoring, including 1) detecting data anomalies, 2) estimating geographic and temporal scope of the anomalies, 3) gathering supplemental facts, 4) comparing data from multiple data sources, 5) developing hypotheses, and 6) ruling out or validating the existence of an actual event. To be useful for early detection, these steps must be completed quickly (i.e., in hours or days). Anomalies described are attributable to multiple causes, including miscoded data, effects of retail sales promotions, and smaller but explainable signals. Conclusion: BioSense requires an empirical learning curve to make the best use of the public health data it contains. This process can be made more effective by continued improvements to the user interface and collective input from local public health partners. IntroductionCDC's BioSense application, which has been in use since November 2003, permits the early detection of intentional and natural infectious-disease outbreaks. The application has an Internet-based interface that enables public health officials in 86 geographic regions (50 states, two territories, and 34 major metropolitan areas) to access prediagnostic health data on a near real-time basis (1). Statistical algorithms and analytical visualizations are used to present multiple streams of nationwide public health data. The CDC BioSense Initiative provides a new surveillance tool for state and local health use and gives CDC the responsibility for informing its use. Since June 2004, an average of six full-time CDC BioSense monitors have examined and analyzed data daily. This report describes the role of the BioSense data monitors and discusses how they monitor and decipher data anomalies. BioSense receives daily data that are delivered electronically from four sources. Ambulatory-care clinics within the Department of Veterans Affairs (VA) and Department of Defense (DoD) systems provide International Classification of Diseases, Ninth Revision, Clinical Modification (ICD-9-CM) coded diagnoses and CPT-coded medical procedures for 580 (98%) of 592 facilities nationwide. On an average day, BioSense received more than 1,000,000 records from VA and 500,000 from DoD. During June--November 2004, data on select over-the-counter (OTC) pharmacy sales were received from >10,000 pharmacies, representing 23% of the national market share (2) and 20% of U.S. ZIP codes (CDC, unpublished data, 2005). Data on laboratory tests ordered were received from Laboratory Corporation of America, Inc. (LabCorp), representing 33,674 (77%) of 44,008 U.S. ZIP codes. BioSense is a multijurisdictional data-sharing surveillance application that is nationwide in coverage and is available to state and local public health departments. Other applications implemented at local or regional levels use other data sources and user interfaces and cannot easily be used to compare different localities across the United States (3--17). The BioSense Initiative includes partnerships with other application groups. BioSense's national scope maximizes its ability to detect local events and those that cross jurisdictional boundaries (e.g., states or counties). Because the sources are consistent across the country, data monitors can compare multiple locations by using the same types of data. Data-sharing efforts could lessen the surveillance burden for state and local health departments and clinical personnel (18). MethodsBioSense organizes incoming data into 11 syndromes that are indicative of the clinical presentations of critical biologic terrorism--associated conditions (Table 1). These syndromic categories and their associated codes are classified on the basis of definitions identified by multiagency working groups (19,20). BioSense represents individual syndrome information in maps, graphs, and tables. Multiple options are available for customizing visual displays. Data can be displayed by using raw counts or transformed in multiple ways before graphing and mapping (e.g., normalized standard deviation, log, ratio, and proportional). Geographic extent can be defined as an entire state or metropolitan area, an individual or group of contiguous ZIP codes, or a cluster of ZIP codes based on the first three digits (ZIP3). Useful data transformations include standard deviation and day-of-week adjustments. A specific age group (e.g., children aged <3 years or persons aged >60 years) or sex also can be selected for all data sources. Historical data ranging from 1 to 365 days can be included in the visual displays. Within the tabular view, filtering is available to include or exclude key variables. All these customizations increase users' ability to detect data anomalies. A data anomaly is a change in distribution or frequency in data compared with geographic or historic context. Change is quantified by using the elevated scores of two different algorithms. An adaptation of the CUSUM (9) is useful for identifying anomalies on a regional level, whereas SMART Scores (21) detect changes at the ZIP-code level. Changes are also identified by abrupt departures in the visual presentation of the data, including changes in the daily data volume or in the types or combinations of clinical diagnoses and procedures. BioSense displays data in multiple presentations (e.g., algorithm scores, line graphs, maps, and tabular summaries, and detail) that can reveal data aberrations clearly. However the application does not draw conclusions for the user; human interpretation is required in using the technology to enhance the ability of analysts to detect and understand nuances in the data. Function of Data MonitorsThe primary function of CDC data monitors is to support broad use of the system among state and local public health partners. To this end, CDC monitors gather and provide feedback to improve the BioSense interface by troubleshooting problems, increasing user friendliness, and generating ideas for application enhancement. Monitors also conduct inquiries of data anomalies to better understand the causes of data anomalies and develop procedures to follow in accomplishing inquiries quickly. With experience, monitors have recognized repeat patterns and recommended changes in program logic to eliminate certain kinds of routine records demonstrated not to be related to a health event (e.g., vaccination-associated diagnoses and obvious miscoding). Finally, data monitors help refine and encourage the use of BioSense at the state and local level by providing training support. Steps in Data Anomaly InquiriesBecause CDC BioSense monitors examine the interface presentation daily, they frequently detect anomalies that trigger an in-depth data inquiry (Figure 1). Each data anomaly is examined and analyzed to determine if it is of public health interest. For BioSense to be useful as an early-detection system, prompt inquires are necessary. Initial inquiries are usually completed in hours or days, depending on the circumstance and estimated degree of urgency. Urgency is estimated qualitatively by the number of records, the specific diagnostic or procedural codes, and the strength of the spatial pattern. Inquiries of BioSense data anomalies take a predetermined pathway (Figure 2). Before a data anomaly is detected, the first step is to check the quality of the data. Data usually are loaded into BioSense within 2--4 days of the event, but the data occasionally take longer to arrive (e.g., on rare occasions, up to several weeks late). The initial page of the BioSense interface displays the estimated completeness of the data for the 5 previous days (Table 2). These estimations are available for each state or metropolitan area. If data receipts are considered complete for a given range of dates, the number of records must also constitute a sufficiently large numerator for analysis. If a data anomaly is detected at the ZIPcode level, sufficient records might not be available from which to draw conclusions. The second step is to determine the geographic, temporal, and demographic extent of the data anomaly by using the different visualization features. Key questions to answer include the following:
The third step is to look for similar data anomalies in the other data sources. For example, if an anomaly is detected in the VA clinical data, monitors will assess whether a similar pattern exists in the DoD clinical data or in the LabCorp laboratory tests ordered. Although these data sources might represent different segments of the population, a correlation can exist between one data set and another. Within the BioSense data, additional information (e.g., other codes associated with visit) is available that is not viewable through the interface. BioSense monitors at CDC use SAS® EG (SAS Institute, Cary, North Carolina) to extract this information from the master files. Important information can be gathered by extracting all the available data associated with each individual visit. Monitors assess whether all visits associated with a given anomaly have other diagnostic codes in common. Although the majority of these codes are not associated with a given syndrome and are excluded from the interface, these codes are still useful when trying to decipher a detected anomaly. Displaying records by weekly or monthly totals, rather than daily, can make patterns more sharply discernable. Once the BioSense data have been analyzed, the next step is to gather data from outside sources. State and local public health partners are a source of primary importance because they are familiar with the region in question, have numerous personal contacts, and often are the only persons who can rule out a data anomaly. Relevant information can be gleaned from online newspapers, public health bulletin boards (e.g., Epi-X* or ProMed†), and state/local public health department web sites. Weather information (e.g., temperature changes, pollen counts, ozone reports, cold fronts, and lowpressure zones) can be relevant to analyzing certain syndromes (e.g., respiratory). The final step is to decide if a public health explanation exists for the data anomaly. If no public health explanation exists, the inquiry ends. If a public health explanation appears to exist, then state and local public health BioSense administrators are notified. Any further investigation, contact with DoD or VA clinics, or other follow-up response is determined by the state or local public health officials. ResultsDuring June--November 2004, of the approximately 160 data anomalies examined, no events involving disease outbreaks or deliberate exposure to a pathogen have been detected. Although monitors have contacted local and state BioSense administrators for their input on 12 occasions, no inquires have required a public health response. All inquiry results have been classified into one of eight categories (Table 3). Sample Data AnomaliesThe following section describes four in-depth inquiries in response to syndromic data anomalies in BioSense. Example 1 Data Anomaly In early September 2004, increased record counts associated with lymphadenitis syndrome were noted in DoD clinical data from one major metropolitan area. No similar increase was noted in local VA clinical data. On examination, 67 (72%) of 93 records during August 1--September 30, 2004, were for infectious mononucleosis (ICD-9-CM 075.0), all from the same DoD clinic. The visit/discharge disposition code information indicated that 37 (59%) of 63 patients with mononucleosis were sick enough to have work restrictions or be sent to bed. Inquiry At the end of the month, monitors compared monthly totals. Totals for August and September were 59 and 41, respectively, approximately 2.5 times higher than any of the previous 6 months (Figure 3). A clinician on location was contacted to obtain further information. Findings The clinician reported that the 59 records noted in BioSense for August actually represented 19 patients; 24 of the records were premature diagnoses whose diagnostic tests were later demonstrated to be negative. The actual number of laboratory-confirmed cases was 15 in August and four in September (B. Feighner, MD, Johns Hopkins Applied Physics Laboratory, personal communication, 2004). The decreased count was attributable, in part, to multiple visits by patients for referral and follow-up treatment. Because DoD records do not include individual identifiers, the ability to distinguish between multiple patients and multiple visits by a limited number of patients is limited. In addition, four patients coded as having mononucleosis were laboratory confirmed to be negative. Furthermore, August and September experienced an increase in the newly recruited population in this area; thus, the incidence for mononucleosis in this clinic was actually less than the same-type population incidence (0.15% versus 1.1%--4.8% for active-duty military personnel and college students annually) (B. Feighner, MD, Johns Hopkins Applied Physics Laboratory, personal communication, 2004). No escalation was required. Interaction with local public health providers was vital to gathering supplemental information because the circumstances would not have been understood without the information proved by the resident clinician. Example 2 Data Anomaly In early August, a sharp overnight increase was observed in OTC pharmacy sales volume for a single large state (Figure 4). Nearly all metropolitan areas within this state were affected similarly, and all OTC product classes had the same magnitude of change. No correlation was noted with DoD or VA data. Inquiry The OTC sales volume remained at elevated levels thereafter, and the data anomaly was not of limited duration. Within the state, the average number of units sold daily increased from approximately 3,100 in July 2004 to 11,500 in August and to 20,500 in September 2004. An examination of neighboring regions revealed that three adjacent states experienced similar surges in OTC sales volume. A review of Epi-X and ProMed did not indicate any public health event that matched the scale of the anomaly. Monitors suspected that the anomaly reflected an influx of additional retail stores or pharmacy chains to the datasharing program. An examination of the number of ZIP codes reporting data indicated that nationwide, the geographic range of localities reporting OTC sales increased by 2,156 new ZIP codes on a single day in early August 2004. A second increase of approximately 1,000 additional new ZIP codes nationwide occurred in early September 2004. Findings Although monitors could not confirm their suspicions, they hypothesized that the anomaly reflected the addition of new localities reporting data. One metropolitan area in that state previously had no pharmacies reporting. No response was required in this case because no public health threat was involved. This inquiry was completed in 5 business days. Example 3 Data Anomaly In late July 2004, monitors noticed an elevated number of records associated with the specific infections syndromic category (Figure 5). When the data on the tabular detail were examined, monitors identified 23 records with a diphtheria diagnosis (ICD-9-CM code 032.9) on a single day at a single clinic. All the patients were children aged <4 years. By using visit/discharge disposition codes, monitors learned that all patients were released without any restrictions. If these records had really represented patients with a serious disease, these children would not have been released without restrictions. Inquiry No mention had been made of recent diphtheria cases in the United States in either Epi-X or ProMed. By examining the historic BioSense data, monitors identified 138 other visits associated with diphtheria in 2004, which was improbable when compared with nationwide data indicating that no laboratory-confirmed cases of diphtheria were reported in 2004 (22). SAS EG was used to extract all ICD-9-CM codes associated with these visits. In every instance, an associated ICD-9-CM code was identified that indicated that a DTaP vaccine had been received during the visit; certain visits also included CPT codes, indicating the visit had been a routine well-baby examination. Findings All of the diphtheria records represented children receiving routine childhood vaccinations. In response to this finding, BioSense now excludes all records associated with vaccinations. Example 4 Data Anomaly In mid-July 2004, monitors noticed five records associated with the severe illness/death syndrome. All patients were children aged 5--13 years who have been examined at the same DoD clinic on the same day. All had records with an ICD-9-CM code of 799.9, labeled in BioSense as "Mortality, cause unknown." Inquiry Monitors initially suspected that a violent event such as a house fire or motor-vehicle crash had occurred, but no mention was found of five children dying on the same day in the archived local or military newspapers. Monitors then noticed elevated levels of "child mortality" occurring on a regular basis at this particular clinic, all on Wednesdays during February--July 2004 (Figure 6). On multiple Wednesdays, the children matched in age and sex, and the visit/discharge disposition code of 1 indicated that these children had been released without any school or day limitations. Monitors also determined that these were not duplicate records; each record represented a unique visit. Findings At this point, monitors contacted the local BioSense administrator, who contacted the DoD clinic directly. The administrator was informed that the repeating records represented the same cohort of children who had psychotherapy each Wednesday. The local administrator also reported that the correct description for ICD-9-CM 799.9 was "Mortality or Morbidity, cause unknown." This error was corrected immediately. No further escalation was necessary. Further logic strategies will be implemented to eliminate those visits that are psychotherapeutic in nature from the severe illness/death syndrome category. This example underscores the importance of using information gleaned from other ICD-9-CM and CPT codes associated with the visit to clarify the nature of an individual event, especially when the key diagnostic code is vague, as is the case with 799.9. This case also demonstrates that the effectiveness of BioSense depends on the partnership of local, state, and federal public health agencies. ConclusionThe BioSense Initiative represents a new paradigm for public health surveillance. BioSense makes secondary use of nationwide data sources, using data collected for other purposes aggregated without individual identifiers. An empirical learning process is required for BioSense users to understand how to make effective use of these data for public health purposes. Although the BioSense application was developed for use by local public health departments nationwide, CDC is responsible for developing an understanding of how to use it most effectively. To this end, CDC BioSense monitors conduct inquiries of data anomalies to rule out their potential threat to public health, provide feedback on their experiences for development of continued improvement to the user interface, perform a system troubleshooting function, generate and collect input from local public health partners, develop new ideas for system enhancements, and most important, offer support and guidance to local users on the basis of their experience. Each CDC monitor has surveillance responsibility for a public health region but also works side by side with other monitors. Access to national scope information gives monitors the capability to coordinate information about adjacent regions. For example, in holding a telephone conversation with local public health officials, monitors have quick access to data in the surrounding regions to consider and characterize a potential event. As increasing use is made of additional secondary data sources, the learning requirements for their complementary use will continue to evolve. For new surveillance capabilities to be improved, procedures for investigating observed anomalies should be shared, information and knowledge compared, and automated means to account for data artifacts developed. Acknowledgments The findings in this report are based, in part, on contributions by Matt Miller, Chaital Patel, Duane Zomer, IEM Inc., Atlanta, Georgia; Shirley Willson, Northrop Grumman, Atlanta, Georgia; Yukun Jin, Business Computer Applications, Inc., Atlanta, Georgia; Barbara Wasely, Steve Bloom, Nick August, and Colleen Bradley, Science Applications International Corporation, Atlanta, Georgia; and Howard Burkom, Brian Feigner, and Martin Sikes, Johns Hopkins Applied Physics Laboratory, Laurel, Maryland. References
* Epidemic Information Exchange is a web-based communications network (available at http://www.cdc.gov/epix) that enables the secure exchange of information among authorized epidemiologists, laboratorians, and other public health professionals at CDC and state and local agencies. † Program for Monitoring Emerging Diseases, a global electronic reporting system for outbreaks of emerging infectious diseases and toxins (available at http://www.promedmail.org), is a program of the International Society for Infectious Diseases. Table 1  Return to top. Figure 1 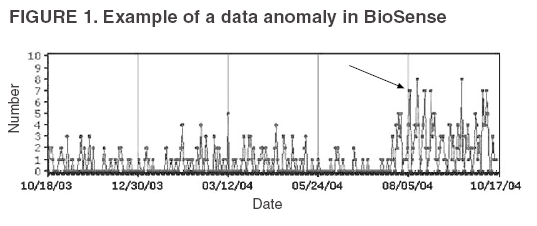 Return to top. Table 2 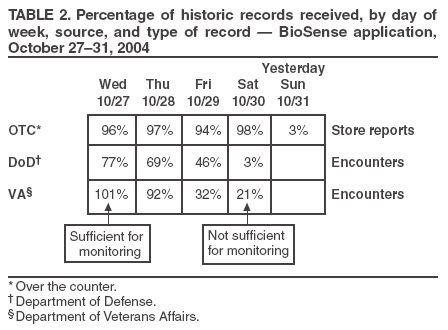 Return to top. Figure 2  Return to top. Table 3 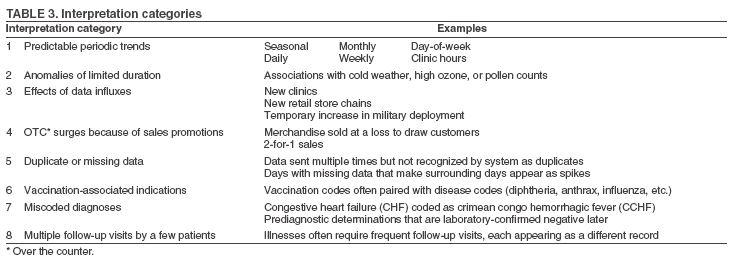 Return to top. Figure 3 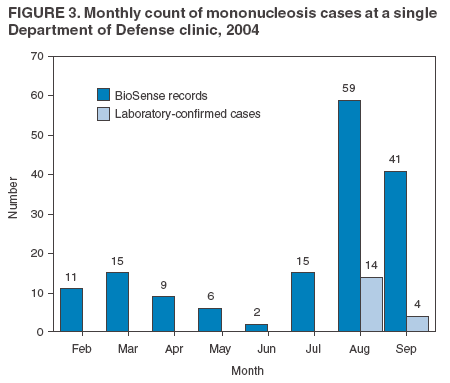 Return to top. Figure 4 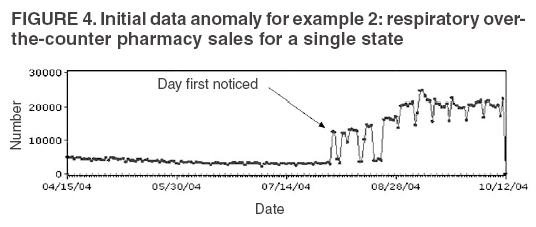 Return to top. Figure 5 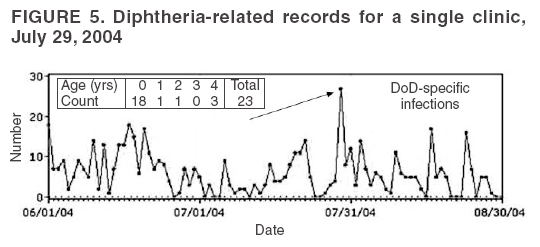 Return to top. Figure 6 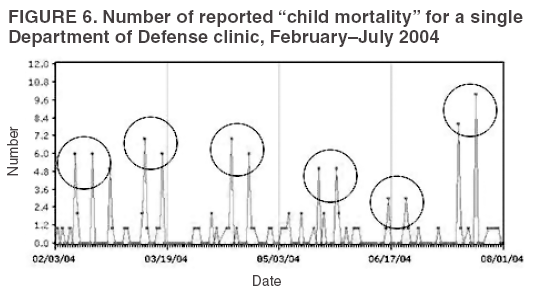 Return to top.
Disclaimer All MMWR HTML versions of articles are electronic conversions from ASCII text into HTML. This conversion may have resulted in character translation or format errors in the HTML version. Users should not rely on this HTML document, but are referred to the electronic PDF version and/or the original MMWR paper copy for the official text, figures, and tables. An original paper copy of this issue can be obtained from the Superintendent of Documents, U.S. Government Printing Office (GPO), Washington, DC 20402-9371; telephone: (202) 512-1800. Contact GPO for current prices. **Questions or messages regarding errors in formatting should be addressed to mmwrq@cdc.gov.Date last reviewed: 8/5/2005 |
|||||||||
|