 |
|
|
|
|
|
|
| ||||||||||
|
|
|
|
|
|
|
||||
| ||||||||||
|
|
|
|
|
Persons using assistive technology might not be able to fully access information in this file. For assistance, please send e-mail to: mmwrq@cdc.gov. Type 508 Accommodation and the title of the report in the subject line of e-mail. Preconception and Interconception Health Status of Women Who Recently Gave Birth to a Live-Born Infant --- Pregnancy Risk Assessment Monitoring System (PRAMS), United States, 26 Reporting Areas, 2004Denise D'Angelo, MPH1
Corresponding address: Division of Reproductive Health, National Center for Chronic Disease Prevention and Health Promotion, CDC, 4770 Buford Highway, N.E., MS K-22, Atlanta, GA 30341. Telephone: 770-488-6260; Fax: 770-488-6291; E-mail: ddangelo@cdc.gov. AbstractProblem/Condition: In 2006, CDC published recommendations to improve health and health care for women before pregnancy and between pregnancies (CDC. Recommendations to improve preconception health and health care---United States: a report of the CDC/ATSDR Preconception Care Work Group and the Select Panel on Preconception Care. MMWR 2006;55[No. RR-6]). The Pregnancy Risk Assessment Monitoring System (PRAMS) provides data concerning maternal behaviors, health conditions, and experiences for women in the United States who have delivered a live birth. Reporting Period Covered: 2004. Description of System: PRAMS is an ongoing, state- and population-based surveillance system designed to monitor selected maternal behaviors and experiences that occur before, during, and after pregnancy among women who deliver live-born infants in selected states and cities in the United States. PRAMS employs a mixed mode data-collection methodology; up to three self-administered questionnaires are mailed to a sample of mothers, and nonresponders are followed up with telephone interviews. Self-reported survey data are linked to selected birth certificate data and weighted for sample design, nonresponse, and noncoverage to create annual PRAMS analysis data sets that can be used to produce statewide estimates of perinatal health behaviors and experiences among women delivering live infants. This report summarizes data from 26 PRAMS reporting areas that collected data during 2004 and that had achieved overall weighted response rates of >70% and had weighted data available by the time the analysis was conducted in January 2007. Data are reported on indicators regarding 18 behaviors and conditions that are relevant to preconception (i.e., prepregnancy) health and health care and 10 that are relevant to interconception (i.e., postpartum) health and health care. The number of questions that were administered varied by site; certain questions were not asked for all reporting areas. Results: With respect to preconception maternal behaviors and experiences, mean overall prevalence was 23.2% for tobacco use, 50.1% for alcohol use, 35.1% for multivitamin use at least four times a week, 53.1% for nonuse of contraception among women who were not trying to become pregnant, 77.8% for ever having a dental visit before pregnancy, 30.3% for receiving prepregnancy health counseling, 3.6% for experiencing physical abuse, and 18.5% for experiencing at least four stressors before pregnancy. With respect to preconception maternal health conditions, mean overall prevalence was 13.2% for women being underweight (body mass index [BMI]: <19.8), 13.1% for being overweight (BMI: 26.0--29.0), and 21.9% for being obese (BMI: >29.0). Mean overall prevalence was 1.8% for having diabetes, 6.9% for asthma, 2.2% for hypertension, 1.2% for heart problems, and 10.2% for anemia. Among women with a previous live birth, the mean overall prevalence of having a previous low birth weight infant was 11.6% and of having a previous preterm infant was 11.9%. With respect to interconception maternal behaviors and experiences, mean overall prevalence was 17.9% for tobacco use, 85.1% for contraceptive use, 15.7% for having symptoms of depression, and 84.8% for having social support. Mean overall prevalence was 7.5% for the most recent infant being born low birth weight, 10.4% for having a recent preterm infant, 89.3% for having a check-up, 89.0% for receiving contraceptive use counseling, 30.4% for having a dental visit, and 48.6% for receiving services from the Special Supplemental Nutrition Program for Women, Infants, and Children (WIC). Results varied by maternal age, race/ethnicity, pregnancy intention, and health insurance status. For certain risk behaviors and health conditions, mean overall prevalence was higher among women aged <20 years, black women, women whose pregnancies were unintended, and women receiving Medicaid; however, no single subgroup was consistently at highest risk for all the indicators examined in this report. Interpretation: PRAMS results varied among reporting areas. The prevalence estimates in the majority of reporting areas and for the majority of indicators suggest that a substantial number of women would benefit from preconception interventions to ensure that they enter pregnancy in optimal health. The results also demonstrate disparities among age and racial/ethnic subpopulations, especially with respect to prepregnancy medical conditions and access to health care both before conception and postpartum. Differences also exist in health behaviors between women who reported intended and unintended pregnancies. Public Health Action: Maternal and child health programs can use PRAMS data to monitor improvements in maternal preconception and interconception behaviors and health status. The data presented in this report, which were collected before publication of CDC's recommendations to improve preconception health and health care in the United States, can be used as a baseline to monitor progress toward improvements in preconception and interconception health following publication of the recommendations. These data also can be used to identify specific groups at high risk that would benefit from targeted interventions and to plan and evaluate programs aimed at promoting positive maternal and infant health behaviors, experiences, and reproductive outcomes. In addition, the data can be used to inform policy decisions that affect the health of women and infants. IntroductionIn 2006, CDC published 10 recommendations to improve health and health care for women in the United States before and after pregnancy (1) (Box). CDC developed these recommendations on the basis of a review of published research and the opinions of specialists from the CDC/ATSDR Preconception Care Work Group and the Select Panel on Preconception Care. The report outlined four goals: 1) improve the knowledge, attitudes, and behaviors of men and women related to preconception health; 2) ensure that all women of childbearing age in the United States receive preconception care services (i.e., evidence-based risk screening, health promotion, and interventions) that will enable them to enter pregnancy in optimal health; 3) reduce risks indicated by a previous adverse pregnancy outcome through interventions during the interconception period, which can prevent or minimize health problems for a mother and her future children; and 4) reduce disparities in adverse pregnancy outcomes (1). The recommendations address both preconception and interconception care. Preconception care is defined as a set of interventions to identify and modify biomedical, behavioral, and social risks to a woman's health or pregnancy outcome through prevention and management. Interconception care refers to the time between pregnancies, including, but not restricted to, the postpartum period. The goal of the recommendations is to improve the health of the woman and increase the likelihood of a good pregnancy outcome by encouraging positive behaviors and controlling or preventing health problems before pregnancy. Providing women with postpartum care serves a similar purpose and has the added advantage of targeting for intervention women who have had previous poor infant or maternal outcomes and are at risk for subsequent poor outcomes (2). Risk FactorsMaternal behaviors known to be related to poor birth outcomes include tobacco use, alcohol use, and failure to consume adequate folic acid through multivitamins or diet. Evidence suggests that successful interventions targeting these behaviors prior to pregnancy are associated with improved health of the woman and her infant. For example, tobacco use during pregnancy is associated with preterm birth, small size for gestational age, and low birth weight (3--5). Tobacco use also contributes to the occurrence of spontaneous abortion, stillbirth, fetal death, and sudden infant death syndrome (6--9); approximately 5% of infant deaths in the United States can be attributed to maternal tobacco use (10). Use of alcohol during pregnancy is associated with spontaneous abortions, birth defects, and developmental disorders, many of which occur early in gestation before the woman is aware that she is pregnant (11,12). Frequent alcohol use during pregnancy is associated with fetal alcohol syndrome (FAS), which is characterized by impaired growth and mental retardation in the infant (13,14). Inadequate folic acid intake before pregnancy increases the risk for neural tube defects (NTDs) in the infant (15). NTDs affect an estimated 3,000 pregnancies annually, and 95% of children born with an NTD are born to couples with no history of these birth defects (16,17). Taking a multivitamin or otherwise increasing folic acid intake to 400 µg daily can reduce the incidence of NTDs by 50% (18). Other conditions associated with poor pregnancy outcomes include having an unintended pregnancy, experiencing physical abuse, and experiencing high levels of stress. Women who experience an unintended pregnancy are more likely than those with an intended pregnancy to have poor maternal nutrition, to use alcohol during pregnancy, and to have adverse maternal and infant outcomes (19). Physical abuse before pregnancy is related to an increased risk for low birth weight and increased maternal and infant mortality and morbidity (20). High levels of stress during pregnancy can result in an alteration of immune regulation in the fetus (21), and persistent disparities in health outcomes among minority women have been postulated to be associated with psychosocial indicators such as stress (22). Certain maternal health conditions (e.g., diabetes, hypertension, and obesity), if uncontrolled, can lead to poor infant outcomes and have a long-term negative impact on a woman's health. Uncontrolled diabetes during pregnancy can result in a threefold increase in birth defects and maternal health problems (23,24). These risks are greatly reduced through proper diabetes management (25). Obesity before pregnancy and in early pregnancy is associated with late fetal death, antepartum stillbirth, early neonatal death, large-for-gestational-age infants, birth defects, preeclampsia, and hypertensive and thromboembolic disease (26--29). Diabetes and obesity are closely linked, and persons at high risk for either condition should be screened early to ensure a healthy prepregnancy weight. In addition to these conditions, having had a previous preterm, low birth weight, or small-for-gestational-age infant is a predictor of having a subsequent poor birth outcome (30--32). Health-Care UtilizationCDC's 2006 recommendations underscore the need to create a demand for accessible preconception health services among consumers, aid implementation of effective interventions to improve women's health, ensure that clinicians offer such services, and ensure that these services are covered by health insurance (1). Talking to a health-care provider before becoming pregnant and obtaining appropriate counseling and screening can assist in identifying harmful behaviors and uncontrolled medical conditions that can be managed before pregnancy (33--36). Similarly, a prepregnancy dental visit can identify periodontal disease, which has been linked with an increased risk for low birth weight and preterm birth (37--39). Ensuring optimal maternal oral health before conception also has other potential benefits to both the woman and her infant (40). Because a woman might have a subsequent pregnancy, services in the postpartum period (e.g., a postpartum check-up, screening for postpartum depression, counseling about birth control, and accessing services such as the Special Supplemental Nutrition Program for Women, Infants, and Children [WIC]) all are opportunities to help women maintain or regain good health (41--46). Approximately 17% of women in the United States aged 18--64 years lack health insurance, which limits their ability to access health-care services (47). A substantial proportion of these women have health insurance coverage only during and shortly after pregnancy. For preconception and postpartum interventions to succeed, women should have access to preventive and curative medical services before and after pregnancy. Although data regarding certain Pregnancy Risk Assessment Monitoring System (PRAMS) indicators have been reported previously (48--50), this report groups multiple indicators related to preconception and interconception into a single document and provides estimates for 2004. The data presented in this report can be used as a baseline to monitor progress and assist states and federal agencies in setting priorities for policy and program planning related to improving preconception and interconception health and health care in the United States. MethodsProject DescriptionPRAMS is an ongoing state- and population-based surveillance system designed to monitor selected self-reported maternal behaviors and experiences that occur before, during, and after pregnancy among women who deliver live-born infants in selected states and cities in the United States. PRAMS is administered in collaboration with state health departments by CDC's National Center for Chronic Disease Prevention and Health Promotion, Division of Reproductive Health. The project supports the activities of CDC's Safe Motherhood Initiative, which aims to reduce infant mortality and low infant birth weight. Since its inception in 1987, PRAMS has expanded from six reporting areas to 39 participating sites* in 2007 (Figure). This number includes 37 states, one tribal-state collaborative project, and one city. Collectively, PRAMS represents approximately 75% of all live births in the United States. In 2004, the year for which data in this report were collected, 30 reporting areas (29 states and New York City) were conducting PRAMS projects, representing approximately 62% of all live births in the United States. This report includes data from 26 (87%) reporting areas† that had achieved an overall weighted response rate of >70% in 2004 and had weighted data available by the time the analysis was conducted in January 2007 (Figure). Indicators StudiedThe PRAMS questionnaire collects information on multiple maternal behaviors, conditions, and experiences shortly before, during, and after pregnancies that resulted in the delivery of a live birth. This report includes data on 28 indicators, including 18 indicators that concern the preconception period and 10 that concern the interconception period. These 28 indicators were selected on the basis of their potential impact on maternal and infant well-being and relevance to preceonception and interconception health. Preconception Indicators The 18 preconception indicators encompass two broad categories: 1) behaviors and experiences (tobacco use, alcohol use, multivitamin use, nonuse of contraception among those women who were not trying to become pregnant, dental visit, health counseling, physical abuse, and stress) and 2) health conditions (being underweight, overweight, or obese; having diabetes, asthma, hypertension, a heart problem, or anemia; or having a previous low birth weight or preterm infant) (Table 1). Interconception Indicators The 10 interconception indicators include behaviors (tobacco use and contraceptive use) and experiences (symptoms of depression, presence of social support, recent low birth weight or preterm infant, check-up, counseling regarding contraceptive use, dental visit, and receipt of services from the Special Supplemental Nutrition Program for Women, Infants and Children [WIC]) (Table 1). Data CollectionA detailed explanation of the PRAMS methodology has been published previously (51). All participating sites use a standardized data collection methodology developed by CDC. At each site, a monthly stratified sample of 100--300 new mothers is selected from recent birth certificates. PRAMS employs a mixed-mode data collection methodology in which up to three self-administered questionnaires are mailed to mothers, and nonrespondents are followed-up with a telephone interview. The first questionnaire usually is mailed 2--3 months after the delivery of a live-born infant to allow for collection of information about postpartum maternal and infant experiences. Efforts to contact women end 9 months postpartum in order to minimize recall bias. Survey data are linked to selected birth certificate data and weighted for sample design, nonresponse, and noncoverage. The PRAMS questionnaire is revised periodically to reflect changing priorities and emerging issues. All data highlighted in this report were collected with the phase five version of the questionnaire (52), which was implemented with the 2004 birth cohort. Data AnalysisTo minimize nonresponse bias, the CDC PRAMS team established 70% as the minimum overall weighted response rate for site data to be included in published results. This report includes data from 26 reporting areas that collected data during 2004§ and that had achieved overall weighted response rates of >70% and had weighted data available by the time the analysis was conducted in January 2007. The weighted response rate indicates the proportion of women sampled who completed a survey, adjusted for sample design. PRAMS survey respondents are women who gave birth to a live infant within the previous 2--9 months. In this report, indicators concerning the time before the woman's pregnancy are referred to as preconception indicators; these indicators also are referred to as prepregnancy indicators because women were asked to recall events specific to the 1--12 months before their recent pregnancy, which could be considered to be only part of the preconception period. Indicators concerning the time after the birth of the infant are referred to as interconception indicators; these indicators also are referred to as postpartum indicators because they refer to events that occurred from the birth through 2--9 months postpartum but not to the entire interconception period. Prevalence estimates are presented by reporting area. Data on certain indicators were available for all 26 reporting areas and were derived from core questions that all PRAMS reporting areas use. Other indicators were available only for selected reporting areas and were derived from optional site-selected questions. Definitions of each indicator and a list of reporting areas that collected data on each indicator are reported (Table 1). Alcohol use was calculated on the basis of self-reported consumption of any alcohol during the 3 months before pregnancy among those women who reported having any alcoholic drinks during the previous 2 years. Binge drinking (i.e., consuming five or more drinks in one sitting) was not examined. In certain states, two questions were asked regarding oral health. Prepregnancy and postpartum dental visits were assessed only for those reporting areas that asked women first whether they had ever had their teeth cleaned by a dentist or dental hygienist and then whether they had their teeth cleaned before or after they became pregnant. In four additional reporting areas (Colorado, Maryland, New Jersey, and West Virginia), women were asked only whether they had had a dental visit before or during pregnancy and were not included in the analysis. For the physical abuse indicator, two reporting areas (Oregon and Vermont) did not ask about abuse to teen mothers, and so no data on this indicator are shown for women aged <20 years for these reporting areas. Body mass index (BMI) was calculated on the basis of Institute of Medicine definitions (53). Three problematic categories were assessed: underweight (BMI: <19.8), overweight (BMI: 26.0--29.0), and obese (BMI: >29.0). For previous low birth weight and previous preterm birth, information was recorded from the mother's report on the questionnaire. Recent low birth weight and preterm birth were calculated on the basis of birth certificate data that are linked to PRAMS data. Because only data from one infant of twin and multiple births are selected randomly for PRAMS, estimates presented in this report might differ from reports by vital statistics agencies. For each indicator, data are presented by four demographic variables: maternal age group, race/ethnicity, pregnancy intention, and health insurance status. Age group and race/ethnicity were ascertained from the birth certificate file. Race and ethnicity are combined as a single variable subdivided as non-Hispanic white, non-Hispanic black, non-Hispanic other, and Hispanic (of any race). Pregnancy intention was determined by a woman's answer to the survey question, "Thinking back to just before you got pregnant with your new baby, how did you feel about becoming pregnant?" Out of four possible options, women who answered that they wanted to be pregnant either then or sooner were considered to have an intended pregnancy, and women who answered either that they wanted to be pregnant later or that they did not want to be pregnant then or at any time in the future were considered to have an unintended pregnancy. For the indicator regarding prepregnancy nonuse of contraception, women who were not trying to become pregnant and not using contraception were identified as those who answered "no" to the question, "When you got pregnant with your new baby, were you trying to get pregnant?" and "no" to the question, "When you got pregnant with your new baby, were your or your husband or partner doing anything to keep from getting pregnant?" Preconception health insurance status was classified as private, Medicaid, or none. Interconception health insurance status (i.e., coverage at time of delivery) was classified as private, Medicaid, or other.¶ All analyses were produced using weighted PRAMS data. Percentages and standard errors were calculated by using PROC CROSSTAB in SUDAAN version 9.0 to account for the complex sampling design used by PRAMS (55). Weighted data were pooled from all reporting areas to calculate mean overall combined estimates and 95% confidence intervals (CIs). PROC DESCRIPT in SUDAAN was used to test for contrasts between demographic characteristics, only among the estimates for all reporting areas combined. The contrast was considered statistically significant for the demographic characteristic when the p-value was <0.05. Only differences in prevalence that were statistically significant are reported. When the number of respondents was <30 persons, prevalence was not reported. Prevalence based on <60 respondents are reported and footnoted. All missing observations are excluded. ResultsThe presentation of results is divided into three sections: preconception behaviors and experiences, preconception health conditions, and postpartum behaviors and experiences. Data are presented on the mean overall prevalence of each indicator by site (Tables 2--4) and by indicators for all reporting areas with available data stratified by four maternal characteristics: age, race/ethnicity, pregnancy intention, and health insurance status (Tables 5--32). Unless otherwise indicated, data are presented for all 26 reporting areas. Periods noted regarding the preconception health indicators reflect how survey questions were asked; depending on the question, indicators might refer to the month before pregnancy, the 3 months before pregnancy, or the 12 months before birth. Preconception Behaviors and ExperiencesTobacco Use Respondents were asked if they had smoked >100 cigarettes during the previous 2 years and, if so, whether they had used any tobacco in the 3 months before their most recent pregnancy. In 2004, for all 26 reporting areas combined, mean prevalence of prepregnancy tobacco use was 23.2% (range: 12.3% [Utah]--39.5% [West Virginia]) (Table 2). Prevalence was highest among women aged <20 years (mean: 31.1%; range: 17.3% [New York City]--67.6% [Vermont]), white women (mean: 29.1%; range: 12.5% [Utah]--42.4% [Arkansas]), women whose most recent delivery was an unintended pregnancy (mean: 30.9%; range: 16.6% [New York City]--47.2% [Maine]), and women with Medicaid coverage before pregnancy (mean: 36.0%; range: 12.5% [New York City]--64.6% [West Virginia]) (Table 5). Alcohol Use Respondents were asked if they had consumed any alcohol during the previous 2 years and, if so, if they had consumed alcohol during the 3 months before their most recent pregnancy. In 2004, for all 26 reporting areas combined, mean prevalence of prepregnancy alcohol use was 50.1% (range: 25.3% [Utah]--66.8% [Vermont]) (Table 2). Prevalence was highest among women aged >35 years (mean: 55.4%; range: 26.9% [West Virginia]--70.7% [Vermont]), white women (mean: 61.6%; range: 25.2% [Utah]--74.1% [Colorado]), and women with private health insurance before pregnancy (mean: 57.1%; range: 22.7% [Utah]--72.6% [Colorado]) (Table 6). Multivitamin Use Respondents were asked how often they had taken a multivitamin or prenatal vitamin. Results are reported for those who had taken a multivitamin or a prenatal vitamin four or more times a week in the month before their most recent pregnancy. In 2004, for all 26 reporting areas combined, mean prevalence of prepregnancy multivitamin use was 35.1% (range: 26.7% [Arkansas]--43.6% [Rhode Island]) (Table 2). Prevalence was highest among women aged >35 years (mean: 51.6%; range: 42.9% [Oklahoma]--63.6% [Vermont]), white women (mean: 41.3%; range: 31.5% [Oklahoma]--50.6% [New Jersey]), women whose most recent delivery was an intended pregnancy (mean: 46.0%; range: 37.1% [West Virginia]--53.9% [Minnesota and Rhode Island]), and women who had private health insurance before pregnancy (mean: 45.9%; range: 37.3% [Arkansas]--54.1% [Rhode Island]) (Table 7). Contraceptive Nonuse Respondents were asked if they were not trying to become pregnant. Those who indicated that they were not were then asked if they had been doing anything to keep from becoming pregnant when they became pregnant with their new infant. In 2004, for all 26 reporting areas combined, mean prevalence of prepregnancy contraceptive nonuse among women who were not trying to become pregnant was 53.1% (range: 47.4% [Mississippi]--58.6% [Maryland]) (Table 2). Prevalence did not vary by age group, race/ethnicity, or prepregnancy health insurance status. Prevalence was highest among women whose pregnancies were intended (mean: 69.8%; range: 61.9% [Georgia]---78.5% [North Carolina]) (Table 8). Dental Visit Respondents were considered to have had a prepregnancy dental visit if they reported having had their teeth cleaned by a dentist or hygienist at some time before their most recent pregnancy. Information was available in 10 reporting areas (Alaska, Arkansas, Maine, Michigan, Mississippi, Nebraska, South Carolina, Utah, Vermont, and Washington). In 2004, for all 10 reporting areas combined, mean prevalence of a prepregnancy dental visit was 77.8% (range: 68.3% [Arkansas]--84.2% [Vermont]) (Table 2). Prevalence was highest among women aged >35 years (mean: 83.7%; range: 65.2% [Mississippi]--90.7% [Maine]), white women (mean: 83.4%; range: 74.3% [Arkansas]--87.3% [Washington]), women whose most recent delivery was an intended pregnancy (mean: 81.3%; range: 71.3% [Arkansas]--86.4% [Vermont]), and women who had private health insurance before pregnancy (mean: 84.9%; range: 77.7% [Arkansas]--86.7% [Utah]) (Table 9). Health Counseling Respondents were asked if they had talked with a health-care professional regarding preparing for a healthy pregnancy and infant before they became pregnant with their new infant. Information was available in five reporting areas (Louisiana, Maine, New Jersey, Utah, and Vermont). In 2004, for all five reporting areas combined, mean prevalence of prepregnancy health counseling was 30.3% (range: 24.1% [Louisiana]--34.8% [Maine]) (Table 2). Prevalence was highest among women aged >35 years (mean: 42.2%; range: 35.8% [Utah]--46.4% [Vermont]). Prevalence was higher among white women (mean: 34.2%; range: 28.6% [Utah]--41.6% [New Jersey]) and women of other races (mean: 34.6%; range: 20.3% [Louisiana]--39.3% [New Jersey]) than among black women (mean: 23.3%; range: 16.2% [Louisiana]--33.2% [New Jersey]) and Hispanic women (mean: 19.4%; range: 18.4% [Utah]--20.6% [Louisiana]). Prevalence was highest among women whose most recent pregnancy was intended (mean: 43.0%; range: 35.6% [Utah]--46.9% [New Jersey]) and women with private health insurance before pregnancy (mean: 39.5%; range: 32.8% [Utah]--43.9% [Maine]) (Table 10). Physical Abuse Respondents were asked if they had been pushed, hit, slapped, kicked, choked, or physically hurt in any way by a husband or partner during the 12 months before their most recent pregnancy. In 2004, for all 26 reporting areas combined, mean prevalence of prepregnancy physical abuse was 3.6% (range: 2.2% [Maine]--7.3% [Arkansas]) (Table 2). Prevalence was highest among women aged <20 years (mean: 6.1%; range: 3.2% [Michigan]--10.9% [Oklahoma]). Prevalence was higher among black women (mean: 5.4%; range: 1.0% [Michigan]--10.9% [Oregon]) than among white women (mean: 2.7%; range: 0.7% [New York City]--7.2% [Arkansas]) and women of other races (mean: 4.1%; range: 0.2% [New York City]--13.0% [Minnesota]). Prevalence was highest among women whose most recent delivery was an unintended pregnancy (mean: 5.9%; range: 4.1% [Georgia]--9.5% [Maryland]) and women with Medicaid coverage before pregnancy (mean: 8.0%; range: 3.5% [Washington]--19.1% [Oklahoma]) (Table 11). Stress Prepregnancy stress was assessed on the basis of respondents indicating that they had experienced at least four of a list of 13 stressful events during the 12 months before the birth of their new infant. In 2004, for all 26 reporting areas combined, mean prevalence of prepregnancy stress was 18.5% (range: 13.1% [Minnesota]--29.0% [Arkansas]) (Table 2). Prevalence was highest among women aged <20 years (mean: 28.6%; range: 15.8% [Hawaii]--46.1% [Vermont]), black women (mean: 27.9%; range: 13.2% [Hawaii]--44.9% [Oklahoma]), women whose most recent delivery was the result of an unintended pregnancy (mean: 28.5%; range: 19.4% [New York City]--38.1% [Oklahoma]), and women with Medicaid coverage before pregnancy (mean: 33.8%; range: 15.3% [New York City]--48.5% [Oklahoma]) (Table 12). Preconception Health ConditionsUnderweight, Overweight, and Obesity Respondents' BMI was calculated on the basis of their self-reported prepregnancy height and weight. Respondents were considered to be underweight if their BMI was <19.8 before they became pregnant, overweight if their BMI was 26.0--29.0, and obese if their BMI was >29.0. Underweight. In 2004, for all 26 reporting areas combined, mean prevalence of prepregnancy underweight was 13.2% (range: 10.8% [South Carolina]--17.0% [Arkansas]) (Table 3). Prevalence was highest for women aged <20 years (mean: 22.1%; range: 13.3% [Alaska]--33.3% [Utah]), women who classified their race as other (mean: 19.7%; range: 8.5% [Alaska]--36.4% [Maryland]) and women whose most recent pregnancy was unintended (mean: 14.2%; range: 9.8% [Alaska]--17.3% [Florida and Hawaii]). Prevalence was higher among women with Medicaid coverage before pregnancy (mean: 14.5%; range: 9.3% [Colorado and Vermont]--24.9% [Arkansas]) and women with no health insurance before pregnancy (mean: 14.9% range: 10.4% [Alaska]--22.8% [Hawaii]) than women with private health insurance before pregnancy (mean: 12.1%; range: 8.7% [South Carolina]--15.8% [Hawaii]) (Table 13). Overweight. In 2004, for all 26 reporting areas combined, mean prevalence of prepregnancy overweight was 13.1% (range: 11.0% [Utah]--15.0% [New York City]) (Table 3). Prevalence was higher among women aged 20--34 years (mean: 13.3%; range: 26.6% [Utah]--43.5% [Mississippi]) and women aged >35 years (mean: 13.7%; range: 23.8% [Vermont]--51.1% [Arkansas]) than among women aged <20 years (mean: 10.4%; range: 4.0% [Colorado]--15.6% [Rhode Island]). Prevalence was higher among black women (mean: 14.7%; range: 1.1% [Alaska]--20.3% [Michigan]) and Hispanic women (mean: 15.9%; range: 8.7% [Oklahoma]--22.5% [Arkansas]) than among white women (mean: 12.2%; range: 9.1% [Louisiana]--14.7% [New Mexico]) and women of other races (mean: 10.1%; range: 2.8% [Maryland]--20.6% [New York City]). Prevalence did not vary by pregnancy intention or health insurance status (Table 14). Obesity. In 2004, for all 26 reporting areas combined, mean prevalence of prepregnancy obesity was 21.9% (range: 15.7% [Utah]--26.6% [Arkansas]) (Table 3). Prevalence was higher among women aged 20--34 years (mean: 26.2%; range 17.4% [Utah]--33.4% [Mississippi]) and women aged >35 years (mean: 27.2%; range: 15.0% [Vermont]--44.3% [Arkansas]) than among women aged <20 years (mean: 15.5%; range: 8.0% [Maine]--25.9% [North Carolina]). Prevalence was higher among black women (mean: 37.9%; range: 29.4% [Oklahoma]--46.9% [Michigan]) than among all other racial/ethnic populations except Hispanic women. Prevalence was highest among women whose most recent delivery was unintended pregnancy (mean: 26.7%; range: 19.5% [Minnesota]--31.5% [Michigan]) and women with Medicaid coverage before pregnancy (mean: 32.7%; range: 15.3% [Utah]--44.4% [Michigan]) (Table 15). Diabetes Respondents were considered to have prepregnancy diabetes if they reported having had high blood sugar or diabetes that started before their most recent pregnancy. In 2004, for all 26 reporting areas combined, mean prevalence of prepregnancy diabetes was 1.8% (range: 0.9% [Washington]--5.7% [West Virginia]) (Table 3). Prevalence was higher among women aged >35 years (mean: 3.0%; range: 1.0% [Maine]--9.1% [West Virginia]) than among women aged 20--34 years (mean: 1.6%; range: 0.8% [Washington]--5.9% [West Virginia]). Prevalence was higher among black women (mean: 3.3%; range: 0.6% [Nebraska] to 13.1% [West Virginia]) than among all other racial/ethnic populations except Hispanic women (mean: 2.6%; range: 0 [Minnesota]--9.7% [Michigan]). Prevalence did not vary by pregnancy intention. Prevalence was higher among women with Medicaid coverage before pregnancy (mean: 2.9%; range: 0.2% [Maryland and Vermont]--7.8% [Georgia]) and women with no health insurance before pregnancy (mean: 2.2%; range: 0.2% [Maine]--8.4% [West Virginia]) than among women with private health insurance before pregnancy (mean: 1.4%; range: 0.7% [Colorado and Illinois]--3.3% [North Carolina and West Virginia]) (Table 16). Asthma Respondents were considered to have prepregnancy asthma if they reported that they had asthma during the 3 months before they became pregnant with their new infant. Information was available in four reporting areas (Florida, Maryland, Minnesota, and West Virginia). In 2004, for all four reporting areas combined, mean prevalence of prepregnancy asthma was 6.9% (range: 6.1% [Florida]--10.8% [West Virginia]) (Table 3). Prevalence was higher among white women (mean: 7.7%; range: 7.2% [Florida]--10.8% [West Virginia]) and black women (mean: 7.7%; range: 6.1% [Florida]--12.2% [Minnesota]) than among Hispanic women (mean: 4.3%; range: 3.3% [Maryland]--5.8% [Minnesota]). Prevalence was highest among women with Medicaid coverage before pregnancy (mean: 10.7%; range: 8.6% [Florida]--26.5% [West Virginia]). Prevalence did not vary by age group or pregnancy intention (Table 17). Hypertension Respondents were considered to have prepregnancy hypertension if they reported that they had high blood pressure (hypertension) during the 3 months before they became pregnant with their new infant. Information was available in four reporting areas (Florida, Maryland, Minnesota, and West Virginia). In 2004, for all four reporting areas combined, mean prevalence of prepregnancy hypertension was 2.2% (range: 1.7% [Minnesota]--4.0% [West Virginia]) (Table 3). Prevalence was higher among women aged >35 years (mean: 4.1%; range: 1.5% [West Virginia]--5.4% [Maryland]) than among women aged 20--34 years (mean: 1.8%; range: 1.1% [Minnesota]-- 4.6% [West Virginia]). Prevalence was highest among black women (mean: 3.8%; range: 3.5% [Maryland]--11.1% [West Virginia]) (Table 18). Prevalence did not vary by pregnancy intention or health insurance status. Heart Problems Respondents were considered to have prepregnancy heart problems if they reported that they had heart problems during the 3 months before they became pregnant with their new infant. Information was available in four reporting areas (Florida, Maryland, Minnesota, and West Virginia). In 2004, for all four reporting areas combined, mean prevalence of prepregnancy heart problems was 1.2% (range: 0.4% [Minnesota]--3.0% [West Virginia]) (Table 3). Prevalence did not vary among any demographic subgroups (Table 19). Anemia Respondents were considered to have prepregnancy anemia if they reported that they had anemia (i.e., poor blood or low iron) during the 3 months before they became pregnant with their new infant. Information was available in four reporting areas (Florida, Maryland, Minnesota, and West Virginia). In 2004, for all four reporting areas combined, mean prevalence of prepregnancy anemia was 10.2% (range: 5.2% [Minnesota]--12.3% [Maryland]) (Table 3). Prevalence was higher among women aged <20 years (mean: 14.1%; range: 10.7% [Minnesota]--23.9% [Maryland]) than among women aged >35 years (mean: 7.6%; range: 3.9% [Minnesota]--9.3% [Maryland]). Prevalence was highest among black women (mean: 21.4%; range: 14.8% [West Virginia]--23.4% [Maryland]), women whose most recent delivery was an unintended pregnancy (mean: 15.6%; range: 7.2% [Minnesota]--21.1% [Maryland]), and women with Medicaid coverage before pregnancy (mean: 19.5%; range: 11.7% [Minnesota]--27.9% [Maryland]) (Table 20). Previous Low Birth Weight Infant Birth of a previous low birth weight infant was determined from respondents' reporting that they had a previous live birth and that the infant born just before their most recent infant had weighed <5 lbs. 8 oz. (2,500 g) at birth. In 2004, for all 26 reporting areas combined, mean prevalence of having a previous low birth weight infant was 11.6% (range: 5.7% [Maine]--15.0% [Georgia]) (Table 3). Prevalence was higher for women aged <20 years (mean: 15.5%; range: 1.2% [Minnesota]--38.9% [South Carolina]) than women aged >35 years (mean: 10.8%; range: 4.1% [Oklahoma and Vermont]--27.9% [Mississippi]). Prevalence was higher among black women (mean: 18.7%; range: 5.3% [Maine]--19.5% [Georgia]) and Hispanic women (mean: 16.3%; range: 5.8% [Rhode Island]--34.7% [Oklahoma]) than among white women (mean: 7.9%; range: 4.5% [Minnesota]--13.2% [West Virginia]) and women of other races (mean: 12.4%; range: 2.1% [Minnesota]--23.6% [New York City]) Prevalence was highest among women whose most recent delivery was an unintended pregnancy (mean: 12.9%; range: 5.0% [Alaska]--27.4% [Arkansas]) and women who had Medicaid coverage before pregnancy (mean: 15.6%; range: 5.0% [Minnesota]--26.7% [Oklahoma]) or no health insurance before pregnancy (mean: 15.0%; range: 6.0% [Maine]--22.2% [Georgia]) (Table 21). Previous Preterm Infant Birth of a previous preterm infant was determined from respondents' reporting that they had a previous live birth and that the infant born just before their most recent infant had been born >3 weeks before the due date. In 2004, for all 26 reporting areas combined, mean prevalence of having a previous preterm infant was 11.9% (range: 7.7% [Minnesota]--16.7% [Mississippi]) (Table 3). Prevalence was highest for women aged <20 years (mean: 16.4%; range: 3.3% [Minnesota]--35.5% [Illinois]). Prevalence was highest among black women (mean: 16.2%; range: 6.1% [Rhode Island]--41.5% [Oklahoma]), and women whose most recent delivery was an unintended pregnancy (mean: 13.1%; range: 7.6% [Minnesota]--18.2% [Mississippi]). Prevalence was higher among women who had Medicaid coverage before pregnancy (mean: 13.7%; range: 4.5% [Minnesota]--30.4% [West Virginia]) than among women with private health insurance (mean: 11.1%; range: 8.0% [Maine and Utah]--14.6% [Arkansas]) (Table 22). Interconception (Postpartum) Behaviors and ExperiencesTobacco Use Respondents were considered to be using tobacco postpartum if they reported that they had smoked >100 cigarettes in the past 2 years and that they smoked "now" at the time of answering the survey (2--9 months postpartum). In 2004, for all 26 reporting areas combined, mean prevalence of postpartum tobacco use was 17.9% (range: 8.7% [Utah]--33.5% [West Virginia]) (Table 4). Prevalence was highest for women aged <20 years (mean: 26.7%; range: 14.5% [New York City]--55.9% [Vermont]), white women (mean: 22.2%; range: 8.8% [Utah]--34.6% [Arkansas]), women whose most recent delivery was an unintended pregnancy (mean: 24.7%; range: 14.0% [New York City]--38.9% [West Virginia]), and women who had Medicaid coverage at delivery (mean: 26.8%; range: 10.0% [New York City]--49.0% [West Virginia]) (Table 23). Contraceptive Use Postpartum contraceptive use was assessed from respondents' reporting that they were taking action to keep from becoming pregnant at the time of survey (2--9 months postpartum). In 2004, for all 26 reporting areas combined, mean prevalence of postpartum contraceptive use was 85.1% (range: 76.4% [New York City]--89.5% [Mississippi]) (Table 4). Prevalence was higher among women aged <20 years (mean: 86.0%; range: 75.6% [Hawaii]--91.4% [North Carolina]) and women aged 20--34 years (mean: 85.8%; range: 77.5% [New York City]--90.6% [Vermont]) than among women aged >35 years (mean: 80.6%; range: 70.6% [New York City]--95.6% [Mississippi]). Prevalence also was higher among white women (mean: 85.6%; range: 67.3% [New York City]--91.1% [South Carolina]), black women (mean: 85.3%; range: 78.9% [Minnesota]--97.1% [Colorado]), and Hispanic women (mean: 85.4%; range: 78.6% [Alaska]--90.5% [Washington]) than among women of other races (mean: 77.8%; range: 65.5% [South Carolina]--95.4% [Colorado]). Prevalence was highest among women whose most recent delivery was an unintended pregnancy (mean: 87.4%; range: 79.2% [Hawaii]--93.4% [Maine]). Prevalence was higher among women with private health insurance (mean: 85.5%; range: 79.3% [New Jersey]--92.5% [Arkansas]) and Medicaid coverage at delivery (mean: 85.1%; range: 72.7% [New York City]--90.1% [South Carolina]) than among women with other health insurance status at delivery (mean: 80.7%; range: 64.0% [Illinois]--91.4% [Colorado]) (Table 24). Symptoms of Depression Respondents were considered to have symptoms of depression if they reported at 2--9 months postpartum that they often or always were feeling down, depressed, or hopeless or had little interest or little pleasure in normal activities since the birth of their new infant. Information was available in 16 reporting areas (Alaska, Colorado, Georgia, Hawaii, Maine, Maryland, Minnesota, Nebraska, New Mexico, North Carolina, Oregon, Rhode Island, South Carolina, Utah, Vermont, and Washington). In 2004, for all 16 reporting areas combined, mean prevalence of postpartum symptoms of depression was 15.7% (range: 11.1% [Maine]--19.6% [South Carolina]) (Table 4). Prevalence was highest among women aged <20 years (mean: 26.2%; range: 15.2% [Oregon]--30.9% [South Carolina]). Prevalence was higher among black women (mean: 23.3%; range: 17.3% [Washington]--42.4% [Colorado]) than among all other groups except women of other races (mean: 21.0%; range: 8.6% [South Carolina]--29.8% [Minnesota]). Prevalence was highest among women whose most recent delivery was an unintended pregnancy (mean: 20.8%; range: 15.3% [Vermont]--25.7% [South Carolina]) and among women with Medicaid coverage at delivery (mean: 22.5%; range: 18.7% [Washington]--28.1% [South Carolina]) (Table 25). Social Support Postpartum social support was assessed on the basis of respondents indicating that they had at least three of a list of five possible sources of help since the birth of their new infant at 2--9 months postpartum. Information was available in three reporting areas (North Carolina, Oklahoma, and Rhode Island). In 2004, for all three reporting areas combined, mean prevalence of postpartum social support was 84.8% (range: 84.1% [Oklahoma]--86.0% [Rhode Island]) (Table 4). Prevalence was highest among white women (mean: 90.2%; range: 88.0% [Oklahoma]--92.9% [Rhode Island]) and women who had private health insurance at delivery (mean: 91.1%; range: 90.1% [Oklahoma]--93.5% [Rhode Island]). Prevalence did not vary by age group or pregnancy intention (Table 26). Recent Low Birth Weight Infant Low birth weight of the most recent infant was defined as weight <2,500 g at birth according to birth certificate data. In 2004, for all 26 reporting areas combined, mean prevalence of having a recent low birth weight infant was 7.5% (range: 4.8% [Washington]--10.7% [Louisiana]) (Table 4). Among multiparous women who had a recent low birth weight infant, 1.2% also had given birth to a low birth weight infant before the birth of their most recent infant (CDC, unpublished data, 2006). Prevalence was highest among women aged <20 years (mean: 10.5%; range: 0.9% [New Jersey]--16.2% [Louisiana]), black women (mean: 13.3%; range: 5.4% [Minnesota]--15.7% [New Jersey]), women whose most recent delivery was an unintended pregnancy (mean: 8.3%; range: 2.7% [Washington]--12.1% [Mississippi]), and women with Medicaid coverage at delivery (mean: 8.8%; range: 4.9% [Washington]--12.1% [Louisiana and Mississippi]) (Table 27). Recent Preterm Infant The most recent infant was considered to be preterm if the birth occurred at <37 weeks gestation according to birth certificate data. In 2004, for all 26 reporting areas combined, mean prevalence of having a recent preterm infant was 10.4% (range: 7.9% [Minnesota and Vermont]--13.4% [Mississippi]) (Table 4). Among multiparous women who had a recent preterm infant, 1.8% also had given birth to a preterm infant before the birth of their most recent infant (CDC, unpublished data, 2006). Prevalence was higher among women aged >35 years (mean: 12.3%; range: 5.5% [Maine]--21.3% [Louisiana]) than among women aged 20--34 years (mean: 10.0%; range: 7.2% [Minnesota]--12.2% [Georgia and Mississippi]). Prevalence was highest among black women (mean: 14.8%; range: 5.2% [Minnesota]--22.0% [Alaska]), women whose most recent delivery resulted from an unintended pregnancy (mean: 11.1%; range: 6.8% [Vermont]--15.6% [Mississippi]), and women with Medicaid coverage at delivery (mean: 11.1%; range: 7.2% [New York City]--15.7% [West Virginia]) (Table 28). Check-Up Respondents were asked if they had had a postpartum check-up with a health-care provider by the time of survey (2--9 months postpartum). Information was available in 10 reporting areas (Arkansas, Georgia, Hawaii, Minnesota, New Jersey, New York City, Rhode Island, South Carolina, Vermont, and West Virginia). In 2004, for all 10 reporting areas combined, mean prevalence of having a postpartum check-up was 89.3% (range: 84.9% [Arkansas]--93.8% [Rhode Island]) (Table 4). Prevalence was highest among women aged >35 years (mean: 92.0%; range: 84.5% [Arkansas]--95.8% [Vermont]). Prevalence was higher among white women (mean: 91.7%; range: 86.5% [West Virginia]--95.1% [Rhode Island]) than among black women (mean: 88.1%; range: 78.9% [Hawaii]--91.1% [South Carolina]) and Hispanic women (mean: 82.5%; range; 72.1% [South Carolina]--94.2% [Rhode Island]). Prevalence was highest among women whose most recent delivery was the result of an intended pregnancy (mean: 91.4%; range: 88.2% [West Virginia]--95.3% [Rhode Island]) and those who had private health insurance at delivery (mean: 93.6%; range: 90.4% [New York City]--97.3% [Rhode Island]) (Table 29). Contraceptive Use Counseling Respondents were considered to have had postpartum contraceptive use counseling if they reported that a health-care professional had talked with them about using birth control since the birth of their new infant. Information on postpartum counseling regarding contraceptive use was available in four reporting areas (Colorado, Illinois, New York City, and Utah). In 2004, for all four reporting areas combined, mean prevalence of receiving postpartum counseling regarding contraceptive use was 89.0% (range: 78.5% [New York City]--92.0% [Colorado]) (Table 4). Prevalence was higher among women aged <20 years (mean: 91.9%; range: 84.5% [New York City]--93.6% [Illinois]) and those aged 20--34 years (mean: 89.5%; range: 79.0% [New York City]--92.1% [Utah]) than among women aged >35 years (mean: 84.7%; range: 74.1% [New York City]--92.4% [Colorado]). Prevalence was higher among those with private health insurance at delivery (mean: 89.8%; range: 79.2% [New York City]--93.7% [Utah]) and Medicaid at delivery (mean: 88.6%; range: 77.8% [New York City]--92.3% [Colorado]) than among those with other health insurance status at delivery (mean: 79.9%; range: 70.5% [Utah]--87.7% [Colorado]). Prevalence did not vary by race/ethnicity or pregnancy intention (Table 30). Dental Visit Respondents were asked if they had had their teeth cleaned by a dentist or dental hygienist since the birth of their new infant by the time of survey (2--9 months postpartum). Information was available for 10 reporting areas (Alaska, Arkansas, Maine, Michigan, Mississippi, Nebraska, South Carolina, Utah, Vermont, and Washington). In 2004, for all 10 reporting areas combined, mean prevalence of having a dental visit was 30.4% (range: 16.2% [Arkansas]--38.4% [Vermont]) (Table 4). Prevalence was highest among women aged >35 years (mean: 41.1%; range: 26.6% [Mississippi]--53.0% [Vermont]) and among white women (mean: 33.2%; range: 19.3% [Arkansas]--40.8% [Michigan]). Prevalence also was highest among women whose pregnancy was intended (mean: 35.2%; range: 21.3% [Arkansas]--43.3% [Vermont]), and women with private health insurance at delivery (mean: 41.5%; range: 27.2% [Alaska]--48.8% [Michigan]) (Table 31). Enrollment in WIC Respondents were asked if they had used WIC services for their new infant by the time the survey was conducted (2--9 months postpartum). Information was available for four reporting areas (Illinois, Maine, Michigan, and West Virginia). In 2004, for all four reporting areas combined, mean prevalence of women using WIC services for their new infants was 48.6% (range: 42.7% [Maine]--63.0% [West Virginia]) (Table 4). Prevalence was highest among women aged <20 years (mean: 90.7%; range: 79.9% [Maine]--92.6% [West Virginia]). Prevalence was higher among black women (mean: 82.0%; range: 79.5% [Michigan]--83.7% [Illinois]) and Hispanic women (mean: 78.7%; range: 71.1% [Michigan]--80.2% [Illinois]) than among white women (mean: 35.0%; range: 26.3% [Illinois]--63.0% [West Virginia]) and women of other races (mean: 30.4%; range: 24.1% [Illinois]--38.1% [Michigan]). Prevalence was highest among women whose most recent delivery resulted from an unintended pregnancy (mean: 68.1%; range: 75.2% [West Virginia]--64.8% [Maine]) and among women who had Medicaid coverage at delivery (mean: 88.5%; range: 84.0% [Maine]--90.9% [West Virginia]) (Table 32). DiscussionThe indicators discussed in this report reflect the goals and recommendations outlined in CDC's 2006 recommendations to improve preconception health and health care in the United States (1). The results presented in this report can serve as a baseline for monitoring changes in preconception and interconception behaviors, health, and health care following implementation of the 2006 recommendations. PRAMS data also are useful in measuring progress toward meeting Healthy People 2010 objectives (48). In addition, certain reporting areas have used these data to report on Title V core and state-negotiated performance measures regarding preconception care (56); 23 reporting areas (14 of which were PRAMS reporting areas in 2004) have identified Title V Priority Needs focused on preconception health (57). The findings outlined in this report indicate that a substantial proportion of women are not engaging in healthy behaviors during the preconception period. Healthier living in the preconception period can lead to better women's health and improved pregnancy outcomes. With respect to the postpartum period, results were encouraging; a smaller proportion of women were engaging in risk behaviors, and a greater percentage were using health services postpartum than were doing so preconception. However, disparities evident in the preconception period persisted into the postpartum period. Preconception Behaviors and ExperiencesRisk Behaviors and Experiences Tobacco and alcohol use continue to be priority areas for intervention. Maternal tobacco use before pregnancy was prevalent. In the majority of reporting areas, tobacco use was highest among teenagers, white women, women whose pregnancies were unintended, and women with Medicaid coverage. Findings of high prepregnancy tobacco use among teens and white women are consistent with another population-based study that examined prenatal tobacco use utilizing birth certificate data (58). Current medical guidelines advise against any alcohol use around the time of conception and throughout pregnancy; no amount of alcohol consumption is known to be safe, and any alcohol use puts a woman at elevated risk for having a FAS infant (59). The results outlined in this report indicate that alcohol use in the 3 months before pregnancy is common. This finding is consistent with data cited previously (60--62). Additional interventions are needed to make women aware of the potential harm to the fetus that can be caused by alcohol use during early gestation, before a woman might be aware that she is pregnant. Preconception care should include counseling strategies that emphasize these risks and the provision and use of effective contraception. Physical abuse can result not only in trauma to a woman and to a fetus if she is pregnant but also in high levels of stress and other risk behaviors that could adversely affect maternal health and pregnancy outcomes (e.g., tobacco, alcohol and drug use; late entry into prenatal care; and preterm labor and low birth weight) (63--66). This report indicates a low overall prevalence of physical abuse before pregnancy, similar to other studies (67). Women most likely to report abuse and high levels of stress were those aged <20 years, black women, women with unintended pregnancies, and women who were Medicaid recipients before pregnancy. Preconception care counseling should include screening to identify women who might have experienced abuse and provide referrals and access to other resources. Adequate folic acid consumption has been proven to be an effective preventative measure that reduces the occurrence of NTDs (18). However, only 35.1% of women took a multivitamin or prenatal vitamin four or more times a week in the month prior to pregnancy. The findings provided in this report are consistent with a state study and a national study that reported a higher prevalence of multivitamin use among older women and white women (68,69). The consistent and correct use of effective contraception is central to all of these interventions. Providing women the ability to plan pregnancies so health promotion interventions can be implemented contributes to positive outcomes. Planned pregnancies have been demonstrated to result in better outcomes for women and their infants (70). However, only half of women who were not trying to become pregnant were using contraception. CDC recommends that risk assessment and health education be a part of primary care visits for women of reproductive age and that a prepregnancy check-up be incorporated as a component of maternity care that is covered by insurance (1). Results from this report indicate that few women are benefiting from such preventive services; less than one third of women reported that they had talked to a health-care provider about preparing for a healthy pregnancy. Expanding access to preconception counseling by a health-care provider is critical to achieve the goal of allowing all women to enter pregnancy in optimal health. Another important indicator of access to preventive services is the use of oral health-care services. Good oral health and dental visits before pregnancy might help reduce the number of preterm births and low birth weight infants (37--39). More than three fourths of women in PRAMS reporting areas that assessed prepregnancy dental visits had been to a dentist at some point before their most recent pregnancy. Similar to other health-care service indicators, prevalence varied by maternal characteristics, with high-risk groups having the lowest level of service utilization. Preconception Health ConditionsIn addition to addressing risk behaviors, an aim of preconception care is to identify and provide appropriate management of chronic diseases that might affect women's health during and after pregnancy and have a lifetime impact on infants. The results of this analysis confirm that a substantial proportion of women have medical conditions in the preconception period that could have an adverse effect on pregnancy outcomes. Among prepregnancy medical conditions studied, the highest prevalence was for being overweight and underweight, followed by having anemia, asthma, hypertension, and diabetes. Prevalence of these chronic conditions varied by maternal characteristics. Similar findings have been reported among the general population, with higher rates among minority women and those with low incomes (71). Although PRAMS data cannot be used to assess whether these factors are being medically managed in the preconception period, they highlight the importance of women receiving quality care before pregnancy and the need for proper management of chronic diseases before pregnancy occurs. Postpartum Behaviors and ExperiencesThe interconception period provides an opportunity to identify and address known risk factors from prior pregnancies (e.g., a previous infant death, fetal loss, low birth weight, or preterm birth) and to implement interventions to reduce the risk for women experiencing the same adverse pregnancy outcome again. Interventions can be targeted to women with a previous adverse outcome and those with risk factors such as tobacco use, low folic acid intake, alcohol use, obesity, and diabetes. The findings in this report underscore the importance of interconception care, especially for women with previous adverse outcomes. Risk Behaviors and Experiences The same risk behaviors (e.g., smoking and not using contraception) and protective behaviors (e.g., visiting a health-care provider) often continue (or resume) in the postpartum period. In general, this report demonstrates that negative behaviors are less prevalant in the postpartum period than in the prepregnancy period. Even so, postpartum health-care visits offer another opportunity to address medical risk factors, promote behavioral change, provide prevention services, and link women with appropriate clinical and public health programs. For example, preventing tobacco use in the postpartum period might improve future reproductive outcomes; tobacco use during pregnancy is a risk factor for multiple complications, including placenta previa, abruption placentae, preterm birth, and low birth weight (3,4,72). Women who smoke could benefit from interconception clinical and public health services on tobacco use cessation to reduce risks to them, their infants, and to future children should they become pregnant again. Similarly, use of effective contraception is an important determinant of unintended pregnancy, and offering contraception services to women postpartum is important for planning future pregnancies. Birth spacing has been demonstrated repeatedly to reduce adverse events for women and infants (73), and almost 90% of women reported using some form of contraception in the 2--9 months after delivery. Postpartum depression threatens a woman's health and the social, emotional, and cognitive development of her child (74). Thus, identifying and treating postpartum depression in the interconception period is important for the mother and her family. The data presented in this report indicate that 15.7% of women with recent deliveries reported experiencing symptoms of postpartum depression; this percentage is slightly higher than other estimates of postpartum depression (75). If women are screened for postpartum depression at a postpartum health-care visit, numerous treatment options that are available can be offered (76). More than three fourths of women reported using postpartum health services. At least 85% of women in 10 reporting areas attended a postpartum check up, and over three fourths of women in four reporting areas received postpartum contraceptive counseling. This represents an important opportunity for health-care providers to reach women during the interconception period. Poor Birth OutcomesThe data presented in this report indicate that as many as one in 10 women have had a poor birth outcome and are candidates for interventions to improve maternal health during the interconception period. These findings are similar to national estimates published by the National Center for Health Statistics (77). Certain subgroups of women (i.e., black women, women whose most recent pregnancy was unintended, and those who had Medicaid coverage before pregnancy or at delivery) displayed higher rates of previous low birth weight and preterm deliveries. This finding underscores the need for preconception clinical and public health services and programs targeted towards subpopulations of women who are identified to be at risk for poor birth outcomes. DisparitiesThe data presented in this report indicate the existence of disparities by maternal characteristics, particularly differences in behaviors, health conditions, and utilization of care. For each indicator studied, results varied by age group, race/ethnicity, pregnancy intention, and health insurance status; no one group was consistently at highest risk. For example, white women reported the highest prevalence of prepregnancy and postpartum tobacco use and prepregnancy alcohol use. Women aged <20 years had the highest prevalence of many risk behaviors and health conditions (e.g., tobacco use before and after pregnancy, experiencing abuse and high levels of stress before pregnancy, being underweight, being anemic, and experiencing postpartum symptoms of depression) examined in this report. Conversely, these women were more likely to have postpartum contraceptive use counseling and use contraceptives postpartum. Women aged 20--34 years and women aged >35 years had higher prevalence of being overweight and obese than women aged <20 years. Older women, particularly those aged >35 years, also had the highest prevalence of protective behaviors such as taking a multivitamin before pregnancy and utilizing health services (e.g., dental visits, preconception health counseling, and postpartum visits). These findings are similar to those reported previously (69,78). Black women reported the highest prevalence of prepregnancy stress, overweight, hypertension, anemia, and giving birth to recent low birth weight infants and preterm infants. Black and Hispanic women were more likely than white women and women of other races to experience prepregnancy physical abuse, prepregnancy diabetes, and the birth of a previous low birth weight infant. Such differences have been reported previously (79--81). Culturally appropriate interventions to improve preconception and interconception health care among minority women should be explored as a mechanism to reduce persistent disparities in maternal and infant health (82,83). Women with an unintended pregnancy had consistently higher prevalences for negative behaviors, experiences, and conditions. These findings are consistent with the results from other studies on unintended pregnancy (70,84). Because women who have received preconception health promotion interventions are more likely to have intended pregnancies (85), women should be encouraged to work with their partners, health-care providers, and public health programs to implement a reproductive life plan to ensure optimal timing and health for pregnancy (1). Women with private health insurance were more likely to report positive behaviors and experiences, including multivitamin use, postpartum social support, and access to services (e.g., prepregnancy and postpartum dental visits, prepregnancy health counseling, postpartum check-up, and postpartum contraceptive counseling). Medicaid and other funding programs can play an important role in addressing the access gap and providing continuity of care. A lack of financial coverage for the health-care component of preconception care is a major barrier to implementation. Women with Medicaid coverage before the current pregnancy might constitute a high-risk population that can be targeted for preconception care services such as screening and counseling (86). LimitationsThe findings presented in this report are subject to a number of limitations. First, because PRAMS does not have data on all reproductive-age women, only on women who recently gave birth to a live infant in the selected PRAMS reporting areas, the prevalence estimates for indicators in this report cannot be generalized to the entire population of reproductive-age women. Second, the data reflect only certain behaviors and risks shortly before, during, and after pregnancy; the 28 indicators discussed in this report do not represent the universe of measures related to preconception and interconception care. Preconception indicators focus only on the 1--12 months before pregnancy, and interconception indicators are based on postpartum behaviors and experiences 2--9 months after the birth of a live infant. This is a period when behaviors might change because of pregnancy intention and heightened concerns about health. The value of the data for monitoring the impact of interventions might be limited by the short timeframe of data collection; however observing changes in risk factors in the time surrounding pregnancy might provide information about the impact of population-based interventions. Third, PRAMS does not collect data on men, who are important contributors to reproductive health. Fourth, PRAMS survey data are self-reported, so negative behaviors might be underestimated and positive behaviors overestimated; variables such as height, weight, or reported medical conditions cannot be confirmed. Finally, limitations exist with respect to certain indicators. For example, the prepregnancy dental question does not specify during what period before pregnancy a women might have visited the dentist. For the diabetes indicator, preliminary results from a PRAMS questionnaire evaluation have demonstrated that women do not differentiate well between the two questions on the PRAMS survey related to prepregnancy diabetes and gestational diabetes, resulting in ambiguity as to whether women had prepregnancy or gestational diabetes (Research Triangle Institute, unpublished data, 2007). This is important to note because recommendations for care of women with prepregnancy and gestational diabetes differ (25). Regarding WIC enrollment, what percentage of women were actually eligible for these services is not known. Despite these limitations, PRAMS data are a valuable source of information regarding maternal and infant health indicators, many of which are not collected elsewhere. ConclusionsTargeted and accessible public health and clinical services are needed to improve women's health and the health of their infants. The findings discussed in this report document the need for clinical and public health preconception and interconception services to ensure that all women have access to health care and are able to enjoy the potential benefits of evidence-based interventions. PRAMS data have been used previously to gain support for a wide range of programs and initiatives aimed at improving the health of women and infants around the time of pregnancy, not only in the preconception and interconception periods (87). The data presented in this report can be used to track progress in implementing CDC's 2006 recommendations to improve preconception health and health care and to identify areas in need of policy and programmatic improvements. Further analyses are needed to better understand the impact of specific indicators on health outcomes for women and their infants. References
* These 39 sites are Alabama, Alaska, Arkansas, Colorado, Delaware, Florida, Georgia, Hawaii, Illinois, Louisiana, Maine, Maryland, Massachusetts, Michigan, Minnesota, Mississippi, Missouri, Nebraska, New Jersey, New Mexico, New York City, New York State, North Carolina, Ohio, Oklahoma, Oregon, Pennsylvania, Rhode Island, South Carolina, South Dakota Tribal, Tennessee, Texas, Utah, Vermont, Virginia, Washington, West Virginia, Wisconsin, and Wyoming. † These 26 sites are Alaska, Arkansas, Colorado, Florida, Georgia, Hawaii, Illinois, Louisiana, Maine, Maryland, Michigan, Minnesota, Mississippi, Nebraska, New Jersey, New Mexico, New York City, North Carolina, Oklahoma, Oregon, Rhode Island, South Carolina, Utah, Vermont, Washington, and West Virginia. § Data from Georgia represent births during February--December, and data from New York City and West Virginia represent births during July--December. ¶ The difference between prepregnancy and delivery health insurance reflects the fact that prepregnancy health insurance questions allowed for the categorization of women into a "no health insurance" group whereas the health insurance-at-delivery question asked about source of payment, with options varying across reporting areas; consequently, women could not consistently be classified as having "no health insurance." Women who reported that they received both Medicaid and private health insurance during either period were included in the private health insurance group (54).
Pregnancy Risk Assessment Monitoring System (PRAMS) Working Group Alabama, Albert Woolbright, PhD; Alaska, Kathy Perham-Hester, MS, MPH; Arkansas, Mary McGehee, PhD; Colorado, Alyson Shupe, PhD; Delaware, Charlon Kroelinger, PhD; Florida, Jamie Fairclough, MPH; Georgia, Carol Hoban, MS, MPH; Hawaii, Sharon Sirling; Illinois, Theresa Sandidge, MA; Louisiana, Joan Wightkin; Maine, Kim Haggan; Maryland, Diana Cheng, MD; Massachusetts, Hafsatou Diop, MD, MPH; Michigan, Violanda Grigorescu MD, MSPH; Minnesota, Jan Jernell; Mississippi, Vernesia Wilson, MPH; Missouri, Venkata Garikapaty, MSc, MS, PhD, MPH; Montana, JoAnn Dotson; Nebraska, Jennifer Severe-Oforah; New Jersey, Lakota Kruse, MD; New Mexico, Eirian Coronado; New York State, Anne Radigan-Garcia; New York City, Candace Mulready-Ward, MPH; North Carolina, Paul Buescher, PhD; North Dakota, Sandra Anseth; Ohio, Lily Tatham; Oklahoma --Dick Lorenz; Oregon, Kenneth Rosenberg, MD; Pennsylvania, Kenneth Huling; Rhode Island, Sam Viner-Brown, PhD; South Carolina, Jim Ferguson, DrPH; South Dakota Tribal, Christine Rinki, MPH; Texas, Eric Miller, PhD; Tennessee, David Law, PhD; Utah, Laurie Baksh; Vermont, Peggy Brozicevic; Virginia, Michelle White; Washington, Linda Lohdefinck; West Virginia, Melissa Baker, MA; Wisconsin, Katherine Kvale, PhD; Wyoming, Angi Crotsenberg; PRAMS Team, Applied Sciences Branch, Division of Reproductive Health, CDC. Table 1 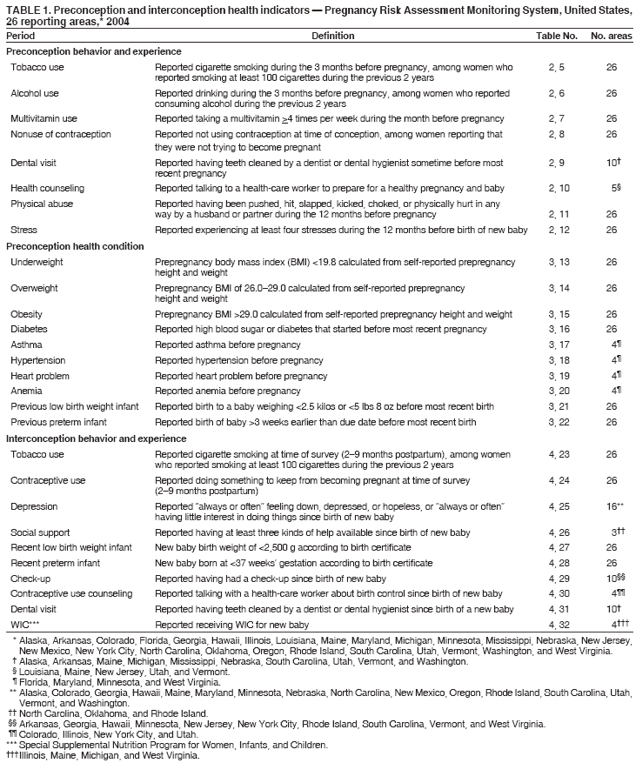 Return to top. Table 2  Return to top. Table 3  Return to top. Table 4  Return to top. Table 5  Return to top. Table 6  Return to top. Table 7 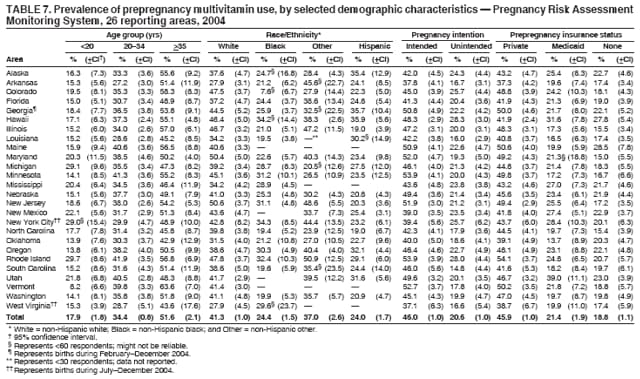 Return to top. Table 8  Return to top. Table 9  Return to top. Table 10  Return to top. Table 11  Return to top. Table 12  Return to top. Table 13  Return to top. Table 14  Return to top. Table 15  Return to top. Table 16  Return to top. Table 17  Return to top. Table 18  Return to top. Table 19  Return to top. Table 20  Return to top. Table 21  Return to top. Table 22  Return to top. Table 23  Return to top. Table 24  Return to top. Table 25  Return to top. Table 26  Return to top. Table 27  Return to top. Table 28  Return to top. Table 29  Return to top. Table 30  Return to top. Table 31  Return to top. Table 32  Return to top. Figure  Return to top. Box 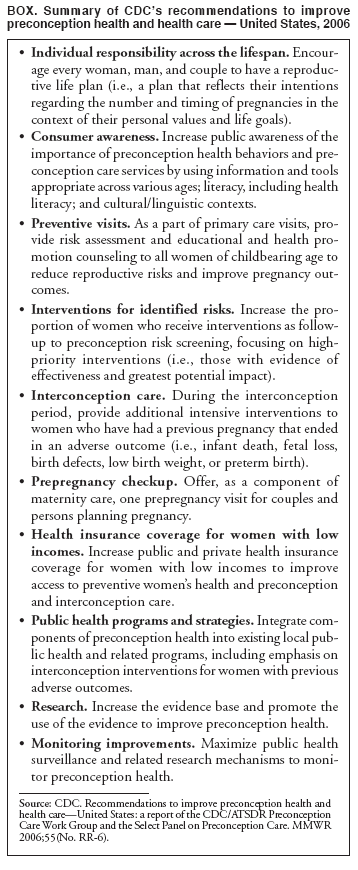 Return to top.
Disclaimer All MMWR HTML versions of articles are electronic conversions from ASCII text into HTML. This conversion may have resulted in character translation or format errors in the HTML version. Users should not rely on this HTML document, but are referred to the electronic PDF version and/or the original MMWR paper copy for the official text, figures, and tables. An original paper copy of this issue can be obtained from the Superintendent of Documents, U.S. Government Printing Office (GPO), Washington, DC 20402-9371; telephone: (202) 512-1800. Contact GPO for current prices. **Questions or messages regarding errors in formatting should be addressed to mmwrq@cdc.gov.Date last reviewed: 11/29/2007 |
|||||||||
|