 |
|
|
|
|
|
|
| ||||||||||
|
|
|
|
|
|
|
||||
| ||||||||||
|
|
|
|
|
Persons using assistive technology might not be able to fully access information in this file. For assistance, please send e-mail to: mmwrq@cdc.gov. Type 508 Accommodation and the title of the report in the subject line of e-mail. Trends in Blood Lead Levels Among Children --- Boston, Massachusetts, 1994--1999Data from the National Health and Nutrition Examination Survey and national childhood blood lead surveillance data from 19 states indicated that average blood lead levels (BLLs) in young children decreased during the late 1990s (1--3). The proportion of children tested who had BLLs >10 µg/dL declined from 10.5% in 1996 to 7.6% in 1998, although the proportion was higher in certain counties (3). To determine whether a similar decline had occurred in Boston, Massachusetts, where a high proportion of children are tested each year, and whether any changes were similar in high- and low-risk neighborhoods, CDC, in collaboration with the Boston Childhood Lead Poisoning Prevention Program (BCLPPP) performed an analysis of BLLs among children aged 6--72 months in Boston during 1994--1999. The results indicate that BLLs in Boston declined during this period, but because of the geographic variation in lead exposure, continued surveillance will be necessary to eliminate childhood lead poisoning. Private laboratories are mandated by Massachusetts law to report all blood lead test results to the state laboratory. BCLPPP receives all blood lead test results for Boston residents from the state laboratory. Massachusetts lead screening regulations require that health-care providers screen children at age 9--12 months and annually up to age 48 months. Children at high risk for lead poisoning are screened every 6 months during ages 6 months--3 years and annually from ages 3--6 years. The proportion of children tested who had BLLs >10 µg/dL and >20 µg/dL by fiscal year (FY) from July 1, 1993, through June 30, 1999, was computed. Children were counted once in each FY in which they had at least one blood lead test, and the highest test result in a given FY was considered in the analysis. Because sample contamination of a capillary test can result in a slight over-estimation of BLLs, only tests performed on venous samples with BLLs >10 µg/dL were considered in the numerator, and tests using both venous and capillary samples were used in the denominator (4,5). Massachusetts Institute for Social and Economic Research data were used to estimate the population of children aged <6 years for 1994 and 1998 (4). U.S. census data from 1990 were used to characterize 16 Boston neighborhoods by ZIP code according to factors that may indicate risk for lead exposure (e.g., percentage of pre-1950 housing, minority children, and children aged <6 years living in poverty). Housing parcel information was obtained from tax assessor data. The number of children aged 6--72 months screened annually in Boston declined 23%, from 35,304 (73.3% of the population aged <6 years) in 1994 to 27,233 (61.6% of population aged <6 years) in 1999 (Figure 1). However, screening among children aged 9--48 months remained high (82% during FY 1999). During 1994--1999, the overall prevalence of children with BLLs >10 µg/dL declined 45%, from 9.3% (3265) to 5.1% (1398). The prevalence of children with BLLs >20 µg/dL declined 66%, from 1.5 % (545) to 0.5% (140) (Figure 1). Neighborhoods with prevalence rates in the upper tertile in 1994 had a higher percentage of children living in poverty, Spanish-speaking households, and vacant parcels than neighborhoods with lower prevalence rates (Table 1). Overall, about two thirds of houses were built before 1950, and no substantial differences were found in the proportion of houses built before 1950 between the highest and lowest risk neighborhoods. The prevalence of elevated BLLs declined from 1994 to 1999 in all 16 neighborhoods, with the highest absolute average decline (4.8%) in neighborhoods with the highest prevalence in 1994. In 1999, six high-risk neighborhoods accounted for 80% of children with elevated BLLs, approximately the same as in 1994 (83%). The decline in prevalence of elevated BLLs during 1994--1999 was similar across age groups: 51% among children aged <12 months, 42% among children aged 12--36 months, and 46% among children aged 36--72 months. Reported by: S Franco, MS, Childhood Lead Poisoning Prevention Program, Boston Public Health Commission, Boston, Massachusetts. Lead Poisoning Prevention Br, Div of Environmental Hazards and Health Effects, National Center for Environmental Health, CDC. Editorial Note:The findings in this report indicate that the prevalence of elevated BLLs in Boston declined consistently during 1994--1999, similar to declines reported from 19 states (3). Building of new houses and remodeling of older houses that removed lead painted building components, such as windows, may have contributed to this decrease (6). In addition, under the Massachusetts Lead Law*, BCLPPP has required property owners to correct lead paint hazards in dwellings occupied by children aged <6 years. Since 1985, approximately 6800 de-leading code enforcement activities have occurred in Boston, and the law has encouraged many additional property owners to comply with de-leading activities (BCLPPP, unpublished data, 2000). Although BLLs have declined in all Boston neighborhoods, levels remained higher in 1999 in the areas with the highest levels in 1994. These high-risk neighborhoods are characterized by higher proportions of minority children, children living in poverty, and vacant properties; a high proportion of old housing, likely to have leaded paint, is found in all neighborhoods. Low socioeconomic status and associated deterioration of older housing are major contributors to lead exposure in Boston (7). The findings in this report are subject to at least four limitations. First, reporting of blood lead test results varied among different laboratories; therefore, results may not be uniform. Second, children at high risk for blood lead poisoning also may have high screening rates. Third, this analysis does not include lead exposure measures associated with the children in the study; as a result, the prevalence rates in the population screened may not be representative of all children in Boston. Finally, the use of older housing and demographic information (i.e., census and tax assessor data) may not reflect changes in some Boston neighborhoods. Approximately 1300 children in Boston are identified annually with BLLs >10 µg/dL, levels high enough to adversely affect cognitive development and behavior. One of the national health objectives for 2010 is to eliminate childhood lead poisoning (8). Because of the substantial geographic variation in lead exposure, continued use of blood lead data for surveillance purposes will be essential in Boston and other jurisdictions to focus resources on high-risk neighborhoods and to achieve the health objective. References
* 105 Code of Massachusetts Regulations 460.700. Table 1  Return to top. Figure 1 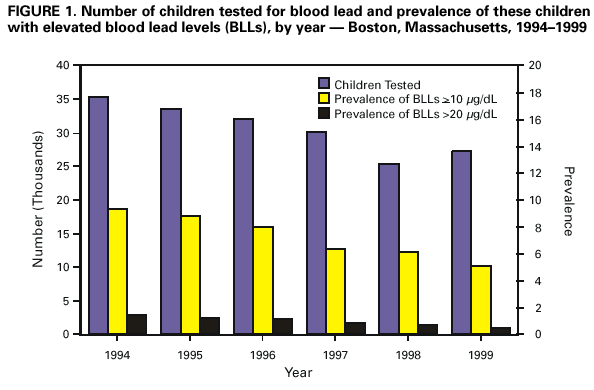 Return to top. Disclaimer All MMWR HTML versions of articles are electronic conversions from ASCII text into HTML. This conversion may have resulted in character translation or format errors in the HTML version. Users should not rely on this HTML document, but are referred to the electronic PDF version and/or the original MMWR paper copy for the official text, figures, and tables. An original paper copy of this issue can be obtained from the Superintendent of Documents, U.S. Government Printing Office (GPO), Washington, DC 20402-9371; telephone: (202) 512-1800. Contact GPO for current prices. **Questions or messages regarding errors in formatting should be addressed to mmwrq@cdc.gov.Page converted: 5/3/2001 |
|||||||||
This page last reviewed 5/3/2001
|