 |
|
|
|
|
|
|
| ||||||||||
|
|
|
|
|
|
|
||||
| ||||||||||
|
|
|
|
|
Persons using assistive technology might not be able to fully access information in this file. For assistance, please send e-mail to: mmwrq@cdc.gov. Type 508 Accommodation and the title of the report in the subject line of e-mail. Blood Lead Levels -- United States, 1988-1991Since the late 1970s, ongoing contamination of the U.S. environment by lead has been substantially reduced as major uses of lead in house paint, gasoline, water-distribution systems, and food cans have been eliminated or reduced (1). During the 1980s, blood lead data from both selected populations and convenience samples indicated a continuation of the decline in blood lead levels (BLLs) (2) observed during 1976-1980 during the Second National Health and Nutrition Examination Survey (NHANES II) (3). However, research during the past two decades has demonstrated adverse health effects at BLLs previously considered to be safe (1). This report summarizes estimates of BLLs in the U.S. population from Phase 1 of the Third National Health and Nutrition Examination Survey (NHANES III), compares these estimates to those from NHANES II, and examines demographic patterns of BLLs among children aged 1-5 years (4,5). NHANES III is a population-based survey of the health and nutritional status of the civilian, noninstitutionalized U.S. population during 1988-1994. Phase 1 data were collected during October 1988-October 1991. Because blacks and Mexican-Americans * were oversampled, reliable prevalence estimates could be obtained for non-Hispanic black and non-Hispanic white persons and for Mexican-Americans but not for other racial/ethnic groups. Household interviews and physical examinations were conducted in a mobile examination center. A 1 mL sample of whole blood was obtained from each participant aged greater than 1 year. Lead content in whole blood was measured by graphite furnace atomic absorption spectrophotometry at CDC. Lead levels below the limit of detection of 1 ug/dL were assigned a level of 0.5 ug/dL. Software for Survey Data Analysis (SUDAAN) was used to calculate estimated means, prevalences, and standard errors that accounted for the sample weights and complex sample design. For the U.S. population, the geometric mean (GM) BLL during 1988-1991 was 2.8 ug/dL (95% confidence interval {CI}=2.7-3.0), a 78% decline in the estimated GM BLL since 1976-1980. The decrease in GM BLL was similar across age groups (Figure_1). As a result, the cross-sectional age trend in GM BLLs remained virtually unchanged: the highest GM BLLs were among persons aged 1-2 years (4.1 ug/dL), and the lowest were among persons aged 12-19 years (1.6 ug/dL). Among persons aged 20-74 years, GM BLL levels increased gradually with age. The prevalence of BLLs greater than or equal to 10 ug/dL among children aged 1-5 years decreased substantially, from 88.2% during NHANES II to 8.9% during NHANES III, Phase 1. The prevalence of elevated BLLs varied by race/ethnicity, income, and residence (Figure_2). For example, an estimated 35% of non-Hispanic black children who were poor (i.e., household income less than 1.3 times the poverty level **) and lived in the central city of a standard metropolitan statistical area had BLLs greater than or equal to 10 ug/dL, compared with 5% of nonpoor, non-Hispanic white children living outside of central cities. The prevalences of BLLs exceeding higher thresholds among children also decreased. In NHANES II, 53% of children aged 1-5 years had BLLs greater than or equal to 15 ug/dL, and 9.3% had BLLs greater than or equal to 25 ug/dL. In NHANES III, the prevalences of children exceeding these same levels decreased to 2.7% (90% CI=1.7%-3.8%) and 0.5% (90% CI=0.1%-0.9%), respectively. Reported by: Div of Health Examination Statistics, National Center for Health Statistics; Div of Environmental Health Laboratory Sciences and Div of Environmental Hazards and Health Effects, National Center for Environmental Health, CDC. Editorial NoteEditorial Note: The findings in this report indicate that the reduction in lead exposure documented during the late 1970s (3) continued during the 1980s. Reduction in at least two exposure sources probably contributed most to this decline. First, the amount of lead used in gasoline declined by 99.8% from 1976 to 1990 (6). Second, the percentage of food and soft-drink cans manufactured in the United States that contained lead solder declined from 47% in 1980 to 0.9% in 1990 (7); these two source reductions have been associated with a reduction of lead in the typical U.S. diet (8). In addition, reduction in leaded gasoline probably has resulted in the reduction of the lead content of dust in and around homes. Other factors contributing to reduced lead exposure include the ban on leaded paint for residential use, promulgation of a standard for lead exposure in industry, the ban on lead-containing solder in household plumbing, ongoing screening of children and educational efforts, and lead paint abatement programs in some jurisdictions. In addition, the number of occupied dwellings built before 1940, when lead-based paint was commonly used, decreased from 24.2 million (30.3% of dwellings) in 1980 to 20.8 million (22.2% of dwellings) in 1989 (9,10). The impact of these changes on BLLs, although substantial for selected persons and subpopulations, is unclear for the population as a whole. Because the developing nervous system is particularly sensitive to lead toxicity, reducing lead exposure among infants, toddlers, and preschool children is of particular concern. The findings in this report indicate that, despite a dramatic decline in lead exposure among children, approximately 1.7 million children aged 1-5 years still have BLLs at a level (i.e., greater than or equal to 10 ug/dL) that can affect cognitive development (1). Poor, non-Hispanic black children, who reside disproportionately in center cities, are at increased risk for harmful BLLs. The demographic pattern of elevated BLLs in children probably reflects, in part, the distribution of two remaining reservoirs of lead contamination: 1) deteriorated leaded paint in older housing and 2) urban soil and dust contaminated by past emissions of leaded gasoline and by exterior paint on dwellings and other structures (1). Further reduction in BLLs among children will require reducing exposure to lead from these reservoirs, including programs to safely correct lead hazards in housing and to reduce contact with lead-contaminated soil and dust. In addition, continued enforcement of existing standards to reduce lead exposure from other sources (e.g., drinking water and contaminated dust brought home by lead-exposed workers) should continue. Because elimination of remaining lead exposure sources will take many years, ongoing education of the public is needed about sources of lead exposure and how to avoid them. Finally, young children should be screened according to CDC guidelines to identify those children who develop BLLs high enough to require individualized environmental and medical intervention. References
* Persons residing in survey-sample households who reported their national origin or ancestry as Mexican/Mexican-American. ** Poverty statistics are based on definitions originated by the Social Security Administration in 1964, subsequently modified by the federal interagency committees in 1969 and 1980, and prescribed by the Office of Management and Budget as the standard to be used by federal agencies for statistical purposes. Figure_1  Return to top. Figure_2 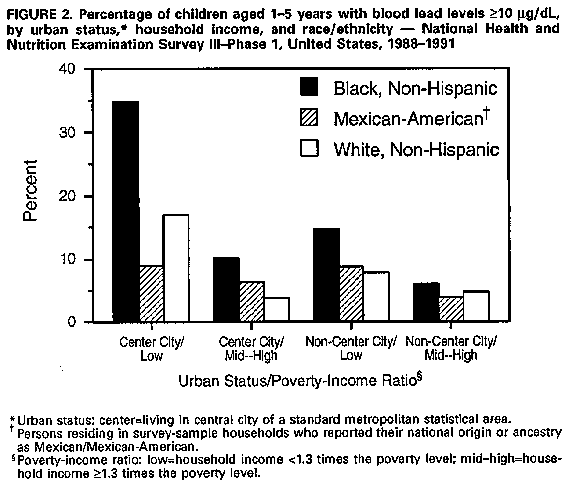 Return to top. Disclaimer All MMWR HTML versions of articles are electronic conversions from ASCII text into HTML. This conversion may have resulted in character translation or format errors in the HTML version. Users should not rely on this HTML document, but are referred to the electronic PDF version and/or the original MMWR paper copy for the official text, figures, and tables. An original paper copy of this issue can be obtained from the Superintendent of Documents, U.S. Government Printing Office (GPO), Washington, DC 20402-9371; telephone: (202) 512-1800. Contact GPO for current prices. **Questions or messages regarding errors in formatting should be addressed to mmwrq@cdc.gov.Page converted: 09/19/98 |
|||||||||
This page last reviewed 5/2/01
|