 |
|
|
|
|
|
|
| ||||||||||
|
|
|
|
|
|
|
||||
| ||||||||||
|
|
|
|
|
Persons using assistive technology might not be able to fully access information in this file. For assistance, please send e-mail to: mmwrq@cdc.gov. Type 508 Accommodation and the title of the report in the subject line of e-mail. Blood Lead Levels in Young Children ---United States and Selected States, 1996--1999Lead exposure adversely affects the cognitive development and behavior of young children (1). For children aged <6 years, CDC has defined an elevated blood lead level (BLL) as >10 µg/dL, but evidence exists for subtle effects at lower levels (2). Data from CDC's Third National Health and Nutrition Examination Survey, Phase 2 (1991--1994) (NHANES) showed that average BLLs in children had decreased approximately 80% since the late 1970s but that elevated BLLs remained more common among low-income children, urban children, and those living in older housing (3,4). Although these data provide national estimates of the prevalence of elevated BLLs among children, they do not provide information at the state or local level. To target prevention efforts and monitor progress toward reducing BLLs at the state and local level, CDC's Childhood Blood Lead Surveillance (CBLS) program supports state blood lead surveillance programs on the basis of blood lead tests from public and private clinical laboratories. This report summarizes data on BLLs in children aged 1--5 years from NHANES data collected in 1999 and children aged <6 years from state surveillance data provided to CDC by 19 state surveillance programs during 1996--1998. The findings indicate that, despite the decreases in mean BLL among children, the problem remains concentrated on a local level. Surveillance efforts should be used to target screening efforts to communities at highest risk. NHANES is a continuous survey of the health and nutritional status of the U.S. civilian, noninstitutionalized population designed so that each year of data constitutes a nationally representative sample. Data in this report are from NHANES 1999, and NHANES III, Phase 2. A household interview and a physical examination were conducted for each survey participant. During the physical examination, blood was collected by venipuncture for all persons aged >1 year. Graphite furnace atomic absorption spectrophotometry was used to measure BLLs with detection limits of 0.3 µg/dL (NHANES 1999) and 1.0 µg/dL (NHANES III, Phase 2). Long-term quality-control data for these analyses, including similar standardized reference materials, were used in both surveys and showed that data from the two surveys can be compared. Because of limited sample size, NHANES 1999 analyses include only data on average BLLs and selected percentiles but not on the prevalence of elevated levels. The analyses of CBLS data were based on reports from 19 of 28 states that provided blood lead data to CDC (Table 1). The 19 states were included because they received all blood lead test results of children from participating laboratories (regardless of level) and reported data from January 1, 1996 through December 31, 1998. These states accounted for 33% of all U.S. children aged <6 years. An elevated BLL from CBLS is defined as a single blood lead test result >10 µg/dL. If multiple tests were reported for a child during a calendar year, the highest BLL measured for that child was used. To estimate the proportion of children with elevated BLLs among those tested, the number of children with elevated levels was divided by the number of children tested at least once during a calendar year. From NHANES III, Phase 2 (1991--1994) to NHANES 1999, the geometric mean BLL in children aged 1--5 years decreased from 2.7 (95% confidence interval [CI]=2.6--2.9) to 2.0 µg/dL (95% CI=1.7--2.3), and the 50th percentile decreased from 2.6 (95% CI=2.4--2.8) to 1.9 µg/dL (95% CI=1.6--2.1). The continued pattern of decline in BLLs between the two surveys also is indicated at the 10th, 25th, 75th, and 90th percentiles. The CBLS data showed that the proportion of children tested with BLLs >10 µg/dL decreased from 10.5% in 1996 to 7.6% in 1998 in the 19 states providing data (Table 1). The proportions of children with BLLs >15 µg/dL and >20 µg/dL also decreased. The percentage of children aged <6 years tested with BLLs >10 µg/dL in each state ranged from 2.7 to 14.9 (Figure 1). Within states, the proportion of children with elevated BLLs in counties with at least 200 children tested also varied considerably. For example, the proportion of children with elevated BLLs ranged from 1.3% to 27.3% in counties in Ohio. Across all 19 states, the county-specific proportions of children with elevated BLLs ranged from 0.5% to 27.3%, indicating a concentrated proportion of elevated BLLs in specific populations or geographic areas. Reported by: JP Lofgren, MD, State Epidemiologist, Alabama Dept of Public Health. M Macias, MHS, Childhood Lead Poisoning Prevention Program, Colorado Dept of Health. S Russakow, Childhood Lead Poisoning Prevention Program, Connecticut Dept of Public Health. R Gergely, B McPartland, Childhood Lead Poisoning Prevention Program, Iowa Dept of Public Health. M Amrich, Childhood Lead Poisoning Prevention Program, Maine Dept of Human Svcs; J Krueger, Maine Health and Environmental Testing Laboratory. M Silverman, I Caceres, MS, Childhood Lead Poisoning Prevention Program, Massachusetts Dept of Health. Michigan Dept of Public Health. J Wooldridge, D Symonik, MS, M Falken, PhD, Childhood Lead Poisoning Prevention Program, Minnesota Dept of Health. M Stout, Butte Silver-Bow County Health Dept, Mt. Lead; T Krantz, Montana Dept of Public Health and Human Svcs. T Ward, E Norman, MPH, Childhood Lead Poisoning Prevention Program, Dept of Environment and Natural Resources, Div of Environmental Health, North Carolina. N Twitchell, C Eccleston, Childhood Lead Poisoning Prevention Program, New Hampshire Dept of Health and Human Svcs. J Raucci, Childhood Lead Poisoning Prevention Program, New York State Dept of Health. T Alexander, I Stevens-Dickerson, MSA, Childhood Lead Poisoning Prevention Program, Ohio Dept of Health. JT Braggio, PhD, A Fletcher, Childhood Lead Poisoning Prevention Program, Oklahoma Dept of Health. W Ball, PhD, Childhood Lead Poisoning Prevention Program, Utah Dept of Health. S Lynn, Childhood Lead Poisoning Prevention Program, Vermont Dept of Health. M Mueller, MES, Lead Surveillance Program, Washington State Dept of Health. MJ Coons, MS, Childhood Lead Poisoning Prevention Program, Wisconsin Div of Public Health. T Klietz, K Musgrave, State Epidemiologist, Wyoming Dept of Health. Lead Poisoning Prevention Br, Div of Environmental Hazards and Health Effects, National Center for Environmental Health; Div of Health Examination Statistics, National Center for Health Statistics, CDC. Editorial Note:The findings in this report indicate that average BLLs of U.S. children aged 1--5 years have declined from the early 1990s to 1999. Because of the limited sample size of a single year of NHANES 1999 compared with that of the multiple years of NHANES III, additional data are necessary to confirm this trend. The dramatic decline in BLLs from the late 1970s through the early 1990s resulted primarily from the phase-out of leaded gasoline and the resulting decrease in lead emissions, although other exposures also decreased (3). Although air lead levels and lead emissions continued to decrease during the 1990s, most of this decline occurred before 1995 (5). The primary remaining sources of childhood lead exposure are deteriorated leaded paint and the soil and dust it contaminates in old housing. The construction of new housing and the demolition and rehabilitation of older housing may be contributing to a continued decline in BLLs. Data from NHANES III, Phase 2 showed that low-income children living in older housing had more than a 30-fold greater prevalence of BLLs >10 µg/dL than do middle- income children in newer housing (4). From 1993 to 1997, the number of low-income children living in pre-1940s and 1940--1974 housing declined by 31% and 14%, respectively. The number of low-income children living in post-1974 housing increased by 5% (6). Despite the overall decline in average BLLs, CBLS data show that the risk for elevated BLLs in children tested remains high in some counties and varies greatly among and within states. This variation most likely reflects geographic variation in the prevalence of risk factors for elevated BLLs such as residence in older housing and poverty. The findings in this report are subject to at least four limitations. First, the small NHANES 1999 sample does not permit observing risks in specific subgroups or geographic areas, but it provides a nationally representative estimate of BLLs in children. The CBLS data set provides local information but is limited to children who receive clinical or diagnostic blood lead testing. Second, because CDC guidelines recommend the use of blood lead data and census data to target screening efforts in populations at increased risk for lead exposure, the proportion of children with elevated BLLs is higher in CBLS data than would be expected in NHANES 1999. Third, the guidelines for testing children vary by state, and adherence to the guidelines varies by health-care provider. Finally, CBLS data include samples collected by fingerstick, which can slightly over-estimate the blood lead result, and venous samples and results obtained by different laboratories. Despite these differences, the temporal trends in BLLs are similar between the CBLS and NHANES data sets. One of the national health objectives for 2010 is the elimination of childhood lead poisoning (7). Data in this report document continued progress toward this goal but also show the ongoing need to target prevention efforts at communities and populations at highest risk. CDC recommends that state health agencies target screening efforts by using blood lead surveillance data, census data, Medicaid data, and other sources of information on risk factors such as housing age and poverty (8,9). Other federal agencies, including the U.S. Department of Housing and Urban Development and the U.S. Environmental Protection Agency, also are implementing targeted strategies to prevent lead exposure. State blood lead surveillance systems play a key role in targeting and monitoring federal, state, and local prevention efforts. CDC encourages additional states to conduct surveillance for elevated BLLs in children. References
Table 1 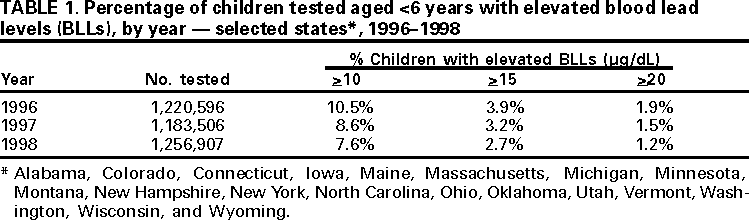 Return to top. Figure 1 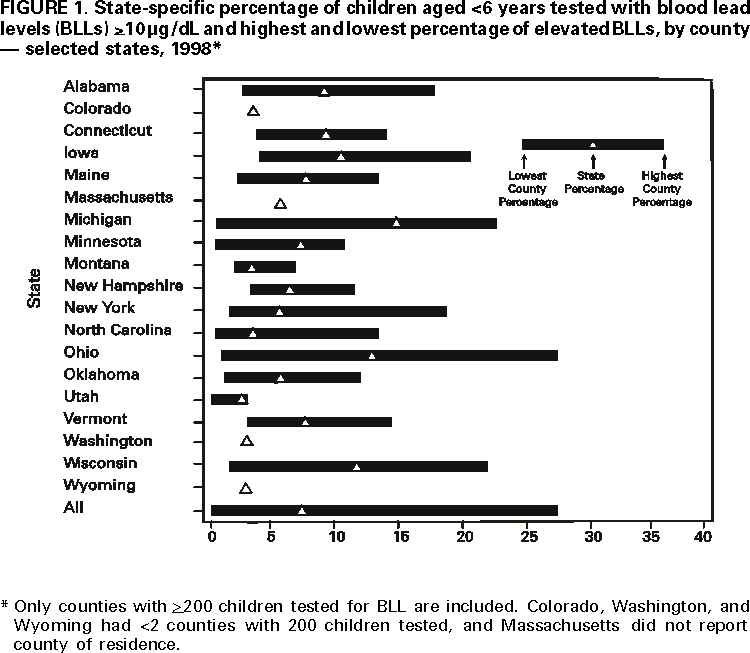 Return to top. Disclaimer All MMWR HTML versions of articles are electronic conversions from ASCII text into HTML. This conversion may have resulted in character translation or format errors in the HTML version. Users should not rely on this HTML document, but are referred to the electronic PDF version and/or the original MMWR paper copy for the official text, figures, and tables. An original paper copy of this issue can be obtained from the Superintendent of Documents, U.S. Government Printing Office (GPO), Washington, DC 20402-9371; telephone: (202) 512-1800. Contact GPO for current prices. **Questions or messages regarding errors in formatting should be addressed to mmwrq@cdc.gov.Page converted: 12/21/2000 |
|||||||||
This page last reviewed 5/2/01
|