
Persons using assistive technology might not be able to fully access information in this file. For assistance, please send e-mail to: mmwrq@cdc.gov. Type 508 Accommodation and the title of the report in the subject line of e-mail.
Update: Influenza Activity --- United States, September 28, 2008--April 4, 2009, and Composition of the 2009--10 Influenza Vaccine
This report summarizes U.S. influenza activity* from September 28, 2008, the start of the 2008--09 influenza season, through April 4, 2009, and reports on the 2009--10 influenza vaccine strain selection. Low levels of influenza activity were reported from October through early January. Activity increased from mid-January and peaked in mid-February. Influenza A (H1N1) viruses have predominated overall this season, but influenza B viruses have been isolated more frequently than influenza A viruses since mid-March. Widespread oseltamivir resistance was detected among circulating influenza A (H1N1) viruses and a high level of adamantane resistance was identified among influenza A (H3N2) viruses.
Viral Surveillance
From September 28, 2008, to April 4, 2009, World Health Organization (WHO) and National Respiratory and Enteric Virus Surveillance System (NREVSS) collaborating laboratories in the United States tested 173,397 respiratory specimens for influenza viruses, 24,793 (14.3%) of which were positive (Figure 1). Of these, 16,686 (67.3%) were positive for influenza A viruses, and 8,107 (32.7%) were positive for influenza B viruses. Of the 16,686 specimens positive for influenza A viruses, 6,735 (40.4%) were subtyped by real-time reverse transcription-polymerase chain reaction or by virus culture; 6,049 (89.8%) of these were influenza A (H1N1) viruses, and 686 (10.2%) were influenza A (H3N2) viruses. The percentage of specimens testing positive for influenza first exceeded the seasonal threshold of 10% during the week ending January 17, 2009, and peaked at 25.0% during the week ending February 14, 2009. For the week ending April 4, 2009, 12.3% of specimens tested for influenza were positive. The relative proportion of influenza B viruses increased during February and March, and since the week ending March 14, 2009, >50% of the positive influenza specimens have been influenza B.
Antigenic Characterization
WHO collaborating laboratories in the United States are requested to submit a subset of their influenza virus isolates to CDC for further antigenic characterization. CDC has antigenically characterized 945 influenza viruses collected by U.S. laboratories during the 2008--09 season, including 594 influenza A (H1N1), 88 influenza A (H3N2), and 263 influenza B viruses. All 594 influenza A (H1N1) viruses are related to the influenza A (H1N1) component of the 2008--09 influenza vaccine (A/Brisbane/59/2007). All 88 influenza A (H3N2) viruses are related to the influenza A (H3N2) vaccine component (A/Brisbane/10/2007). Influenza B viruses currently circulating can be divided into two distinct lineages represented by the B/Yamagata/16/88 and B/Victoria/02/87 viruses. Among the 263 influenza B viruses tested, 50 (19.0%) belong to the B/Yamagata lineage and are related to the vaccine strain (B/Florida/04/2006); the remaining 213 (81.0%) belong to the B/Victoria lineage and are not related to the vaccine strain.
Composition of the 2009--10 Influenza Vaccine
WHO recommended that the 2009--10 Northern Hemisphere trivalent influenza vaccine contain A/Brisbane/59/2007-like (H1N1), A/Brisbane/10/2007-like (H3N2), and B/Brisbane/60/2008-like (B/Victoria lineage) viruses. The Food and Drug Administration's Vaccines and Related Biological Products Advisory Committee recommended these same vaccine strains be included in the 2009--10 influenza vaccine for the United States (1). Only the influenza B component represents a change from the 2008--09 vaccine formulation. These recommendations were based on antigenic and genetic analyses of recently isolated influenza viruses, epidemiologic data, post-vaccination serologic studies in humans, and the availability of candidate vaccine strains and reagents.
Antiviral Resistance of Influenza Virus Isolates
CDC conducts surveillance for resistance of circulating influenza viruses to licensed influenza antiviral medications: adamantanes (amantadine and rimantadine) and neuraminidase inhibitors (zanamivir and oseltamivir). Since October 1, 2008, of the 699 influenza A (H1N1) viruses from 44 states tested for neuraminidase inhibitor resistance, 694 (99.3%) were resistant to oseltamivir; all were sensitive to zanamivir (Table). All 103 influenza A (H3N2) and all 274 influenza B viruses tested were sensitive to oseltamivir and zanamivir. Three influenza A (H1N1) viruses (0.4%) and all 100 (100%) influenza A (H3N2) viruses tested were resistant to adamantanes (amantadine and rimantadine). The adamantanes are not effective against influenza B viruses. None of the influenza A (H1N1) viruses tested were resistant to both oseltamivir and adamantanes.
Novel Influenza A Viruses
A case of human infection with a novel influenza A virus was reported by the Iowa Department of Public Health during the week ending February 28, 2009. A male aged 3 years was infected with a swine influenza A (H1N1) virus. An investigation revealed that the child had close contact with ill pigs. The child has fully recovered from the illness, and no additional cases were identified among the child's contacts or other persons exposed to the ill pigs. This is the third human infection with swine influenza virus identified in the United States this influenza season. None of the cases were related to occupation. The other two human infections with swine influenza identified during the 2008--09 influenza season occurred in a person aged 14 years from Texas and a person aged 19 years from South Dakota (2,3).
State-Specific Activity Levels
During the week ending April 4, 2009, widespread influenza activity† was reported by four states (Alabama, New York, Virginia, and Washington). Regional influenza activity was reported by 18 states (Alaska, Arizona, California, Colorado, Connecticut, Hawaii, Idaho, Kentucky, Montana, Nevada, New Hampshire, New Jersey, North Carolina, North Dakota, Oregon, Pennsylvania, Rhode Island, and Tennessee). Local influenza activity was reported by 20 states, sporadic activity was reported by the District of Columbia and seven states, and one state did not report Regional influenza activity was reported for the first time this season during the week ending December 20, 2008 (by Massachusetts and New Jersey), and widespread activity was reported for the first time during the week ending January 10, 2009 (by Virginia). To date this season, regional or widespread influenza activity has been reported during at least 1 week by 49 states.
Outpatient Illness Surveillance
Since September 28, 2008, the weekly percentage of outpatient visits for influenza-like illness (ILI)§ reported by approximately 1,500 U.S. health-care providers in 50 states, New York City, Chicago, the District of Columbia, and the U.S. Virgin Islands that comprise the U.S. Outpatient ILI Surveillance Network (ILINet), has ranged from 0.9% during the week ending October 4, 2008, to 3.7% for the week ending February 14, 2009. For the week ending April 4, 2009, the weekly percentage of outpatient visits for ILI was 1.6% (Figure 2). This is below the national baseline of 2.4%.¶ One of the nine surveillance regions (Mountain) reported an ILI percentage above its region-specific baseline.
Pneumonia- and Influenza-Related Mortality
For the week ending April 4, 2009, pneumonia and influenza was reported as an underlying or contributing cause of death for 7.4% of all deaths reported through the 122 Cities Mortality Reporting System. This is below the epidemic threshold of 7.8% for that week. Since September 28, 2008, the weekly percentage of deaths attributed to pneumonia and influenza ranged from 6.1% to 7.6%, and remained below the epidemic threshold.**
Influenza-Associated Hospitalizations
Hospitalizations associated with laboratory-confirmed influenza infections are monitored by two population-based surveillance networks, the New Vaccine Surveillance Network (NVSN) and the Emerging Infections Program (EIP).†† From October 12, 2008, to March 21, 2009, the preliminary laboratory-confirmed influenza-associated hospitalization rate for children aged 0--4 years in the NVSN was 1.46 per 10,000.
From October 1, 2008, to March 28, 2009, preliminary rates of laboratory-confirmed influenza-associated hospitalization reported by the EIP for children aged 0--4 years and 5--17 years were 2.8 and 0.5 per 10,000, respectively (Figure 3). For adults aged 18--49 years, 50--64 years, and ≥65 years, the rates were 0.3, 0.4, and 1.0 per 10,000, respectively. Differences in the rate estimates between the NVSN and the EIP systems likely result from the different case-finding methods and the different populations monitored.
Influenza-Associated Pediatric Mortality
Since September 28, 2008, CDC has received 45 reports of influenza-associated pediatric deaths that occurred during the current season. Of the 27 decedents who had specimens collected for bacterial culture from normally sterile sites, 12 (44.4%) were positive; Staphylococcus aureus was identified in eight of the 12 children. Three of the S. aureus isolates were sensitive to methicillin, and five were methicillin resistant. Among the 12 children with bacterial coinfections, all were aged ≥5 years, and 10 (83.3%) were aged ≥12 years. An increase in the number of influenza-associated pediatric deaths with S. aureus coinfections was first recognized during the 2006--07 influenza season (4).
Of the 36 decedents aged >6 months for whom patient vaccination status was known, five (13.9%) had been vaccinated against influenza according to 2008 Advisory Committee on Immunization Practices recommendations (5). These data are provisional and subject to change as more information becomes available.
Reported by: WHO Collaborating Center for Surveillance, Epidemiology, and Control of Influenza. P Peebles, L Brammer, MPH, S Epperson, MPH, L Blanton, MPH, R Dhara, MPH, T Wallis, MS, L Finelli, DrPH, L Gubareva, PhD, J Bresee, MD, A Klimov, PhD, N Cox, PhD, Influenza Div, National Center for Immunization and Respiratory Diseases, CDC.
Editorial Note:
From September 28, 2008, through early January 2009, the United States experienced low levels of influenza activity. Activity increased in mid-January, peaked in mid-February, and remained high until mid-March. Since mid-March, influenza levels have been decreasing nationally.
Preliminary data from the U.S. virologic surveillance networks (WHO and NREVSS collaborating laboratories), the percentage of deaths attributable to pneumonia and influenza, and the percentage of outpatient visits for ILI suggest that this season has been less severe than the 2007--08 season and is more similar to the 2005--06 and 2006--07 seasons. The percentage of specimens tested for influenza that were positive peaked at 25.0% during the week ending February 14, 2009, compared with 31.6% in 2007--08, 27.7% in 2006--07, and 22.6% in 2005--06. To date during this season, the percentage of deaths attributable to pneumonia and influenza peaked at 7.6% and has not exceeded the epidemic threshold. By comparison, pneumonia and influenza mortality peaked at 9.1%, 7.9%, and 7.8% during the 2007--08, 2006--07, and 2005--06 seasons, respectively. The epidemic threshold for pneumonia and influenza deaths was exceeded for 9 consecutive weeks during the 2007--08 season and for only 1 week during both the 2005--06 and 2006--07 seasons. The percentage of outpatient visits for ILI peaked at 3.7% this season, compared with 6.0% in 2007--08, 3.6% in 2006--07, and 3.1% in 2005--06.
During this influenza season, a high level of resistance to the antiviral drug oseltamivir was detected among circulating influenza A (H1N1) viruses. Since October 1, 2008, 99.3% of influenza A (H1N1) viruses tested were resistant to oseltamivir. To date, influenza A has accounted for 67.3% of all influenza viruses identified, and influenza A (H1N1) has accounted for 89.8% of the influenza A viruses that were subtyped. No oseltamivir resistance has been detected among influenza A (H3N2) or B viruses currently circulating in the United States; however, all the influenza A (H3N2) viruses tested were resistant to adamantanes. The adamantanes are not effective against influenza B viruses. None of the influenza A (H1N1) viruses tested were resistant to both oseltamivir and the adamantanes, and all influenza viruses tested this season have been susceptible to zanamivir. CDC issued interim guidelines for the use of influenza antiviral medications on December 19, 2008. Health-care providers should review their local surveillance data if available to determine which types (A or B) and subtypes of influenza A (H1N1 or H3N2) are most prominent in their community and consider using diagnostic tests to distinguish influenza A from influenza B. When an influenza A (H1N1) virus infection or exposure is suspected, zanamivir is the preferred medication; combination therapy of oseltamivir and rimantidine is an acceptable alternative (6).
Since early February, the relative proportion of influenza B viruses has been increasing each week, and more than half of influenza viruses identified since the week ending March 14, 2009, were influenza B. Approximately 80% of influenza B viruses tested have not been related to the influenza B vaccine strain. However, all influenza B viruses this season have been susceptible to oseltamivir and zanamivir. Health-care providers should be aware of these recent increases in influenza B viruses and of the differences in antiviral resistance patterns compared with influenza A (H1N1) viruses. When an influenza B infection or exposure is detected, treatment with oseltamivir or zanamivir is recommended. However, when the type or subtype is unknown, zanamivir is the preferred medication; combination therapy of oseltamivir and rimantidine also is acceptable (6).
To date this season, the cumulative laboratory-confirmed, influenza-associated hospitalization rate reported by EIP among persons aged ≥50 years has been lower than rates reported for the previous three seasons, but most similar to the 2006--07 season. Historically, excess mortality has been lower in seasons during which influenza A (H1N1) or influenza B predominated than during seasons in which influenza A (H3N2) has predominated (7). During the current and 2006--07 seasons, influenza A (H1N1) has been the prominent virus subtype circulating, which could partly explain the lower influenza-associated hospitalization rates among persons aged ≥50 years observed during these two seasons.
Vaccination remains the best method for preventing influenza virus infection and its complications. Influenza vaccination can prevent influenza infections from strains that are sensitive or resistant to antiviral medications. Thus far this season, all the influenza A viruses that have been characterized, including oseltamivir-resistant (H1N1) viruses, are antigenically related to the components in the vaccine. However, approximately 80% of influenza B viruses tested are from a distinct lineage that is not related to the vaccine strain. Limited or no protection is expected when the vaccine and circulating virus strains are from different lineages (8,9). The composition of the 2009--10 influenza vaccine includes the same influenza A (H1N1 and H3N2) components, and a change in the influenza B component from the Yamagata to the Victoria lineage.
Influenza surveillance reports for the United States are posted weekly online at http://www.cdc.gov/flu/weekly/flu
activity.htm during the influenza season from October to mid-May. Additional information regarding influenza viruses, influenza surveillance, the influenza vaccine, and avian influenza is available at http://www.cdc.gov/flu.
Acknowledgments
This report is based, in part, on data contributed by participating state and territorial health departments and state public health laboratories, World Health Organization collaborating laboratories, National Respiratory and Enteric Virus Surveillance System collaborating laboratories, the U.S. Outpatient ILI Surveillance Network, the Emerging Infections Program, the New Vaccine Surveillance Network, the Influenza Associated Pediatric Mortality Surveillance System, and the 122 Cities Mortality Reporting System.
References
- Food and Drug Administration. Influenza virus vaccine 2009--2010 season. Available at http://www.fda.gov/cber/flu/flu2009.htm.
- CDC. Influenza activity---United States and worldwide, September 28--November 29, 2008. MMWR 2008;57:1329--32.
- CDC. Influenza activity---United States, September 28, 2008--January 31, 2009. MMWR 2009;58:115--9.
- Finelli L, Fiore A, Dhara R, et al. Influenza-associated pediatric mortality in the United States: increase of Staphylococcus aureus coinfection. Pediatrics 2008;122:805--11.
- CDC. Recommendations of the Advisory Committee on Immunization Practices (ACIP), 2008. MMWR 2008;57(No. RR-7).
- CDC. CDC issues interim recommendations for the use of influenza antiviral medications in the setting of oseltamivir resistance among circulating influenza A (H1N1) viruses, 2008--09 influenza season. Atlanta, GA: US Department of Health and human services, CDC; 2008. Available at http://www2a.cdc.gov/han/archivesys/viewmsgv.asp?alertnum=00279.
- Thompson WW, Shay DK, Weintraub E, et al. Mortality associated with influenza and respiratory syncytial virus in the United States. JAMA 2003;289:179--86.
- Belongia E, Kieke B, Donahue J, et al. Effectiveness of inactivated influenza vaccines varied substantially with antigenic match from the 2004--2005 season to the 2006--2007 season. J Infect Dis 2009;199:159--67.
- Skowronski D, De Serres G, Dickinson J, et al. Component-specific effectiveness of trivalent influenza vaccine as monitored through a sentinel surveillance network in Canada, 2006--2007. J Infect Dis 2009;199:168--79.
* The CDC influenza surveillance system collects five categories of information from nine data sources: 1) viral surveillance (World Health Organization collaborating U.S. laboratories, the National Respiratory and Enteric Virus Surveillance System, and novel influenza A virus case reporting), 2) outpatient illness surveillance (U.S. Outpatient ILI Surveillance Network), 3) mortality (122 Cities Mortality Reporting System and influenza-associated pediatric mortality reports), 4) hospitalizations (Emerging Infections Program and New Vaccine Surveillance Network), and 5) summary of geographic spread of influenza (state and territorial epidemiologist reports).
† Levels of activity are 1) no activity; 2) sporadic: isolated laboratory-confirmed influenza cases or a laboratory-confirmed outbreak in one institution, with no increase in influenza-like illness (ILI) activity; 3) local: increased ILI, or at least two institutional outbreaks (ILI or laboratory-confirmed influenza) in one region with recent laboratory evidence of influenza in that region; virus activity no greater than sporadic in other regions; 4) regional: increased ILI activity or institutional outbreaks (ILI or laboratory-confirmed influenza) in at least two but less than half of the regions in the state with recent laboratory evidence of influenza in those regions; and 5) widespread: increased ILI activity or institutional outbreaks (ILI or laboratory-confirmed influenza) in at least half the regions in the state with recent laboratory evidence of influenza in the state.
§ Defined as a temperature of ≥100.0°F (≥37.8°C), oral or equivalent, and cough and/or sore throat, in the absence of a known cause other than influenza.
¶ The national and regional baselines are the mean percentage of visits for ILI during noninfluenza weeks for the previous three seasons plus two standard deviations. A noninfluenza week is a week during which <10% of specimens tested positive for influenza. National and regional percentages of patient visits for ILI are weighted on the basis of state population. Use of the national baseline for regional data is not appropriate.
** The seasonal baseline proportion of pneumonia and influenza deaths is projected using a robust regression procedure in which a periodic regression model is applied to the observed percentage of deaths from pneumonia and influenza that were reported by the 122 Cities Mortality Reporting System during the preceding 5 years. The epidemic threshold is 1.645 standard deviations above the seasonal baseline.
†† NVSN conducts surveillance in Monroe County, New York; Hamilton County, Ohio; and Davidson County, Tennessee. NVSN provides population-based estimates of laboratory-confirmed influenza hospitalization rates in children aged <5 years admitted to NVSN hospitals with fever or respiratory symptoms. Children are prospectively enrolled, and respiratory samples are collected and tested by viral culture and reverse transcription-polymerase chain reaction (RT-PCR). EIP currently conducts surveillance for laboratory-confirmed, influenza-related hospitalizations in 61 counties and Baltimore, Maryland. The EIP catchment area includes 13 metropolitan areas: San Francisco, California; Denver, Colorado; New Haven, Connecticut; Atlanta, Georgia; Baltimore, Maryland; Minneapolis/St. Paul, Minnesota; Albuquerque, New Mexico; Las Cruces, New Mexico; Santa Fe, New Mexico; Albany, New York; Rochester, New York; Portland, Oregon; and Nashville, Tennessee. Hospital laboratory, admission, and discharge databases, and infection-control logs are reviewed to identify persons with a positive influenza test (i.e., viral culture, direct fluorescent antibody assays, RT-PCR, serology, or a commercial rapid antigen test) from testing conducted as part of their routine care.
FIGURE 1. Number (N = 24,793) and percentage of respiratory specimens testing positive for influenza reported by World Health Organization and National Respiratory and Enteric Virus Surveillance System collaborating laboratories, by type, and surveillance week - United States, September 28, 2008-April 4, 2009
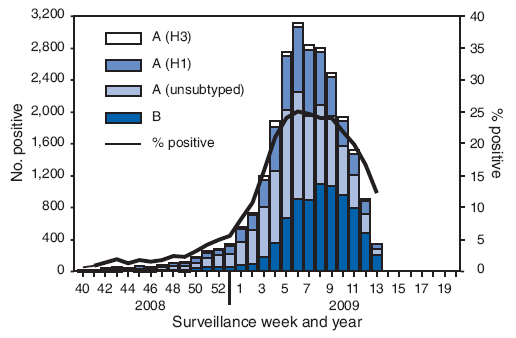
FIGURE 2. Percentage of visits for influenza-like illness (ILI) reported by U.S. Outpatient Influenza-like Illness Surveillance Network (ILINet), by surveillance week - United States, September 28, 2008-April 4, 2009 and 2006-07 and 2007-08 influenza seasons
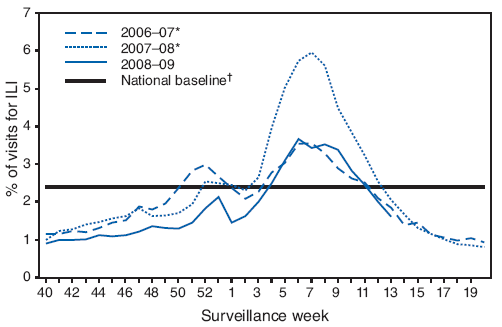
* The 2006-07 and 2007-08 seasons did not have a week 53; therefore the week 53 data point for those seasons is an average of weeks 52 and 1.
† The national and regional baselines are the mean percentage of visits for ILI during noninfluenza weeks for the previous three seasons plus two standard deviations. A noninfluenza week is a week during which <10% of specimens tested positive for influenza. National and regional percentages of patient visits for ILI are weighted on the basis of state population. Use of the national baseline for regional data is not appropriate.
FIGURE 3. Cumulative laboratory-confirmed influenza hospitalization rates,* by age group† and surveillance week - Emerging Infections Program, United States, October 1, 2008-March 28, 2009, and preceding three influenza seasons
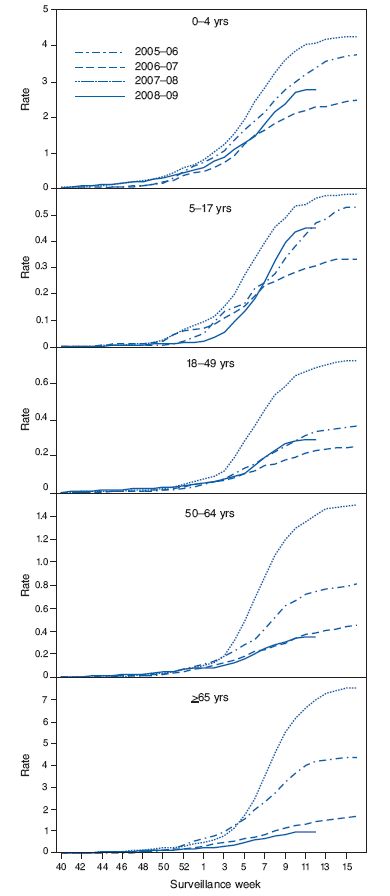
* Per 10,000 population.
† Scales differ among age groups.
Use of trade names and commercial sources is for identification only and does not imply endorsement by the U.S. Department of
Health and Human Services. |
All MMWR HTML versions of articles are electronic conversions from typeset documents. This conversion might result in character translation or format errors in the HTML version. Users are referred to the electronic PDF version (http://www.cdc.gov/mmwr) and/or the original MMWR paper copy for printable versions of official text, figures, and tables. An original paper copy of this issue can be obtained from the Superintendent of Documents, U.S. Government Printing Office (GPO), Washington, DC 20402-9371; telephone: (202) 512-1800. Contact GPO for current prices.
**Questions or messages regarding errors in formatting should be addressed to mmwrq@cdc.gov.Date last reviewed: 4/15/2009