Mortality in the United States, 2022
- Key findings
- How long can we expect to live?
- What are the age-adjusted death rates for race-ethnicity-sex groups?
- Did age-specific death rates in 2022 change from 2021 for those age 1 year and older?
- What are the death rates for the 10 leading causes of death?
- What are the mortality rates for the 10 leading causes of infant death and for infant deaths overall?
Data from the National Vital Statistics System
- Life expectancy for the U.S. population in 2022 was 77.5 years, an increase of 1.1 years from 2021.
- The age-adjusted death rate decreased by 9.2% from 879.7 deaths per 100,000 standard population in 2021 to 798.8 in 2022.
- Age-specific death rates increased from 2021 to 2022 for age groups 1–4 and 5–14 years and decreased for all age groups 15 years and older.
- The 10 leading causes of death in 2022 remained the same as in 2021, although some causes changed ranks. Heart disease and cancer remained the top 2 leading causes in 2022.
- The infant mortality rate was 560.4 infant deaths per 100,000 live births in 2022, an increase of 3.1% from the rate in 2021 (543.6).
This report presents final 2022 U.S. mortality data on deaths and death rates by demographic and medical characteristics. These data provide information on mortality patterns among U.S. residents by variables such as sex, age, race and Hispanic origin, and cause of death. Life expectancy estimates, age-adjusted death rates, age-specific death rates, the 10 leading causes of death, infant mortality rates, and the 10 leading causes of infant death were analyzed by comparing 2022 and 2021 final data (1).
Keywords: life expectancy, leading cause, National Vital Statistics System
How long can we expect to live?
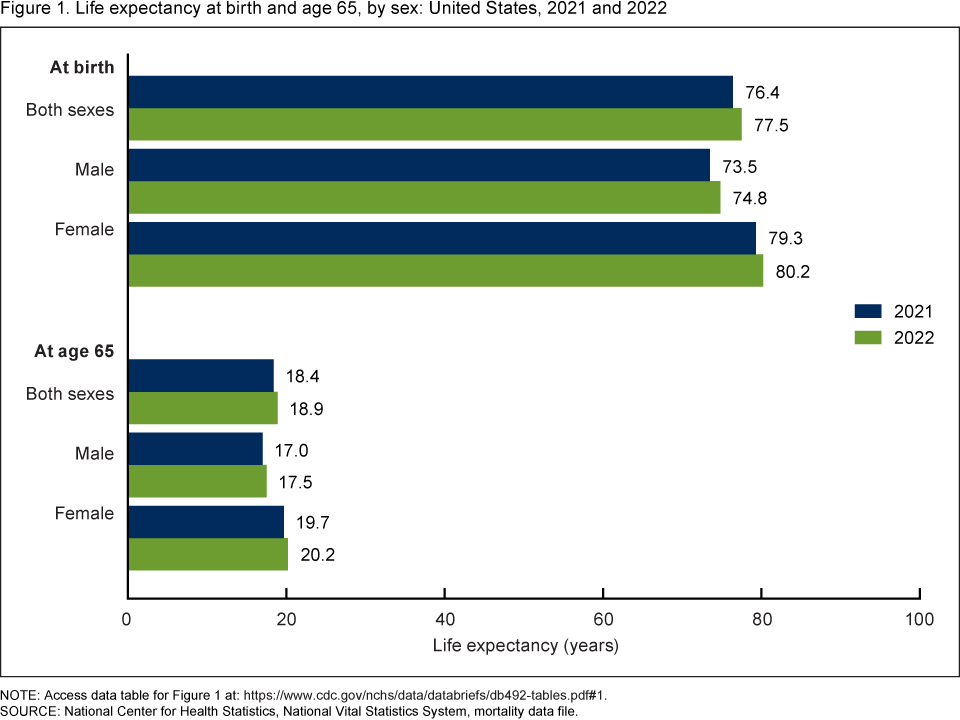
In 2022, life expectancy at birth was 77.5 years for the total U.S. population—an increase of 1.1 years from 76.4 years in 2021 (Figure 1). For males, life expectancy increased 1.3 years from 73.5 in 2021 to 74.8 in 2022. For females, life expectancy increased 0.9 year from 79.3 in 2021 to 80.2 in 2022.
In 2022, the difference in life expectancy between females and males was 5.4 years, a decrease of 0.4 year from 2021.
In 2022, life expectancy at age 65 for the total population was 18.9 years, an increase of 0.5 year from 2021. For males, life expectancy at age 65 increased 0.5 year from 17.0 in 2021 to 17.5 in 2022. For females, life expectancy at age 65 increased 0.5 year from 19.7 in 2021 to 20.2 in 2022. The difference in life expectancy at age 65 between females and males was 2.7 years in 2022, unchanged from 2021.
Figure 1. Life expectancy at birth and age 65, by sex: United States, 2021 and 2022
Note: Access data table for Figure 1.
SOURCE: National Center for Health Statistics, National Vital Statistics System, mortality data file.
What are the age-adjusted death rates for race-ethnicity-sex groups?
The age-adjusted death rate for the total population decreased 9.2% from 879.7 deaths per 100,000 U.S. standard population in 2021 to 798.8 in 2022 (Figure 2).
From 2021 to 2022, age-adjusted death rates, corrected for race and ethnicity misclassification, decreased 15.4% for Hispanic males (915.6 to 774.2) and 14.5% for Hispanic females (599.8 to 512.9). Among the non-Hispanic population, death rates decreased 15.9% for American Indian and Alaska Native males (1,717.5 to 1,444.1), 14.0% for American Indian and Alaska Native females (1,236.6 to 1,063.6), 9.7% for Asian males (578.1 to 522.2), 9.3% for Asian females (391.1 to 354.9), 8.5% for Black males (1,380.2 to 1,263.3), 11.8% for Black females (921.9 to 813.2), 7.9% for White males (1,055.3 to 971.9), and 7.8% for White females (750.6 to 691.9).
Figure 2. Age-adjusted death rate, by race and Hispanic origin and sex: United States, 2021 and 2022
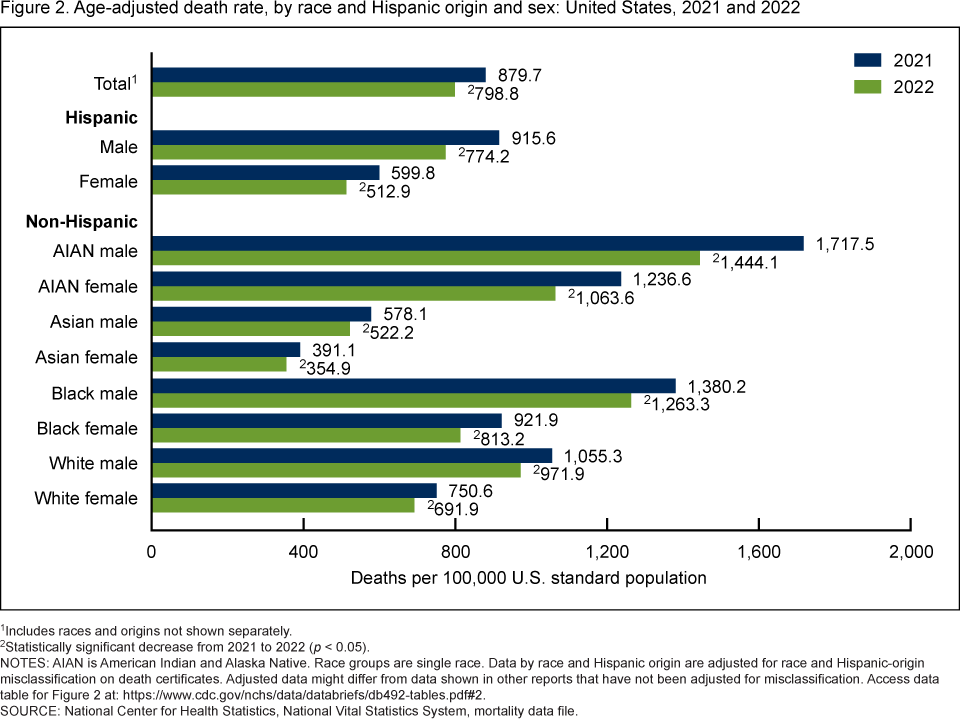
1Includes races and origins not shown separately.
2Statistically significant decrease from 2021 to 2022 (p < 0.05).
NOTES: AIAN is American Indian and Alaska Native. Race groups are single race. Data by race and Hispanic origin are adjusted for race and Hispanic-origin misclassification on death certificates. Adjusted data might differ from data shown in other reports that have not been adjusted for misclassification. Access data table for Figure 2.
SOURCE: National Center for Health Statistics, National Vital Statistics System, mortality data file.
Did age-specific death rates in 2022 change from 2021 for those age 1 year and older?
From 2021 to 2022, death rates increased 12.0% for age group 1–4 (from 25.0 deaths per 100,000 population in 2021 to 28.0 in 2022) and increased 7.0% for age group 5–14 (14.3 to 15.3) (Figure 3).
Age-specific rates decreased 10.6% for age group 15–24 (88.9 to 79.5), 9.6% for 25–34 (180.8 to 163.4), 11.3% for 35–44 (287.9 to 255.4), 14.6% for 45–54 (531.0 to 453.3), 11.2% for 55–64 (1,117.1 to 992.1), 8.0% for 65–74 (2,151.3 to 1,978.7), 8.0% for 75–84 (5,119.4 to 4,708.2), and 8.6% for 85 and older (15,743.3 to 14,389.6).
Figure 3. Death rate for age 1 year and older: United States, 2021 and 2022
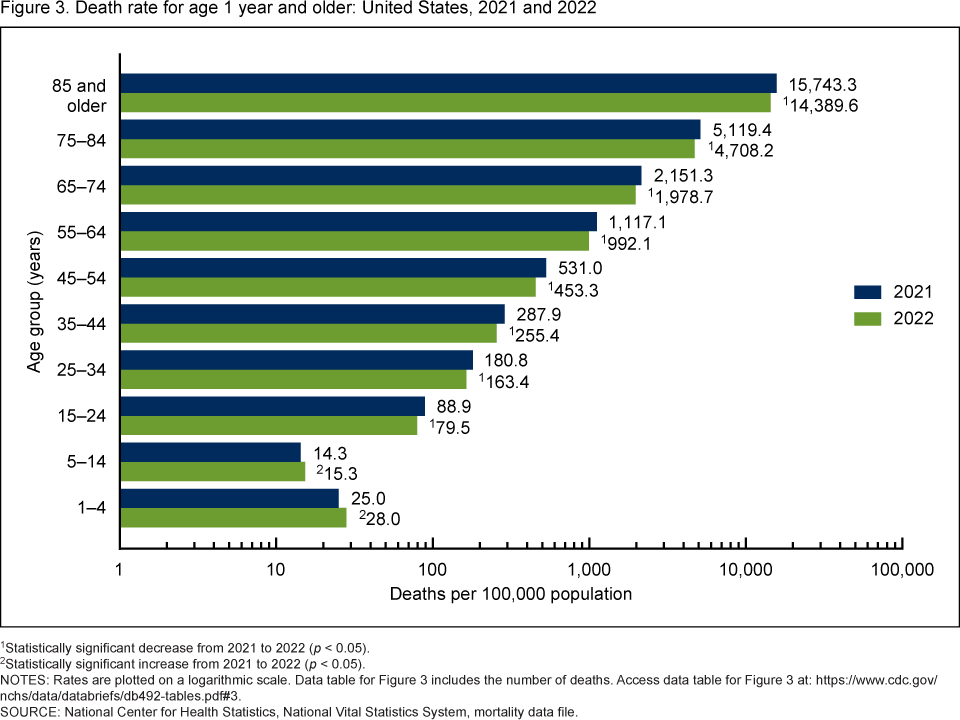
1Statistically significant decrease from 2021 to 2022 (p < 0.05).
2Statistically significant increase from 2021 to 2022 (p < 0.05).
NOTES: Rates are plotted on a logarithmic scale. Data table for Figure 3 includes the number of deaths. Access data table for Figure 3.
SOURCE: National Center for Health Statistics, National Vital Statistics System, mortality data file.
What are the death rates for the 10 leading causes of death?
In 2022, the 10 leading causes of death remained the same as in 2021. The top leading cause in 2022 was heart disease, followed by cancer (Figure 4).
Four causes changed rank from 2021. Unintentional injuries, the 4th leading cause of death in 2021, became the 3rd leading cause in 2022, while COVID-19 dropped from the 3rd leading cause to the 4th. Kidney disease went from the 10th leading cause in 2021 to the 9th leading cause in 2022, while Chronic liver disease and cirrhosis dropped from the 9th leading cause to the 10th. The remaining leading causes in 2022 (stroke, chronic lower respiratory diseases, Alzheimer disease, and diabetes) remained at the same ranks as in 2021.
From 2021 to 2022, age-adjusted death rates decreased for 9 of the 10 leading causes of death and increased for 1. The rate decreased 3.8% for heart disease (from 173.8 in 2021 to 167.2 in 2022), 2.9% for cancer (146.6 to 142.3), 1.1% for unintentional injuries (64.7 to 64.0), 57.3% for COVID-19 (104.1 to 44.5), 3.9% for stroke (41.1 to 39.5), 1.2% for chronic lower respiratory diseases (34.7 to 34.3), 6.8% for Alzheimer disease (31.0 to 28.9), 5.1% for diabetes (25.4 to 24.1), and 4.8% for chronic liver disease and cirrhosis (14.5 to 13.8).
The rate increased 1.5% for kidney disease (13.6 to 13.8).
Figure 4. Age-adjusted death rate for the 10 leading causes of death in 2022: United States, 2021 and 2022
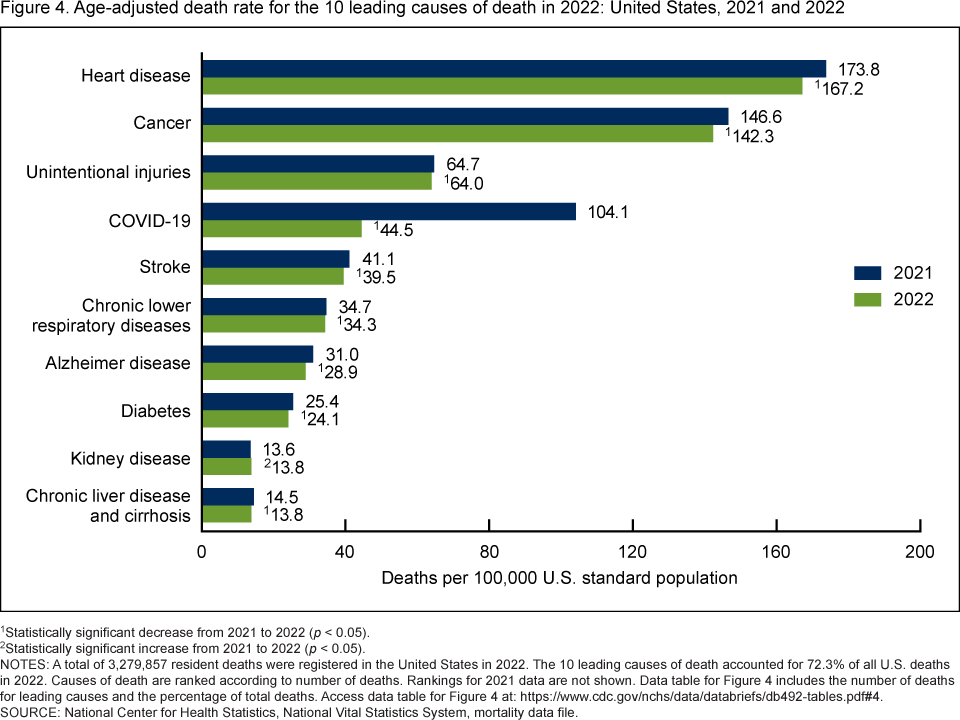
1Statistically significant decrease from 2021 to 2022 (p < 0.05).
2Statistically significant increase from 2021 to 2022 (p < 0.05).
NOTES: A total of 3,279,857 resident deaths were registered in the United States in 2022. The 10 leading causes of death accounted for 72.3% of all U.S. deaths in 2022. Causes of death are ranked according to number of deaths. Rankings for 2021 data are not shown. Data table for Figure 4 includes the number of deaths for leading causes and the percentage of total deaths. Access data table for Figure 4.
SOURCE: National Center for Health Statistics, National Vital Statistics System, mortality data file.
What are the mortality rates for the 10 leading causes of infant death and for infant deaths overall?
The infant mortality rate (IMR) increased 3.1% from 543.6 infant deaths per 100,000 live births in 2021 to 560.4 in 2022.
Causes of infant death are ranked according to number of infant deaths (1). The 10 leading causes of infant death in 2022 (congenital malformations, low birth weight, sudden infant death syndrome, unintentional injuries, maternal complications, cord and placental complications, bacterial sepsis of newborn, respiratory distress of newborn, intrauterine hypoxia and birth asphyxia, and diseases of the circulatory system) accounted for 65.2% of all infant deaths in the United States (Figure 5).
In 2022, intrauterine hypoxia and birth asphyxia moved from the 10th leading cause of infant death to the 9th leading cause, while diseases of the circulatory system dropped from the 9th to the 10th leading cause. The IMR for maternal complications increased 8.9% from 30.4 in 2021 to 33.1 in 2022, and the IMR for bacterial sepsis of newborn increased 13.8% (15.2 to 17.3). Mortality rates for the other leading causes of infant death did not change significantly.
Figure 5. Infant mortality rate for the 10 leading causes of infant death in 2022: United States, 2021 and 2022
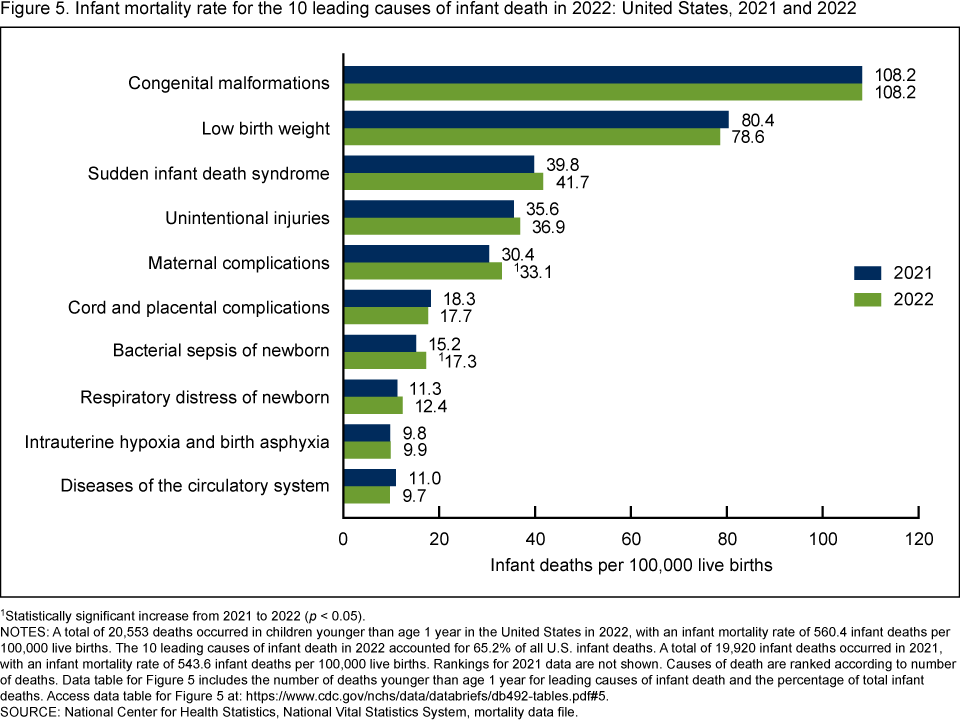
1Statistically significant increase from 2021 to 2022 (p < 0.05).
NOTES: A total of 20,553 deaths occurred in children younger than age 1 year in the United States in 2022, with an infant mortality rate of 560.4 infant deaths per 100,000 live births. The 10 leading causes of infant death in 2022 accounted for 65.2% of all U.S. infant deaths. A total of 19,920 infant deaths occurred in 2021, with an infant mortality rate of 543.6 infant deaths per 100,000 live births. Rankings for 2021 data are not shown. Causes of death are ranked according to number of deaths. Data table for Figure 5 includes the number of deaths younger than age 1 year for leading causes of infant death and the percentage of total infant deaths. Access data table for Figure 5.
SOURCE: National Center for Health Statistics, National Vital Statistics System, mortality data file.
Summary
In 2022, a total of 3,279,857 resident deaths were registered in the United States—184,374 fewer deaths than in 2021. The number of deaths for which COVID-19 was the underlying cause of death decreased 55.3% from 416,893 in 2021 to 186,552 in 2022. COVID-19 dropped from the 3rd leading cause to the 4th. The age-adjusted death rate for the total population decreased 9.2% in 2022 from 2021 after an increase of 5.3% from 2020 to 2021 (1). Life expectancy for the total population increased 1.1 years from 2021 to 2022 (2). Age-specific death rates from 2021 to 2022 increased for age groups 1–4 and 5–14 and decreased for each age group 15–24 years and older. Age-adjusted death rates decreased in 2022 from 2021 for all race and Hispanic-origin groups for both males and females.
The 10 leading causes of death in 2022 remained the same as in 2021. Heart disease was the leading cause of death, followed by cancer. Age-adjusted death rates decreased for 9 leading causes and increased for 1. Life expectancy at birth increased 1.1 years from 76.4 in 2021 to 77.5 in 2022, largely because of decreases in mortality due to COVID-19, heart disease, cancer, unintentional injuries, and homicide.
In 2022, 20,553 deaths occurred in children younger than age 1 year, which was 633 more infant deaths than in 2021. The IMR increased 3.1% from 543.6 infant deaths per 100,000 live births in 2021 to 560.4 in 2022. Among the 10 leading causes of infant death, the increase in IMR for two causes (maternal complications and bacterial sepsis of newborn) were significant.
Data and findings in this report are based on final mortality data and may differ from provisional data and findings previously published.
Definitions
Cause of death: Based on medical information—including injury diagnoses and external causes of injury—entered on death certificates filed in the United States. This information is classified and coded according to the International Statistical Classification of Diseases and Related Health Problems, 10th Revision (3).
Death rates: For 2022, based on population estimates for July 1, 2022, that are based on the blended base produced by the U.S. Census Bureau in place of the April 1, 2020, decennial population count. The blended base consists of Vintage 2020 Population Estimates for April 1, 2020 (based on April 1, 2010, decennial census), blended with the 2020 Demographic Analysis Estimates and the 2020 Census Edited File (see: https://www2.census.gov/programs-surveys/popest/technical-documentation/methodology/2020-2022/methods-statement-v2022.pdf). These population estimates (as well as population figures for the 2020 census) are available from the CDC WONDER website (4). Age-adjusted death rates are useful when comparing different populations because they remove the potential bias that can occur when the populations being compared have different age structures. The National Center for Health Statistics uses the direct method of standardization; see Technical Notes of “Deaths: Final Data for 2021” (1) for more information.
Infant mortality rate (IMR): Computed by dividing the number of infant deaths in a calendar year by the number of live births registered for the same period. IMR is the most widely used index for measuring the risk of dying during the first year of life.
Leading causes of death: Ranked according to the number of deaths assigned to rankable causes (5).
Life expectancy: The expected average number of years of life remaining at a given age. It is denoted by ex, which means the average number of subsequent years of life for someone now age x. Life expectancy estimates for 2022 are based on a methodology first implemented with 2008 final mortality data (6).
Data source and methods
The data shown in this report reflect information collected by the National Center for Health Statistics for 2021 and 2022 from death certificates filed in all 50 states and the District of Columbia and compiled into national data known as the National Vital Statistics System. Differences between death rates were evaluated using a two-tailed z test.
The race and Hispanic-origin groups shown in this report follow the 1997 Office of Management and Budget standards and differ from the bridged-race categories shown in reports for data years before 2018 (1).
Death rates for the Hispanic, and the non-Hispanic American Indian and Alaska Native, and Asian populations are affected by inconsistencies in reporting Hispanic origin and race on the death certificate compared with censuses and surveys (7,8). As a result, death rates are underestimated by 3% for both the Hispanic and Asian non-Hispanic populations and by 34% for the American Indian and Alaska Native non-Hispanic population. Age-adjusted death rates by race and ethnicity in this report are adjusted for race and Hispanic-origin misclassification on death certificates (7,8). Adjusted data may differ from data shown in other reports that have not been adjusted for misclassification. The classification ratios used for adjustment of race and Hispanic-origin misclassification on death certificates can be found elsewhere (9). The classification ratios for the Native Hawaiian or Other Pacific Islander non-Hispanic population were not produced because the data needed to evaluate race and ethnicity misclassification on death certificates for this population are not currently available; consequently, rates for this group are not included in this report.
About the authors
Kenneth D. Kochanek, Sherry L. Murphy, Jiaquan Xu, and Elizabeth Arias are with the National Center for Health Statistics, Division of Vital Statistics. The authors would like to acknowledge Arialdi Miniño and Brigham Bastian, Division of Vital Statistics, for providing content review of data and tables.
References
- Murphy SL, Kochanek KD, Xu JQ, Arias E. Deaths: Final data for 2021. National Vital Statistics Reports. Hyattsville, MD: National Center for Health Statistics. 2024. [Forthcoming].
- Xu JQ, Murphy SL, Kochanek KD, Arias E. Mortality in the United States, 2021. NCHS Data Brief, no 456. Hyattsville, MD: National Center for Health Statistics. 2022. DOI: https://dx.doi.org/10.15620/cdc:122516.
- World Health Organization. International statistical classification of diseases and related health problems, 10th revision (ICD–10). 5th ed. 2016.
- Centers for Disease Control and Prevention. CDC WONDER. Single-race population estimates, 2010–2022.
- Curtin SC, Tejada-Vera B, Bastian BA, Berruti AA. Deaths: Leading causes for 2021. National Vital Statistics Reports. Hyattsville, MD: National Center for Health Statistics. 2024. [Forthcoming].
- Arias E. United States life tables, 2008. National Vital Statistics Reports; vol 61 no 3. Hyattsville, MD: National Center for Health Statistics. 2012.
- Arias E, Heron M, Hakes JK. The validity of race and Hispanic-origin reporting on death certificates in the United States: An update. National Center for Health Statistics. Vital Health Stat 2(172). 2016.
- Arias E, Xu JQ, Curtin S, Bastian B, Tejada-Vera B. Mortality profile of the non-Hispanic American Indian or Alaska Native population, 2019. National Vital Statistics Reports; vol 70 no 12. Hyattsville, MD: National Center for Health Statistics. 2021. DOI: https://dx.doi.org/10.15620/cdc:110370.
- Arias E, Xu JQ, Kochanek KD. United States life tables, 2021. National Vital Statistics Reports; vol 72 no 12. Hyattsville, MD: National Center for Health Statistics. 2023. DOI: https://dx.doi.org/10.15620/cdc:132418.
Suggested citation
Kochanek KD, Murphy SL, Xu JQ, Arias E. Mortality in the United States, 2022. NCHS Data Brief, no 492. Hyattsville, MD: National Center for Health Statistics. 2024. DOI: https://dx.doi.org/10.15620/cdc:135850
Copyright information
All material appearing in this report is in the public domain and may be reproduced or copied without permission; citation as to source, however, is appreciated.
National Center for Health Statistics
Brian C. Moyer, Ph.D., Director
Amy M. Branum, Ph.D., Associate Director for Science
Division of Vital Statistics
Paul D. Sutton, Ph.D., Acting Director
Andrés A. Berruti, Ph.D., M.A., Associate Director for Science