Guide to the Application of Genotyping to Tuberculosis Prevention and Control
CDC Tuberculosis Genotyping Laboratory Procedures
Description of Genotyping Methods
Spoligotyping
Spacer oligonucleotide typing is a hybridization assay that detects variability in the direct repeat (DR) region in the DNA of M. tuberculosis. The DR region consists of multiple copies of a conserved 36-base-pair sequence (the direct repeats) separated by multiple unique spacer sequences (the standard spoligotyping assay uses 43). Different M. tuberculosis strains have various complements of the 43 spacers, and these different complements form the basis of the assay (Kamerbeek 1997).
The standard spoligotyping assay is performed by using a membrane. In this format, each of the 43 spacers produces either a dark band (indicating the presence of the spacer) or no band (indicating the spacer’s absence). As Figure 3.1 shows, for each M. tuberculosis isolate, the spoligotyping assay produces a series of bands, much like a bar code.
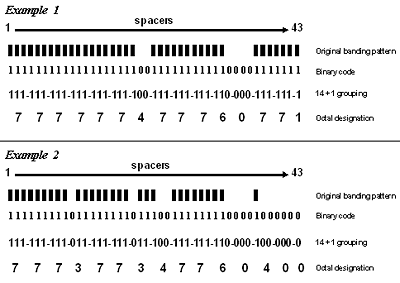
Figure 3.1. Two examples of spoligotype results showing the original banding patterns as well as the steps involved in converting the banding pattern results to the final octal code designation. The octal designation is the form of the result that is reported by the genotyping laboratories to TB programs.
To simplify recording, the band pattern is converted to a series of 1s and 0s (1 means that the band is present and 0 means it is absent—see the rows labeled Binary code in Figure 3.1) that is 43 digits long. Since there are only 1s and 0s in the number, this is called a binary code. To simplify this even further, the 43-digit binary code is converted to a 15-digit octal (i.e., base 8, having the digits 0-7) designation by a two-step process. First, the 43-digit binary code is divided into 14 sets of three digits (spacers 1 through 42) plus one additional digit (spacer 43). Second, each 3-digit binary set is converted to its octal equivalent, with the final additional digit remaining as 1 or 0. The translation of binary numbers to octal numbers is done as follows: 000 = 0; 001 = 1; 010 = 2; 011 = 3; 100 = 4; 101 = 5; 110 = 6; 111 = 7. Each octal designation is unique, representing one specific banding pattern. From an octal designation, the binary code of the spoligotyping pattern can be re-created. A spreadsheet application, such as Microsoft Excel, can be used to perform the conversion from binary to octal and from octal to binary.
The genotyping laboratories will use a new, automated spoligotyping assay that produces numeric values for each spacer rather than a photographic image. The results are automatically converted to 43-digit binary codes, which are then converted to 15-digit octal designations, as described above. These octal designations can be compared with published results obtained with the previously used assay.
This coding and reporting information is given to help explain how the process works. The bottom line is much simpler: the genotyping laboratories will report spoligotyping results to TB programs by giving the octal code designation for each isolate. If one isolate’s spoligotype designation is different from another isolate’s designation, even by a single number, that means the two isolates’ spoligotypes are different.
Figure 3.2 shows examples of spoligotype patterns for several known strains. Most M. tuberculosis strains, such as H37Rv, lack spacers 33-36. Generally, Mycobacterium bovis strains, such as BCG, have all four spacers 33 through 36 and lack spacers 39 through 43. All Beijing family isolates lack spacers 1 through 34, and this is the key indicator of the family. Beijing isolates are common in the United States; therefore, the finding that two persons both are infected with isolates that share the Beijing spoligotype (octal designation: 000000000003771) is not a reliable indication that the two persons are involved in the same chain of TB transmission. A second common spoligotype in the United States is 777777777760771 (lacking only spacers 33 through 36). Again, this spoligotype is so common that it is not a good indicator that the two isolates are related. Spacers can be lost either singly or in groups of consecutive spacers. The next three patterns in Figure 3.2 show examples of the types of changes that can occur. Pattern A can go to pattern B or C; either B or C can go to D via a second event. However, B cannot go to C or C to B because missing spacers cannot be regained. Some understanding of the relationship of the spoligotype patterns and octal designations will assist the TB controller in interpreting the results reported for their patients.
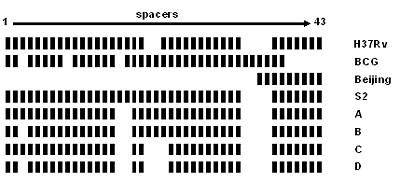
Figure 3.2. Graphical representations of spoligotype patterns of certain strains. Strains H37Rv and BCG are used as control strains in the assay and between them contain all 43 spacers. The Beijing spoligotype contains only the final nine spacers (35 through 43). The octal designations for the patterns are H37Rv, 777777477760771; BCG, 676773777777600; Beijing, 000000000003771; S2, 777777777760771; A, 777771777760771; B, 677771777760771; C, 777771437760771; and D, 677771437760771.
MIRU Analysis
Variable number of tandem repeat (VNTR) typing is based on analysis of DNA segments containing “tandem repeated” sequences in which the number of copies of the repeated sequence varies among strains. The method relies on PCR amplification and calculation of the number of repeats on the basis of the size of the amplified product. MIRUs are a class of tandem repeated sequences. There are a total of 41 MIRU loci, of which 12 have been selected for genotyping. The names of the 12 loci that will be analyzed are 02, 04, 10, 16, 20, 23, 24, 26, 27, 31, 39, and 40 (Mazars 2001).
MIRU results are reported as 12-character designations, each character corresponding to the number of repeats at one of the 12 MIRU loci, listed in a standard order (Table 3.1). In rare instances, the number of repeats is greater than 9. To avoid the use of double digits, the following designations are used in reporting results: 10 repeats = “a”; 11 repeats = “b”; 12 repeats = “c”; etc. Occasionally, the repeat number is 0. If the region is deleted and no amplification product is obtained, this is indicated by a dash (-). A few strains give an anomalous result for MIRU locus number 04 (i.e., the second digit in the MIRU type). These anomalous results at 04 are designated “x,” “y,” or “z,” depending on the number of repeats.
Table 3.1. Examples of MIRU results. MIRU results are reported as a 12-digit designation, with each digit representing the number of repeats detected at the respective 12 MIRU loci. For loci with more than nine repeats, letters are used (e.g., “a” for 10 repeats, “b” for 11, etc.). See text for details.
Example 1
| MIRU locus name | ||||||||||||
|---|---|---|---|---|---|---|---|---|---|---|---|---|
| 02 | 04 | 10 | 16 | 20 | 23 | 24 | 26 | 27 | 31 | 39 | 40 | |
| No. of repeats | 2 | 3 | 2 | 2 | 3 | 4 | 2 | 5 | 3 | 3 | 2 | 2 |
MIRU designation: 232234253322
Example 2
| MIRU locus name | ||||||||||||
|---|---|---|---|---|---|---|---|---|---|---|---|---|
| 02 | 04 | 10 | 16 | 20 | 23 | 24 | 26 | 27 | 31 | 39 | 40 | |
| No. of repeats | 1 | 4 | 3 | 2 | 2 | 4 | 0 | 4 | 3 | 5 | 4 | 11 |
MIRU designation: 14322404354b
IS6110-based Restriction Fragment Length Polymorphism (RFLP)
IS6110-based RFLP genotyping detects variations generated by the insertion element IS6110. Insertion elements are capable of making copies of themselves and then inserting the copy anywhere in the genome in a process known as transposition. Strains can differ in both the number of copies of IS6110 and the positions of IS6110 in the bacterial DNA (van Embden 1993).
IS6110-based RFLP is performed by using an internationally standardized protocol. The first step is purification of DNA from a culture of M. tuberculosis. A restriction enzyme is added that cuts the DNA at specific sequences into hundreds of different fragments. The fragments are separated by size on an agarose gel and transferred to a membrane. A probe is used to detect fragments containing IS6110, and the image is captured on film. Each copy of IS6110 produces one band. RFLP patterns containing seven or more bands provide more specificity in discriminating between isolates. Patterns with six or fewer bands provide correspondingly less discrimination. A very small percentage of M. tuberculosis isolates, especially those from India and Southeast Asia, lack IS6110; RFLP analysis of such isolates results in a blank fingerprint with no bands.
Unlike spoligotyping and MIRU analysis, both of which produce results that can easily be translated into a specific numbered designation, IS6110-based RFLP produces a complex pattern that cannot be given a straightforward, mathematically derived designation. This limitation is not a problem in comparing two RFLP patterns that have been run in the same laboratory at the same time on the same gel, since the two patterns can be compared visually. Describing the RFLP pattern is a challenge, however, when a laboratory reports an individual result to a TB program, when a large number of results need to be stored for future reference, or when two laboratories need to compare their RFLP results. Overcoming this technical challenge requires a sophisticated pattern-matching computer program. The RFLP images on film are scanned and digitized for computer analysis. The sizes of the bands in the image are calculated by comparison with size standards run on the gel. The computer program compares the results from a new isolate with previously analyzed isolates to determine if any matches exist. Figure 3.3 illustrates examples of IS6110-based RFLP patterns.
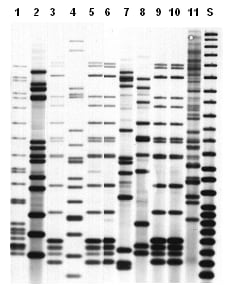
Figure 3.3. Representative IS6110-based RFLP image. Isolates represented by lanes 3, 5, 6, 9, and 10 have the same pattern and were epidemiologically linked. Lane S shows the CDC molecular weight standard.
IS6110-based RFLP requires much more isolate material than do the PCR-based tests to y01ield sufficient DNA for analysis. This requires the genotyping laboratories to place the isolates in culture medium and wait until sufficient growth has taken place. Unlike the PCR methods (MIRU and spoligotyping), RFLP analysis cannot be done on nonviable cultures. Isolation of DNA is laborious, there is a high failure rate, and the procedure often must be repeated. It is common for 10%–25% of the DNA samples to be unusable. The complexities of the procedure may result in lengthy delays in reporting.