Healthy People 2010
Progress Review Focus Area 28 – Vision and Hearing Presentation
PowerPoint Presentation [PPT – 1.1 MB]
Slide 1
Healthy People 2010 focus area 28 – Vision and Hearing Progress Review data presentation by Richard Klein.
October 21, 2008
Slide 2
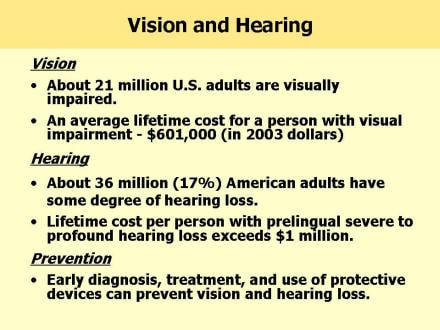
Vision
-
About 21 million U.S. adults are visually impaired.
-
An average lifetime cost for a person with visual impairment – $601,000 (in 2003 dollars)
Hearing
-
About 36 million (17%) American adults have some degree of hearing loss.
-
Lifetime cost per person with prelingual severe to profound hearing loss exceeds $1 million.
Prevention
-
Early diagnosis, treatment, and use of protective devices can prevent vision and hearing loss.
Slide 3
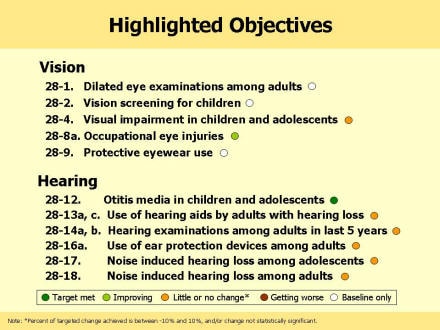
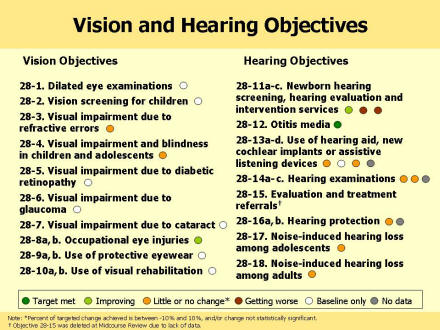
This slide contains Healthy People 2010 objectives highlighted for this Progress Review.
Vision
-
28-1. Dilated eye examinations among adults (baseline data only)
-
28-2. Vision screening for children (baseline data only)
-
28-4. Visual impairment in children and adolescents (no change)
-
28-8a. Occupational eye injuries (improving)
-
28-9. Protective eyewear use (baseline data only)
Hearing
-
28-12. Otitis media in children and adolescents (met target0
-
28-13a, c. Use of hearing aids by adults with hearing loss (no change)
-
28-14a, b. Hearing examinations among adults in last 5 years (no change)
-
28-16a. Use of ear protection devices among adults (no change)
-
28-17. Noise induced hearing loss among adolescents (no change)
-
28-18. Noise induced hearing loss among adults (no change)
Slide 4
-
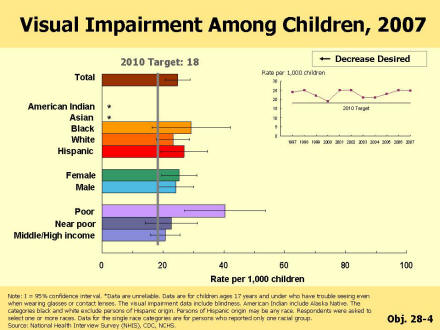
Data are for children ages 17 years and under who have trouble seeing even when wearing glasses or contact lenses. The visual impairment data (VI) include blindness.
-
The prevalence of visual impairment was 25 per 1000 children in 2007.
-
There are no changes in VI among children between 1997 and 2006
Slide 5
-
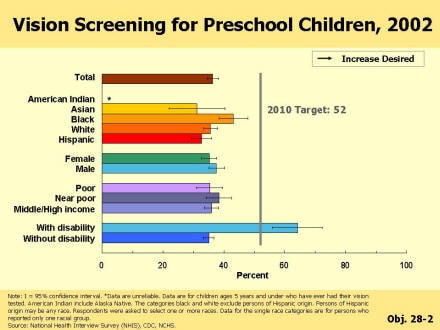
Only 36% of preschool children have ever received the vision testing in 2002.
-
There was no significant difference in vision testing among racial/ethnic groups.
-
Children with disabilities were more likely to receive vision testing than their counterparts.
Slide 6
-
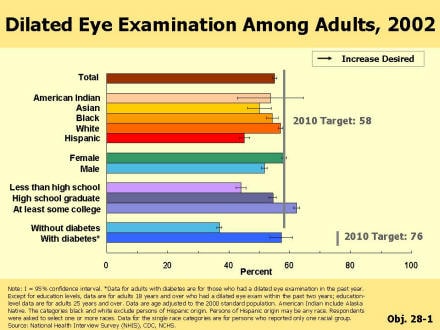
About 55% of adults 18 years and over had a dilated eye exam once in 2 years.
-
Adults with diabetes are recommended to have an annual dilated eye examination, 57% of adults with diabetes received a dilated eye examination in the past 12 months in 2002.
-
HP 2010 have a related objective in focus area 5- Diabetes with the target of 76%.
-
Women and persons who have at least some college education met the target of 58%.
Slide 7
-
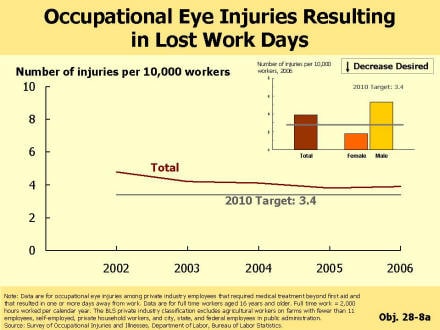
Data are for occupational eye injuries among private industry employees that required medical treatment beyond first aid and that resulted in one or more days away from work.
-
Data are for full time workers aged 16 years and older. Full time work = 2,000 hours worked per calendar year. The private industry classification excludes agricultural workers on farms with fewer than 11 employees, self-employed, private household workers, and city, state, and federal employees in public administration.
-
There has been a slight decline 2002 and 2006 from 4.8 to 3.9.
-
Women were less likely to have an eye injury than men (1.8 vs. 5.3)
-
The data source is Survey of Occupational Injuries and Illnesses, Department of Labor, Bureau of Labor Statistics.
Slide 8
-
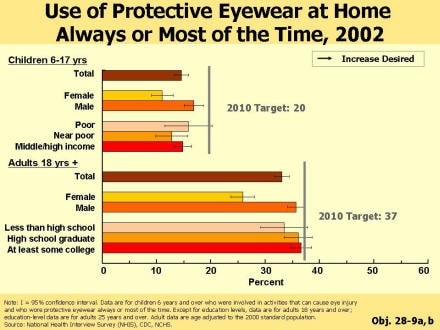
The objective measures number of children 6-17 years and adults 18 years and over who used protective eyewear during the eye injury causing recreational activities and hazardous situations around the home.
-
These eye injury causing activities include: baseball, basketball, mowing the lawn, woodworking, or working with chemicals.
-
About 50% of children ages 6 to 17 and 30% of adults participated in sports, hobbies, or other activities that could cause eye injury.
-
Among those who participated in sports, hobbies, or other activities that could cause eye injury, only 15% of children and 33% of adults and wear eye protection always or most of the time while doing these activities.
Slide 9
-
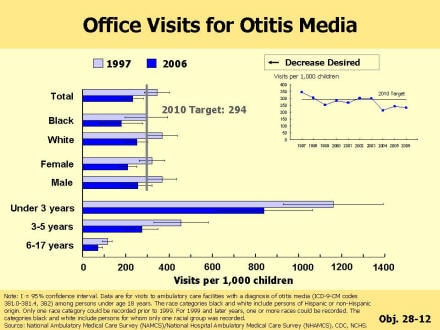
Visits to ambulatory care facilities with a diagnosis of otitis media among persons under age 18 years.
-
All groups met the target – 294 per 1,000 population.
-
Children under 3 years old have the highest rate of otitis media than older children.
Slide 10
-
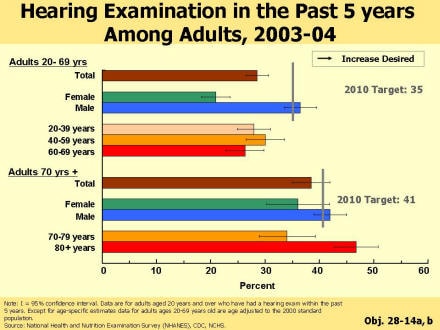
The slide shows adults aged 20 years and over who have had a hearing exam within the past 5 years. About 30% of adults 20-69 years and 38% of adults 70 years and older had a hearing examination in the past 5 years.
-
Males 20-69 years old and persons 80+ years were more likely to have a hearing exam than their counterparts.
Slide 11
-
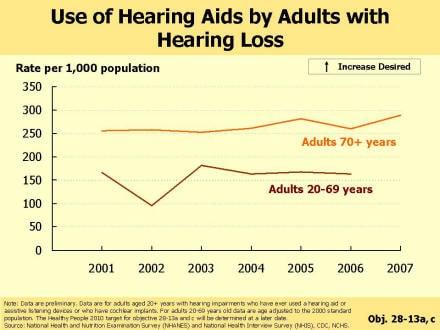
Data are for adults aged 20+ years with hearing impairments who have ever used a hearing aid or assistive listening devices or who have cochlear implants.
-
About 17% of hearing impaired adults 20-69 years and 29% hearing impaired adults 70+ years of use hearing aids.
-
The objectives use two data sources NHIS and NHANES.
Slide 12
-
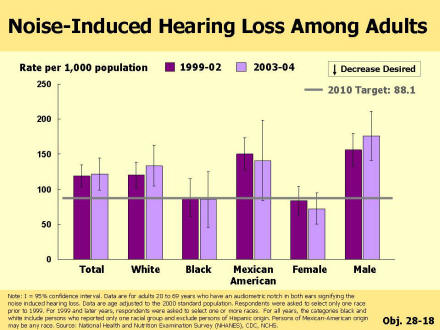
Data are for adults 20 to 69 years who have an elevated hearing thresholds, or audiometric notches, in high frequencies (3, 4, or 6 kHz) in both ears, signifying noise induced hearing loss.
-
Noise-induced hearing loss (NIHL) is permanent neurosensory hearing loss.
-
About 12% of adults 20-69 years old had noise induced hearing loss in 2003-04.
-
Males were more likely to have noise induced hearing loss than females.
Slide 13
-
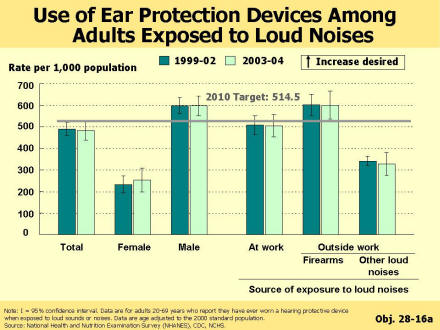
Data are for adults 20-69 years who report they have ever worn a hearing protective device when exposed to loud sounds or noise.
-
About 50% of adults 20-69 years exposed to loud noises reported use of ear protection devices.
Loud noise categories:
1. “At work” – includes loud noise exposure at all types of jobs (current job, longest job, and also job at the armed forces).
2. The “Outside work” variable combines “Firearms” and “Other noises”.
a. “Firearms” – exposure to firearms noises outside of work for an average at least once a month for a year.
b.“Other noises” – variable is based on a question that asks about loud noise exposure (such as loud music, power tools) outside work.
Slide 14
-
6 vision objectives have only baseline data, the follow up data will be available in 2009.
-
Two objectives: VI due to refractive errors and VI among children have no change and eye injury objective is improving.
-
Otitis media objective met the target.
-
One of the hearing objectives was deleted during Midcourse review due to lack of data.
-
Most of the hearing objectives show no change or change was not statistically significant.
Slide 15
-
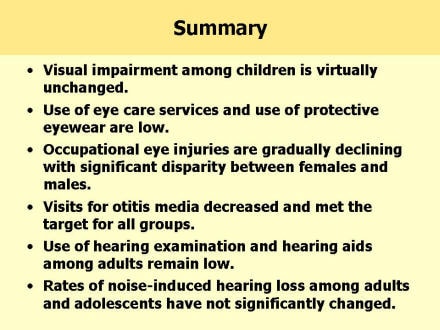
Use of eye care services and use of protective eyewear are low.
-
Occupational eye injuries are gradually declining with significant disparity between females and males.
-
Visits for otitis media decreased and met the target for all groups.
-
Use of hearing examination and hearing aids among adults remain low.
-
Rates of noise-induced hearing loss among adults and adolescents have not significantly changed.
Slide 16
FA28 interagency workgroup and NCHS contributed to the preparation of this data presentation.
Acknowledgements:
Asel Ryskulova
CDC/National Center for Health Statistics
Contributors:
Rosemary Janiszewski, NIH, NEI
Howard Hoffman, NIH, NIDCD
Chia-Wen Ko, NIH, NIDCD
Leda Gurley, CDC, NCHS
Lesley Agress, CDC, NCHS
Jean Williams, CDC, NCHS
Deepthi Kandi, CDC, NCHS
Slide 17
This slide indicates that Progress Review data and slides can be found at the Health People website.