Healthy People 2010
Progress Review Focus Area 24 – Respiratory Diseases Presentation
PowerPoint Presentation [PPT – 5 MB]
Slide 1
Focus Area 24:Respiratory Diseases Progress Review
Edward J. Sondik, National Center for Health Statistics.
May 22, 2008
Slide 2
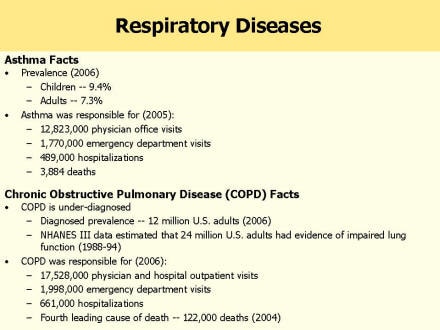
Asthma Facts
Prevalence (2006)
- Children — 9.4%
- Adults — 7.3%
Asthma was responsible for (2005):
- 12,823,000 physician office visits
- 1,770,000 emergency department visits
- 489,000 hospitalizations
- 3,884 deaths
Chronic Obstructive Pulmonary Disease (COPD) Facts
COPD is under-diagnosed
- Diagnosed prevalence — 12 million U.S. adults (2006)
- NHANES III data estimated that 24 million U.S. adults had evidence of impaired lung function (1988-94)
COPD was responsible for (2006):
- 17,528,000 physician and hospital outpatient visits
- 1,998,000 emergency department visits
- 661,000 hospitalizations
- Fourth leading cause of death — 122,000 deaths (2004)
Slide 3
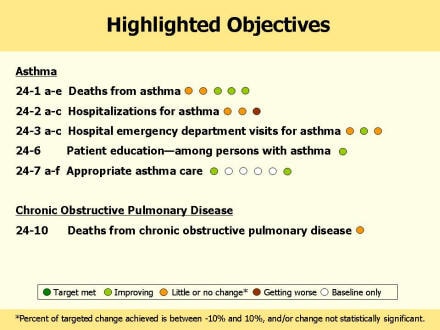
Highlighted objectives with colored dots indicating status.
24-1 Deaths from asthma
a. Children, aged under 5 years (little or no change)
b. Children and youth, aged 5 to 14 years (little or no change)
c. Adolescents and adults, aged 15 to 34 years (improving)
d. Adults, aged 35 to 64 years (improving)
e. Older adults, aged 65 years and over (improving)
24-2 Hospitalizations for asthma
a. Children, aged under 5 years (little or no change)
b. Children and adults, aged 5 to 64 years (little or no change)
c. Adults, aged 65 years and over (getting worse)
24-3 Hospital emergency department visits for asthma
a. Children, aged under 5 years (little or no change)
b. Children and adults, aged 5 to 64 years (improving)
c. Older Adults, aged 65 years and over (little or no change)
24-6 Patient education—among persons with asthma (improving)
24-7 Appropriate asthma care
a. Receiving written asthma plans from health care provider (improving)
b. Receiving proper-use instructions with prescribed inhalers (baseline only)
c. Receiving education on early signs, symptoms and responses to asthma episodes (baseline only)
d. Receiving medication regimens that prevent need for more than 1 beta agonist inhalation canister per month (baseline only)
e. Receiving long-term management care after any hospitalization due to asthma (baseline only)
f. Receiving assistance in reducing exposure to environmental risk factors (improving)
24-10 Deaths from chronic obstructive pulmonary disease (little or no change)
Slide 4
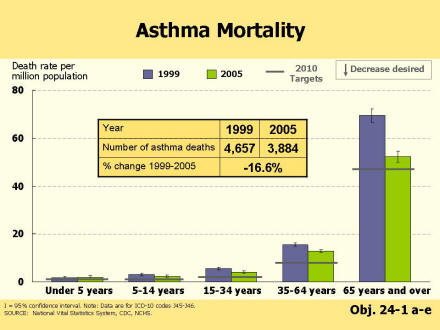
Asthma Mortality
Asthma mortality rates for five age groups shown for baseline year (1999) and most recent data point (2005).
The overall number of asthma deaths in 1999 (4,657) and 2005 (3,884) is shown; this is a 16.6% decrease in the number of asthma deaths.
Slide 5
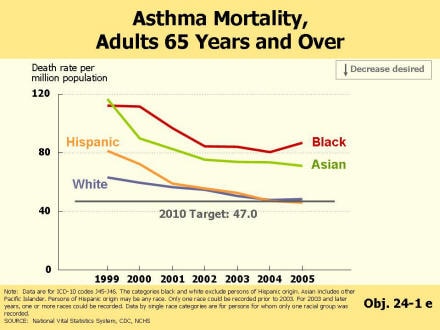
Asthma Mortality, Adults 65 Years and Over
Trend lines show the changing asthma mortality rates by race and ethnicity from 1999 to 2005 for adults 65 years and over. Racial ethnic groups shown are non-Hispanic black, non-Hispanic white, Hispanic, and Asian Pacific Islander.
Slide 6
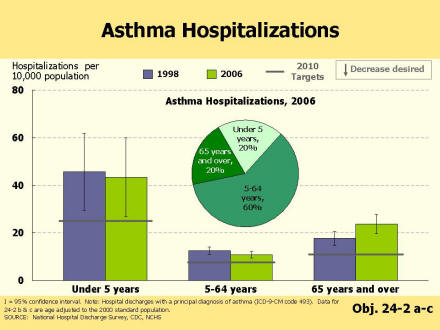
Asthma Hospitalizations
Asthma hospitalization rates for three age groups are shown for baseline year (1998) and most recent data point (2006).
A pie chart shows the breakdown of the percent of asthma hospitalizations for the three age groups.
Slide 7
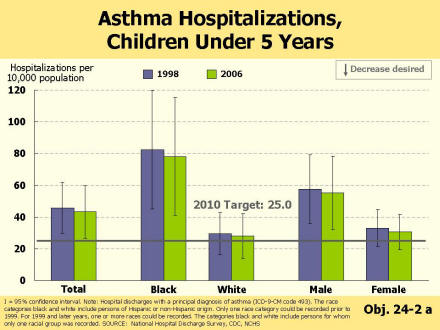
Asthma Hospitalizations, Children Under 5 Years
Asthma hospitalization rates for children under 5 years are shown for baseline year (1998) and most recent data point (2006). Data are shown for the following categories: total, black, white, male, and female.
Slide 8
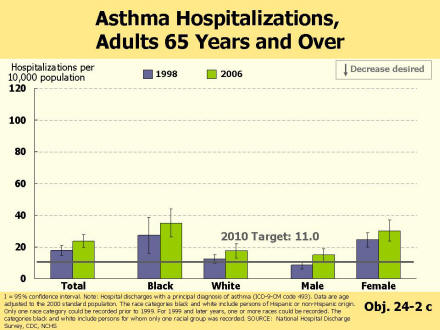
Asthma Hospitalizations, Adults 65 Years and Over
Asthma hospitalization rates for adults 65 years and over are shown for baseline year (1998) and most recent data point (2006)
Slide 9
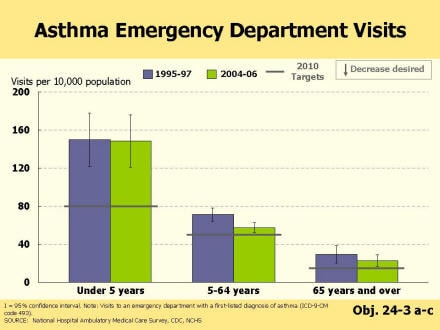
Asthma Emergency Department Visits
Asthma emergency department visit rates for 3 age groups are shown for baseline year (1995-97) and most recent data point (2004-06).
Slide 10
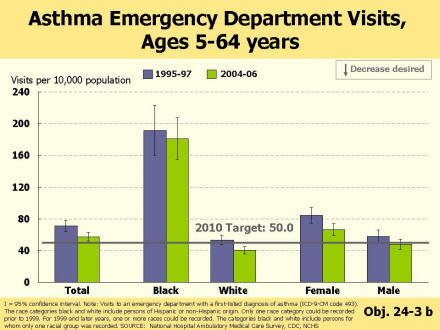
Asthma emergency department visits, ages
5-64 years Asthma emergency department visit rates for the 5-64 age group are shown for baseline year (1995-97) and most recent data point (2004-06). Data are shown for the following categories: total, black, white, male, and female.
Slide 11
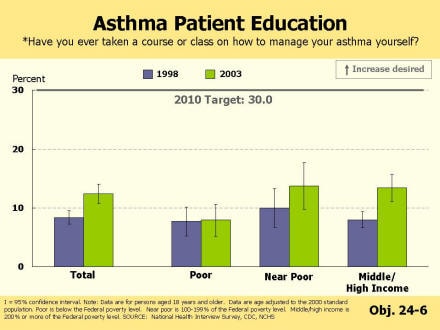
Asthma patient education: Have you ever taken a course or class on how to manage your asthma yourself?
Percent who have ever taken a course or class on how to manage their asthma themselves is shown for baseline (1998) and most recent data year (2003). Data are shown for the following categories: total, poor, near poor, and middle/high income.
Slide 12
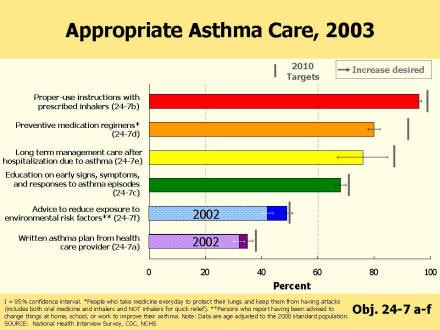
Appropriate Asthma Care, 2003
The percent of asthma patients that reported that they have received the following 6 types of asthma care is shown:
- Proper use instructions with prescribed inhalers (2003 baseline data only)
- Preventive medication regimens (2003 baseline data only)
- Long term management care after hospitalization due to asthma (2003 baseline data only)
- Education on early signs, symptoms, and responses to asthma episodes (2003 baseline data only)
- Advice to reduce exposure to environmental risk factors (2002 baseline data and 2003 data)
- Written asthma plan from health care provider (2002 baseline data and 2003 data)
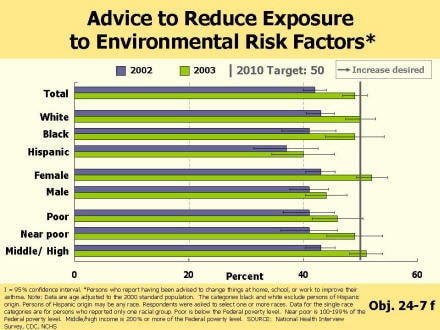
Slide 13
Advice to reduce exposure to environmental risk factors
The percent of people who have been asked to change things at home, school, or work to improve their asthma are shown for baseline (2002) and most recent data year (2003). Data are shown for the following categories: total, white, black, Hispanic, female, male, poor, near poor, and middle/high income.
Slide 14
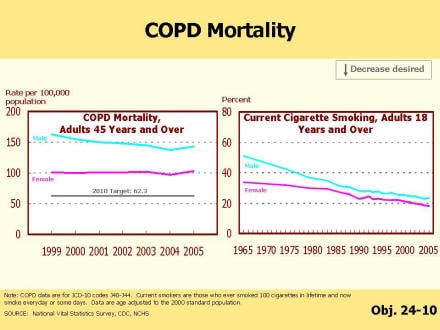
Chronic Obstructive Pulmonary Disease Mortality
Trend lines show the changing chronic obstructive pulmonary disease mortality rates by gender from 1999 to 2005 for adults 45 years and over.
A second set of trend lines show current cigarette smoking percents by gender from 1965 to 2005 for adults 18 years and over.
Slide 15
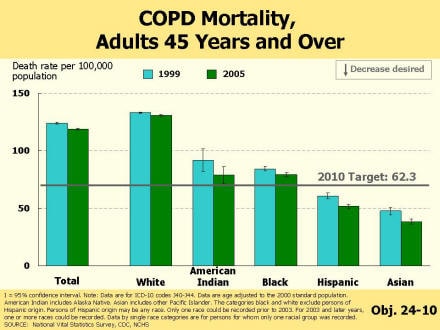
Chronic Obstructive Pulmonary Disease Mortality, Adults 45 Years and Over
Chronic Obstructive Pulmonary Disease Mortality rates are shown for baseline (1999) and most recent data year (2005). Data are shown for the following categories: total, white, American Indian/Alaska Native, black, Hispanic, and Asian/Pacific Islander.
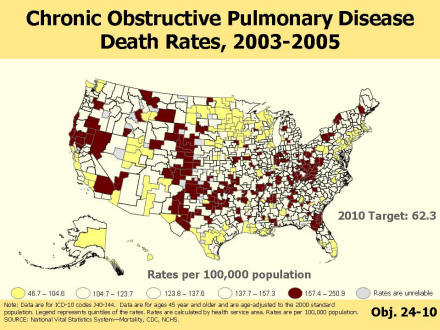
Slide 16
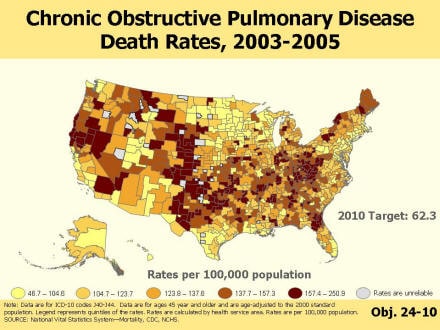
Chronic Obstructive Pulmonary Disease Death Rates, 2003-2005
Map showing chronic obstructive pulmonary disease death rate quintiles for health service areas.
Slide 17
Chronic Obstructive Pulmonary Disease Death Rates, 2003-2005
Map showing first and fifth quintile of chronic obstructive pulmonary disease death rates for health service areas.
Slide 18
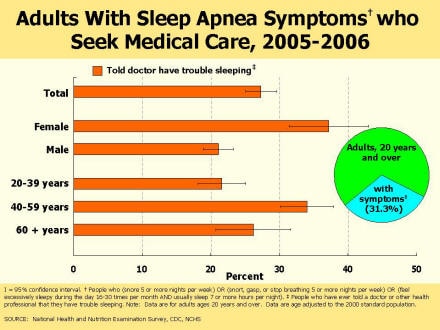
Persons With Sleep Apnea Symptoms who Seek Medical Care, Adults 20 years and over
Percent of adults with sleep apnea symptoms who have ever told a doctor that they have trouble sleeping is shown for data year 2005-06. Data are shown for the following categories: total, female, male, 20-39 years, 40-59 years, and 60+ years. These are new data that can be used to measure the developmental objective 24-11a.
A pie chart shows the percent of adults 20 years and over who have sleep apnea symptoms (31.3%).
Slide 19
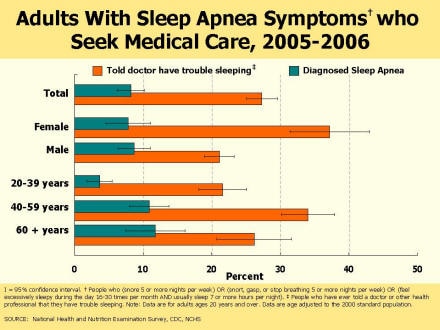
Persons With Sleep Apnea Symptoms who Seek Medical Care, Adults 20 years and over
Percent of adults with sleep apnea symptoms who have been diagnosed with sleep apnea is shown for data year 2005-06. Data are shown for the following categories: total, female, male, 20-39 years, 40-59 years, and 60+ years.
Slide 20
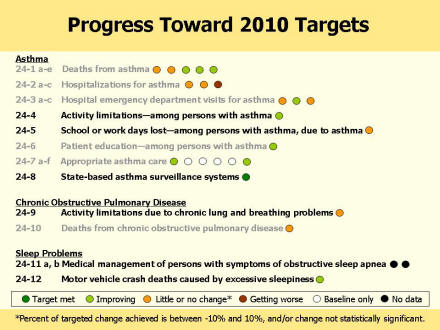
Progress Toward 2010 Targets
Shows the status of non-highlighted respiratory disease objectives.
24-4 Activity limitations—among persons with asthma (improving)
24-5 School or work days lost—among persons with asthma, due to asthma (little or no change)
24-8 State-based asthma surveillance systems (target met)
Chronic Obstructive Pulmonary Disease
24-9 Activity limitations due to chronic lung and breathing problems (little or no change)
Sleep Problems
24-11 a, b Medical management of persons with symptoms of obstructive sleep apnea (no data)
24-12 Motor vehicle crash deaths caused by excessive sleepiness (improving)
Slide 21
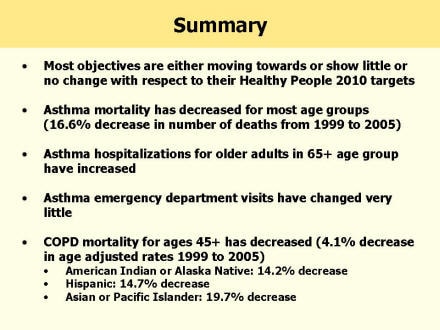
Summary
- Most objectives are either moving towards or show little or no change with respect to their Healthy People 2010 targets
- Asthma mortality has decreased for most age groups (16.6% decrease in number of deaths from 1999 to 2005)
- Asthma hospitalizations for older adults in 65+ age group have increased
- Asthma emergency department visits have changed very little
- COPD mortality for ages 45+ has decreased (4.1% decrease in age adjusted rates 1999 to 2005)
- American Indian or Alaska Native: 14.2% decrease
- Hispanic: 14.7% decrease
- Asian or Pacific Islander: 19.7% decrease
Slide 22
Acknowledgements:
Lesley Agress
Health Statistician
CDC/National Center for Health Statistics
LKA7@cdc.gov
Contributors
- Christopher Barrett, HHS/ODPHP
- Thomas Croxton, NIH/NHLBI
- Ellis Davis, HHS/ODPHP
- Rob Fulwood, NIH/NHLBI
- Paul Garbe, CDC/NCEH
- Peter Gergen, NIH/NIAID
- Jeanette Guyton-Krishan, NIH/NHLBI
- Elizabeth Jackson, CDC/NCHS
- Bill Jirles, NIH/NIEHS
- Jeanne Moorman, CDC/NCEH
- Zakia Nelson, CDC/NCHS
- Jeff Pearcy, CDC/NCHS
- Daniel Rotrosen, NIH/NIAID
- Diana Schmidt, NIH/NHLBI
- Virginia Taggart, NIH/NHLBI
Slide 23
Progress review data and slides can be found on the web at the Healthy People website.