Board of Scientific Counselors – Presentations
September 17-18, 2007
Back to September 2007 Presentations
The State and Local Area Integrated Telephone Survey
PowerPoint Presentation [PDF – 2 MB]
Slide 1
The State and Local Area Integrated Telephone Survey
Presented by Marcie Cynamon and Stephen Blumberg
Slide 2
SLAITS: The State and Local Area Integrated Telephone Survey
- Developed by CDC/NCHS in late 1990s
- Conforms to DHHS Survey Consolidation
- Addresses unmet need for
- Subnational data
- Targeted populations and topics
- Quick turnaround
Slide 3
Early SLAITS
- Department support for pilot
- Abbreviated NHIS
- State level data
- Platform for additional topics
- Interest but not forward funded
- Find a niche
- Customized surveys
Slide 4
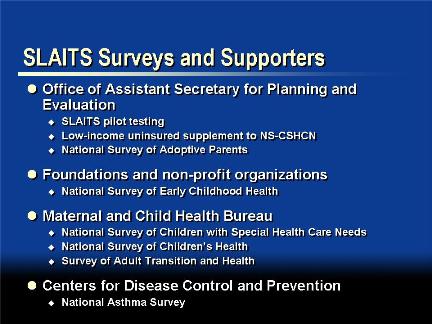
SLAITS Surveys and Supporters
- Office of Assistant Secretary for Planning and Evaluation
- SLAITS pilot testing
- Low-income uninsured supplement to NS-CSHCN
- National Survey of Adoptive Parents
- Foundations and non-profit organizations
- National Survey of Early Childhood Health
- Maternal and Child Health Bureau
- National Survey of Children with Special Health Care Needs
- National Survey of Children’s Health
- Survey of Adult Transition and Health
- Centers for Disease Control and Prevention
- National Asthma Survey
Slide 5
National Survey of Children with Special Health Care Needs
- Produces national and state-based estimates on the prevalence of children with special health care needs (CSHCN) and the impact on children, families, and health care systems
- Fielded in 2001, 2005-2006 (and 2009)
- $10 – 12m
Slide 6
National Survey of CSHCN Interview Process
- Screen > 2 million telephone lines to identify households with children < age 18
- Screen all children for CSHCN
- Detailed questionnaire for 750-800 CSHCN per state (38,000 – 40,000 nationally)
- In 2001, DHHS/ASPE funded health insurance questions for an additional 176,000 children, and SCHIP and Medicaid experience questions for eligible but uninsured children
Slide 7
National Survey of Children’s Health
- Produces national and state-based estimates on the health and well-being of children, their families, and their communities
- 102,000 interviews in 2003
- 84,000 interviews in 2007 (ongoing)
- $9 – 11m
Slide 8
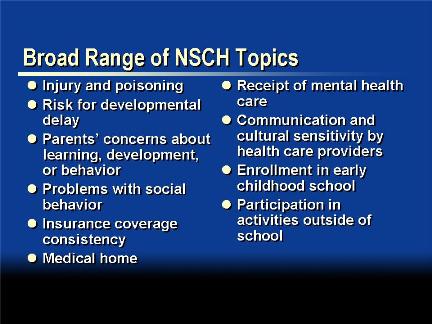
Broad Range of NSCH Topics
- Injury and poisoning
- Risk for developmental delay
- Parents’ concerns about learning, development, or behavior
- Problems with social behavior
- Insurance coverage consistency
- Medical home
- Receipt of mental health care
- Communication and cultural sensitivity by health care providers
- Enrollment in early childhood school
- Participation in activities outside of school
Slide 9
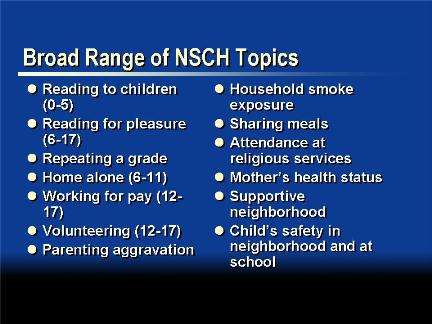
Broad Range of NSCH Topics
- Reading to children (0-5)
- Reading for pleasure (6-17)
- Repeating a grade
- Home alone (6-11)
- Working for pay (12-17)
- Volunteering (12-17)
- Parenting aggravation
- Household smoke exposure
- Sharing meals
- Attendance at religious services
- Mother’s health status
- Supportive neighborhood
- Child’s safety in neighborhood and at school
Slide 10
National Survey of Adoptive Parents
- Nationally representative data on the pre- and post-adoption experiences of the adoptive family
- Linkable to health data from the NSCH
- National sample size ? 2,000 children
- $800K
Slide 11
National Survey of Early Childhood Health
- Examines parent’s perceptions of pediatric care for children 4-35 months
- Fielded nationally in 2000
- AAP is seeking Gerber Foundation funds to field it again in 2008
- $0.5 – 1.0m
Slide 12
National Asthma Survey
- Produced estimates of the prevalence of asthma and its management, home environment, family history, and medication use
- Fielded nationally and in 4 states in 2003
- $5m (includes multiple experimental phases)
Slide 13
Journal Articles based on SLAITS data
- Two special issues of Pediatrics and one special issue of Maternal and Child Health Journal based on SLAITS data
- Over 120 journal articles published in past 6 years
Slide 14
Published Methodology Reports
Slide 15
Examples of Innovations in Telephone Survey Methodology
- Multi-language interviewing
- Incentives to increase response rates
- Sampling weight adjustments to account for households without telephones
- Tracking of coverage bias due to wireless-only households
Slide 16
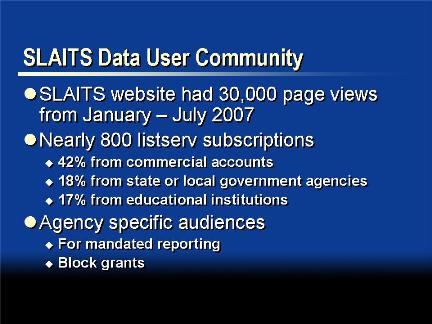
SLAITS Data User Community
- SLAITS website had 30,000 page views from January – July 2007
- Nearly 800 listserv subscriptions
- 42% from commercial accounts
- 18% from state or local government agencies
- 17% from educational institutions
- Agency specific audiences
- For mandated reporting
- Block grants
Slide 17
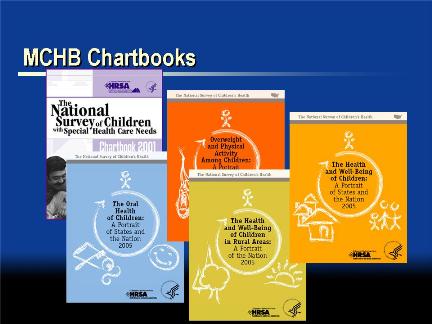
MCHB Chartbooks
Slide 18
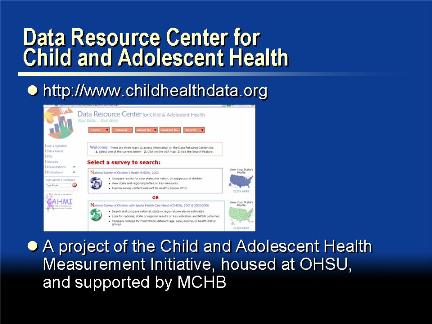
Data Resource Center for Child and Adolescent Health
- http://www.childhealthdata.org
- A project of the Child and Adolescent Health Measurement Initiative, housed at OHSU, and supported by MCHB
Slide 19
Data Resource Center for Child and Adolescent Health
- User friendly interactive search feature allows users to select, compare, and download NS-CSHCN and NSCH tables and graphs for every state
- Staff provide technical assistance to policymakers, program leaders, advocates and researchers
- 125,000 unique visits since April 2005
- Majority of users are from state government, healthcare organizations, and advocacy groups
Slide 20
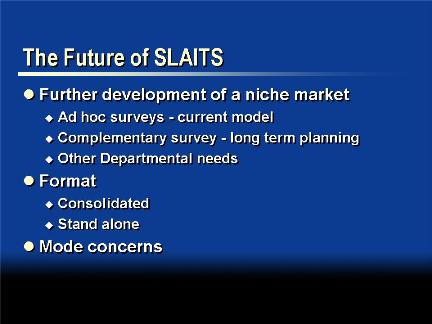
The Future of SLAITS
- Further development of a niche market
- Ad hoc surveys – current model
- Complementary survey – long term planning
- Other Departmental needs
- Format
- Consolidated
- Stand alone
- Mode concerns
Slide 21
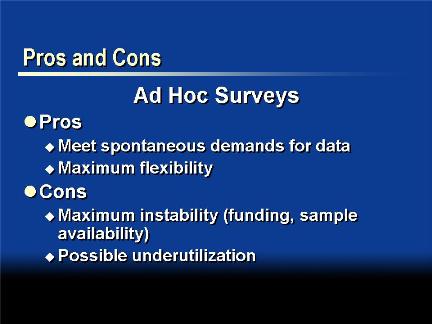
Pros and Cons of Ad Hoc Surveys
- Pros
- Meet spontaneous demands for data
- Maximum flexibility
- Cons
- Maximum instability (funding, sample availability)
- Possible underutilization
Slide 22
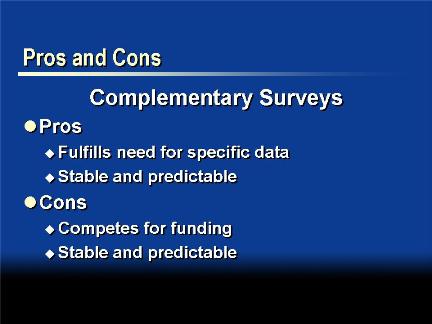
Pros and Cons of Complementary Surveys
- Pros
- Fulfills need for specific data
- Stable and predictable
- Cons
- Competes for funding
- Stable and predictable
Slide 23
For the Committee’s Consideration
- Feasibility – expansion into other modes
- Market – NCHS mission and beyond
- Funding – primary driver
- Topics – solicitation/decision making