 |
|
|
|
|
|
|
| ||||||||||
|
|
|
|
|
|
|
||||
| ||||||||||
|
|
|
|
|
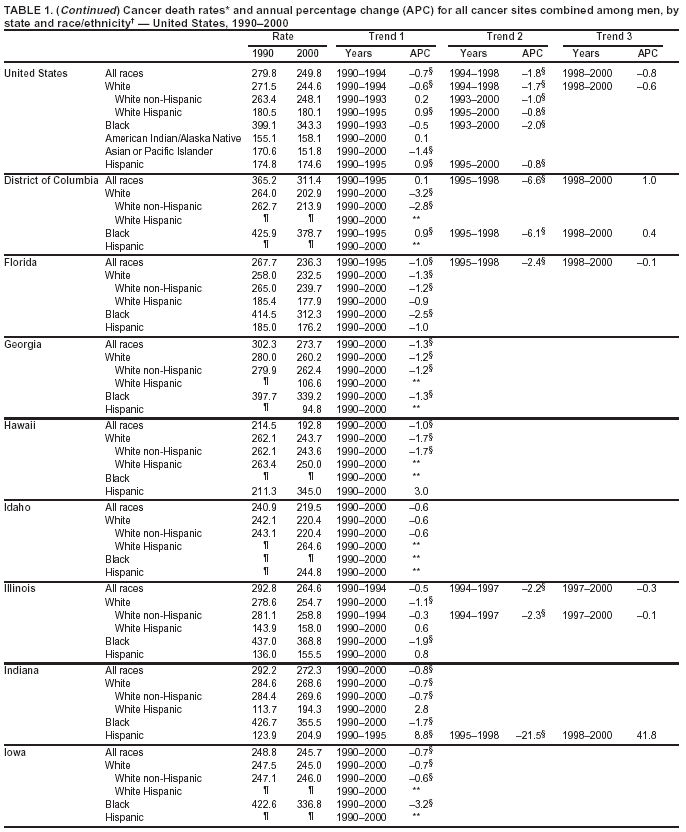
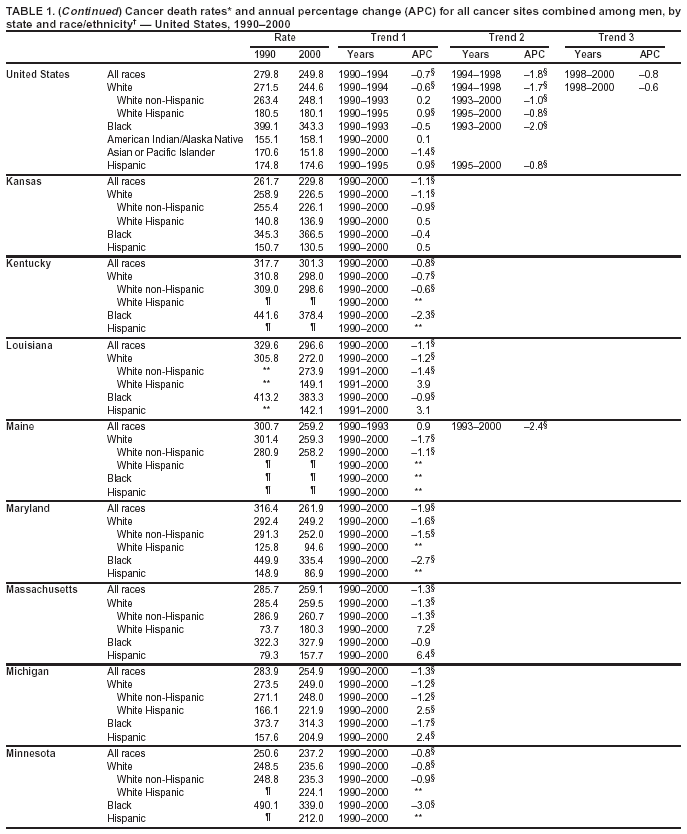
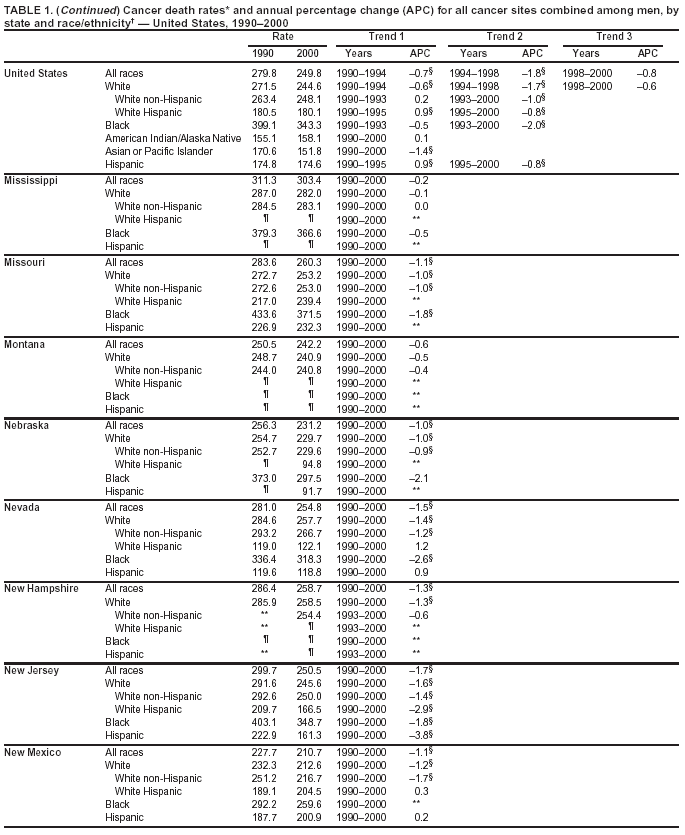
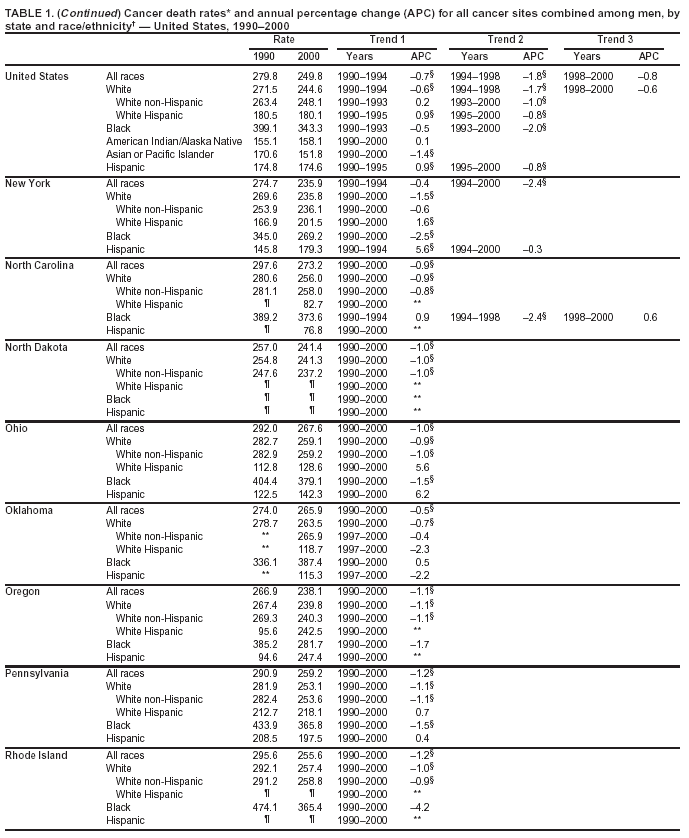
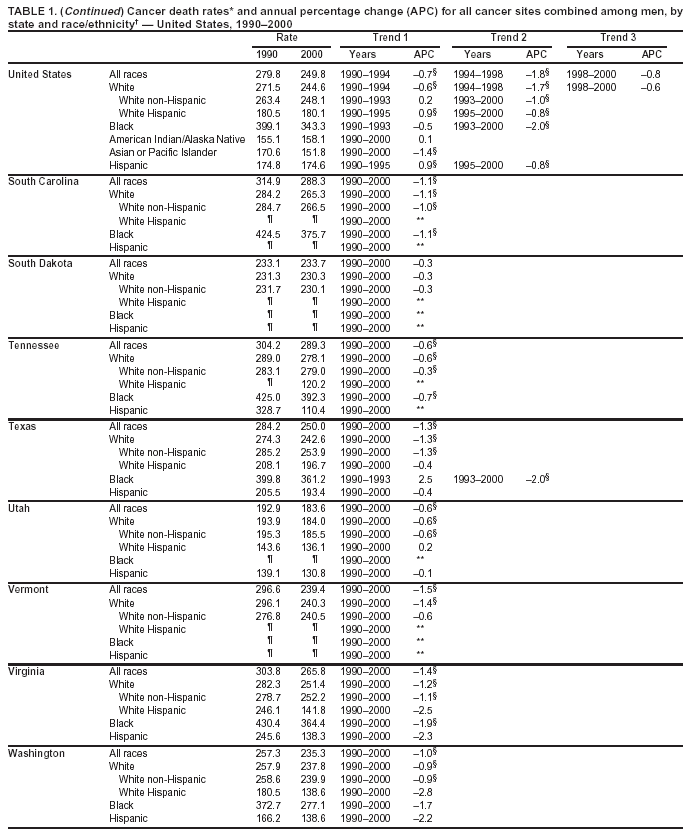
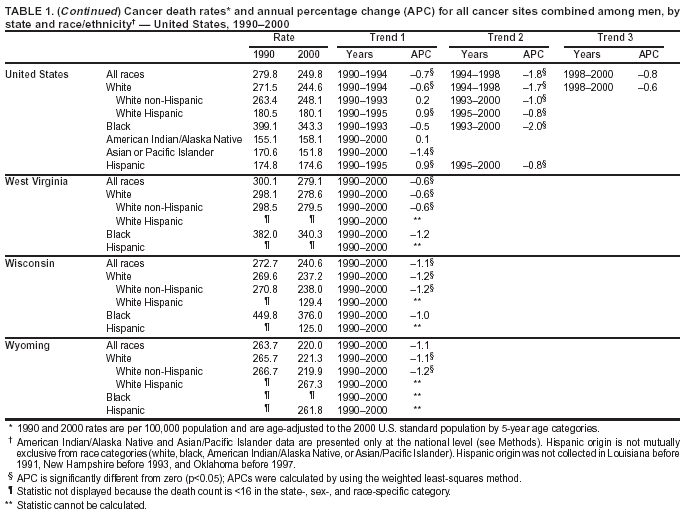
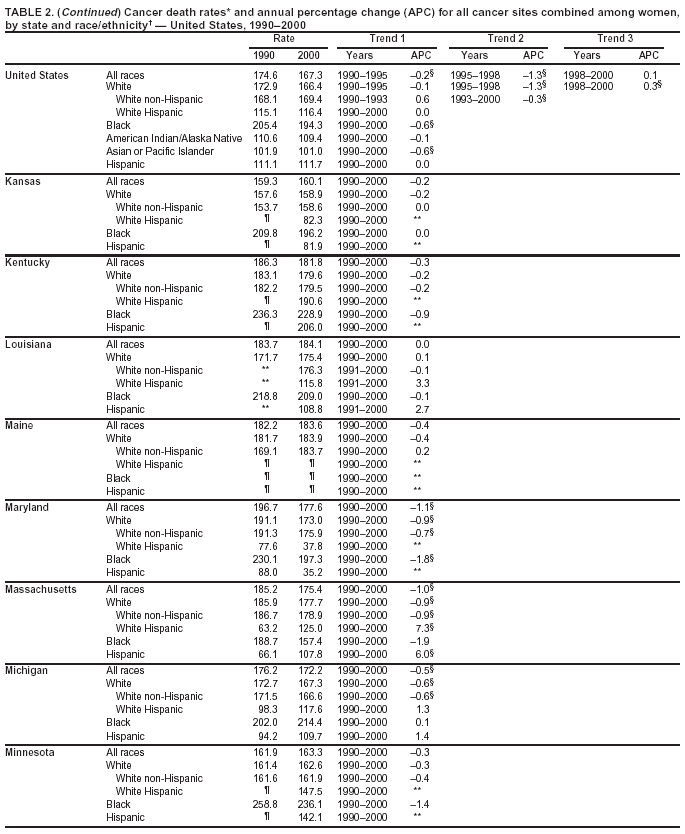
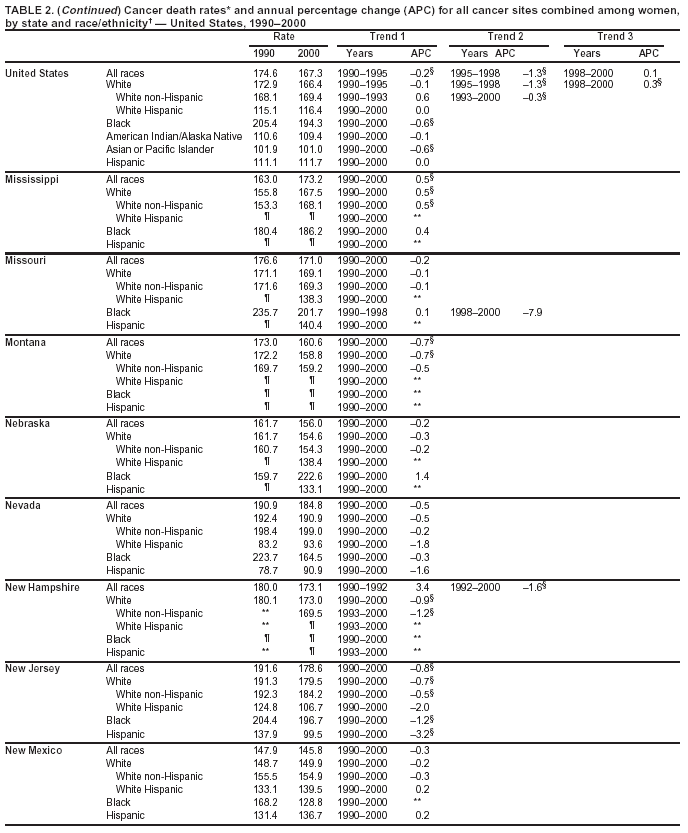
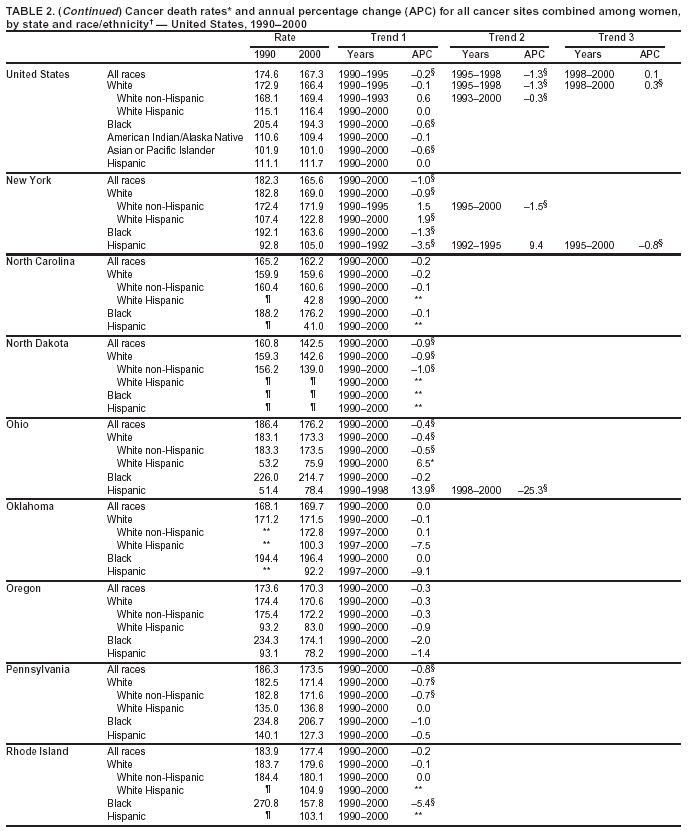
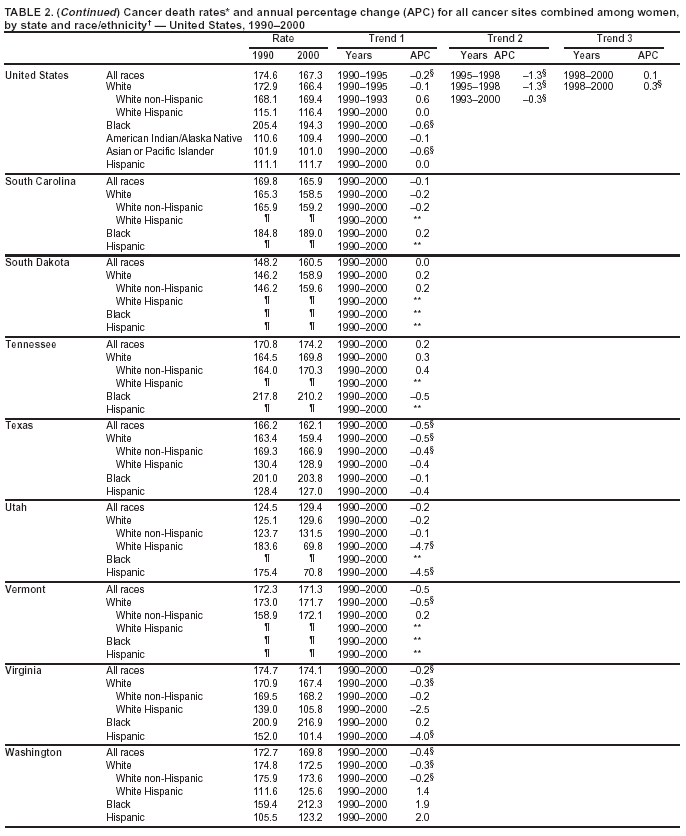
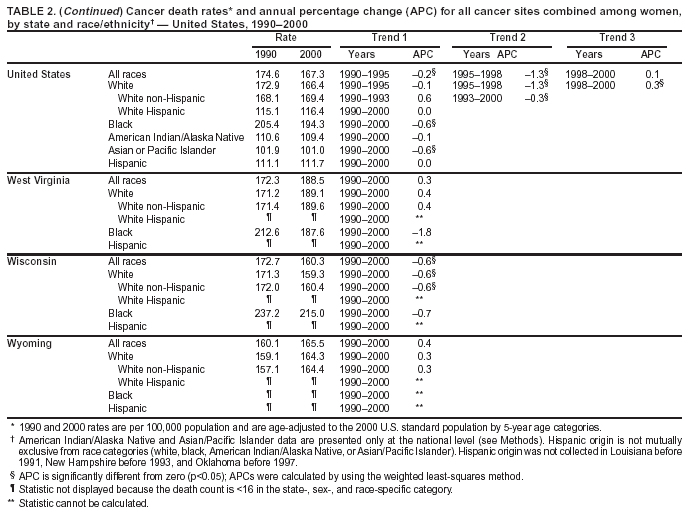
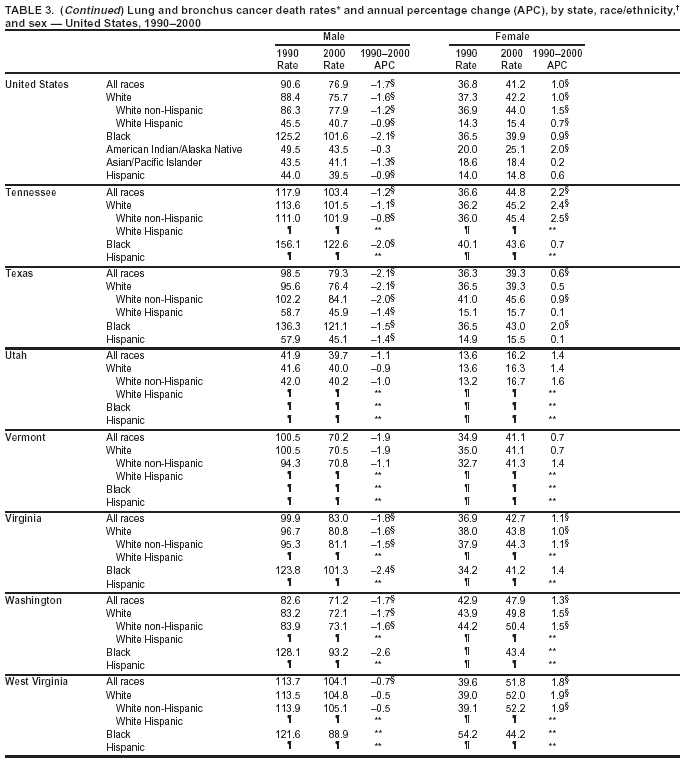
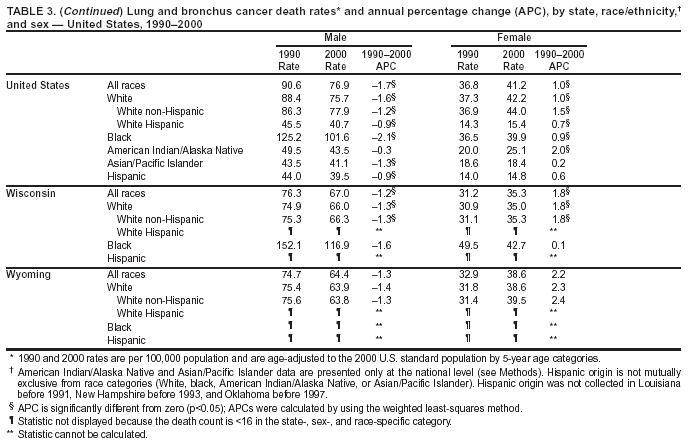
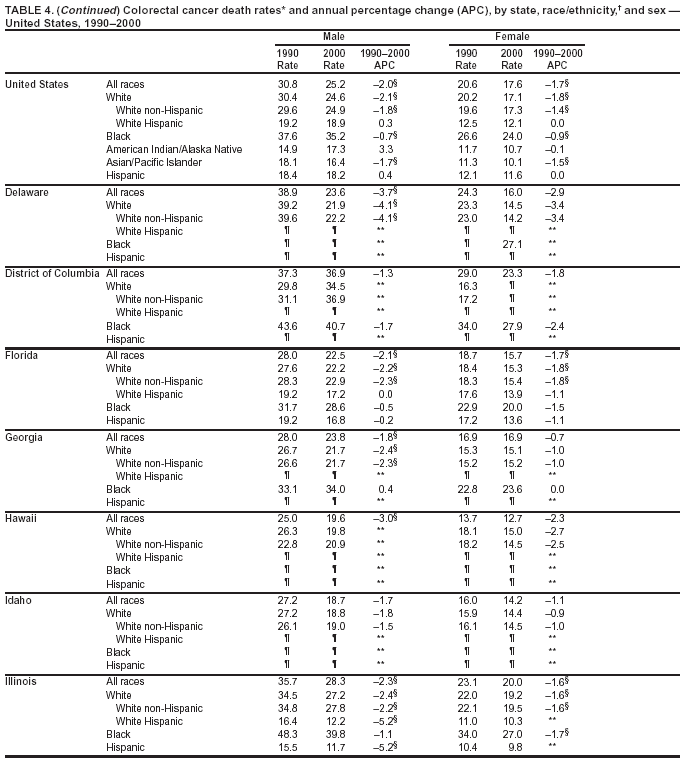
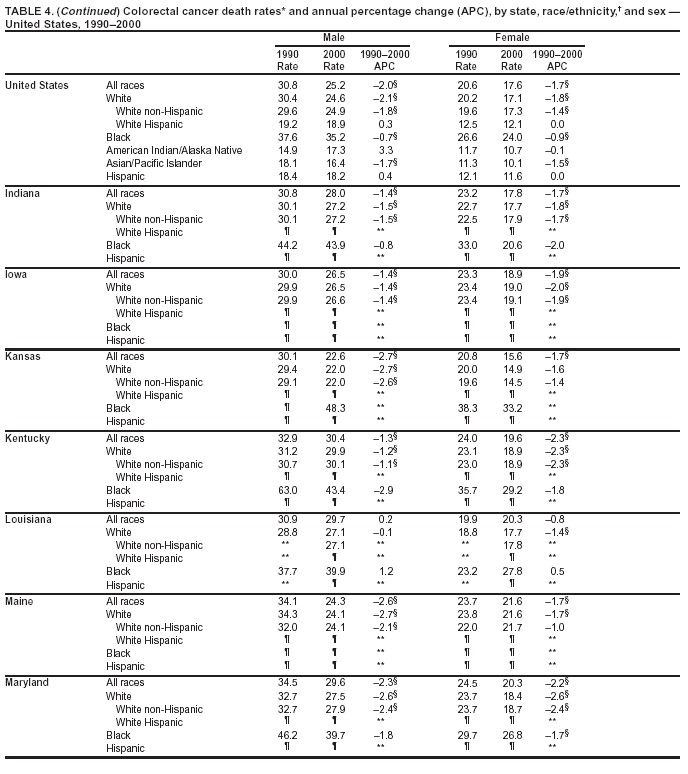
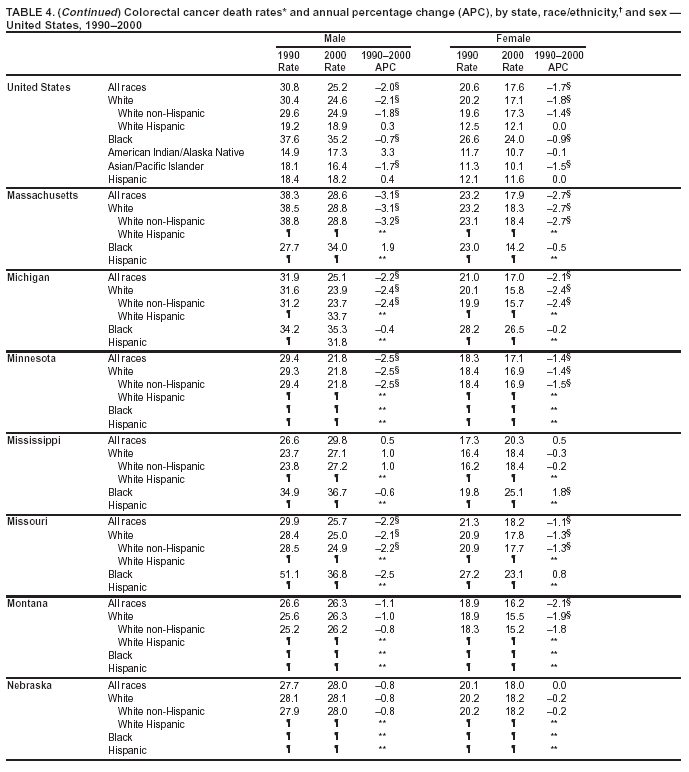
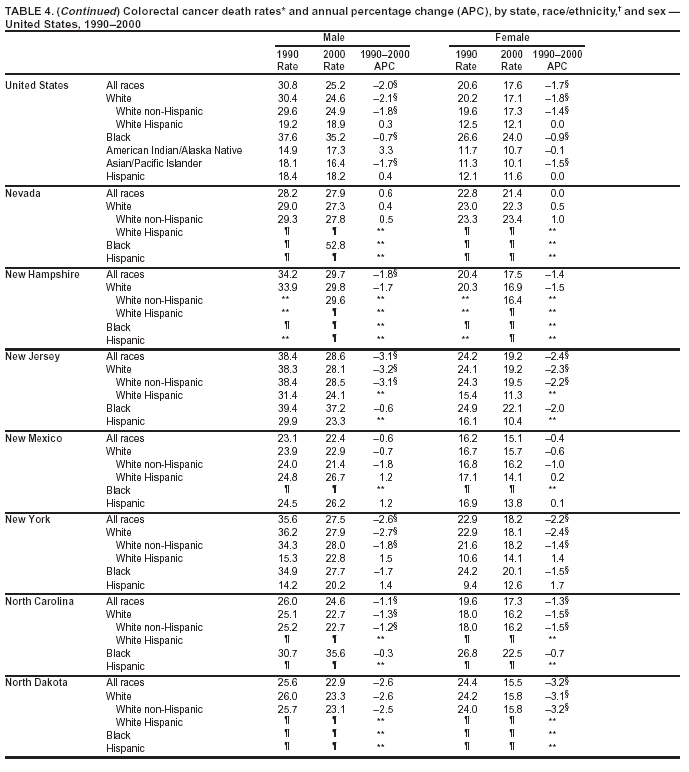
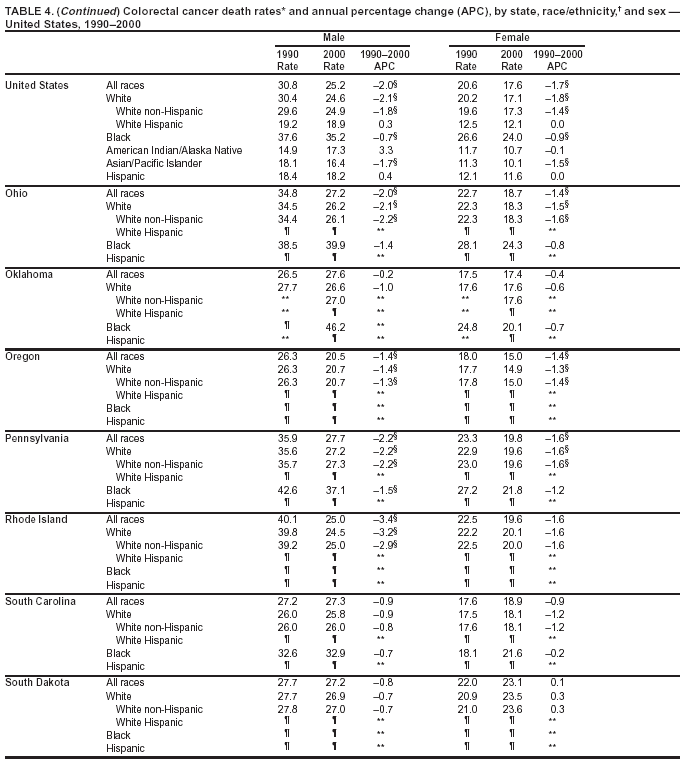
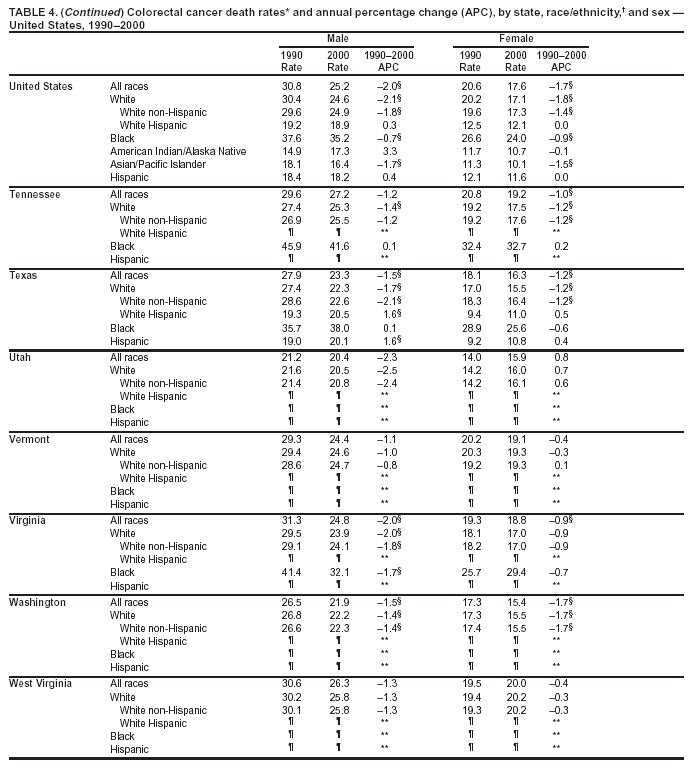
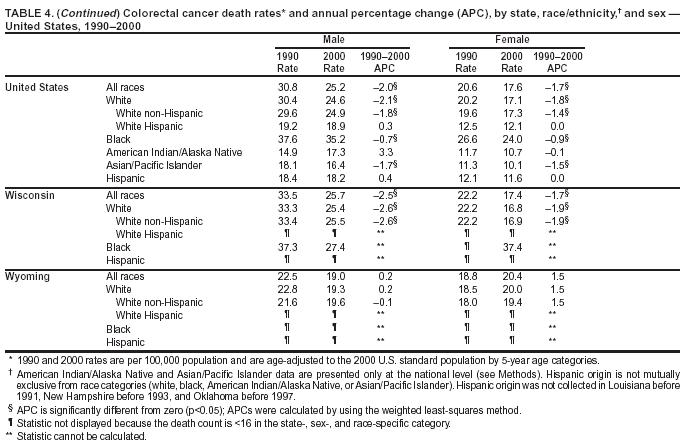
Persons using assistive technology might not be able to fully access information in this file. For assistance, please send e-mail to: mmwrq@cdc.gov. Type 508 Accommodation and the title of the report in the subject line of e-mail. Cancer Mortality Surveillance --- United States, 1990--2000Sherri L. Stewart, Ph.D. Abstract Problem/Condition: Cancer is the second leading cause of death in the United States and is expected to become the leading cause of death within the next decade. Considerable variation exists in cancer mortality between the sexes and among different racial/ethnic populations and geographic locations. The description of mortality data by state, sex, and race/ethnicity is essential for cancer-control researchers to target areas of need and develop programs that reduce the burden of cancer. Reporting Period Covered: 1990--2000. Description of System: Mortality data from CDC were used to calculate death rates and trends, categorized by state, sex, and race/ethnicity. Trend analyses for 1990--2000 are presented for all cancer sites combined and for the four leading cancers causing death (lung/bronchus, colorectal, prostate, and breast) categorized by state, sex, and race/ethnicity. Death rates per 100,000 population for the 10 primary cancer sites with the highest age-adjusted rates are also presented for each state and the District of Columbia by sex. For males, the 10 primary sites include lung/bronchus, prostate, colon/rectum, pancreas, leukemia, non-Hodgkin lymphoma, liver/intrahepatic bile duct, esophagus, stomach, and urinary bladder. For females, the 10 primary sites include lung/bronchus, breast, colon/rectum, pancreas, ovary, non-Hodgkin lymphoma, leukemia, brain/other nervous system, uterine corpus, and myeloma. Results: For 1990--2000, cancer mortality decreased among the majority of racial/ethnic populations and geographic locations in the United States. Statistically significant decreases in mortality among all races combined occurred with lung and bronchus cancer among men (--1.7%/year); colorectal cancer among men and women (--2.0%/year and --1.7%/year, respectively); prostate cancer (--2.6%/year); and female breast cancer (--2.3%/year). For 1990--2000, cancer mortality remained stable among American Indian/Alaska Native populations. Statistically significant increases in lung and bronchus cancer mortality occurred among women of all racial/ethnic backgrounds, except among Asian/Pacific Islanders. Interpretation: Although cancer remains the second leading cause of death in the United States, the overall declining trend in cancer mortality demonstrates considerable progress in cancer prevention, early detection, and treatment. Public Health Action: More effective tobacco-cessation programs are necessary to reduce lung and bronchus cancer mortality among women and sustain the decrease in lung and bronchus cancer mortality among men. Additional programs that deter smoking initiation among adolescents are essential to ensure future decreases in lung and bronchus cancer mortality. Continued research in primary prevention, screening methods, and therapeutics is needed to further reduce disparities and improve quality of life and survival among all populations. IntroductionCancer is the second leading cause of death in the United States (1) and is expected to become the leading cause of death in the next decade. In 2001, the age-adjusted death rate for cancer exceeded that for heart disease in four states, Alaska, Minnesota, Montana, and Oregon (2). One in every four deaths in the United States is from cancer, and >2.5 million persons died of cancer during the 5-year period spanning 1996--2000 (3). The U.S. population is aging; therefore, despite advances in detection and treatment, twice the number of persons might experience and be treated for cancer in the next 50 years (4). In addition, the fact that the population is aging might have an impact on cancer survival (5). Lung and bronchus, colorectal, prostate, and breast cancer are the four leading causes of cancer death in the United States (1). In 2004, approximately 25% of cancer deaths among women and 32% of cancer deaths among men will be from lung and bronchus cancer, and 10% of cancer deaths among men and women will be from colorectal cancer (1). Ten percent of cancer deaths among men will be from prostate cancer, and 15% of cancer deaths among women will be from breast cancer (1). Multiple studies have documented geographic-, sex-, and racial/ethnic-specific differences in cancer mortality (6--14). Overall, cancer mortality is higher among men compared with women and higher among black populations compared with whites (6--9). Overall, substantial variation exists among geographic locations (10--12), even within a specific racial/ethnic population (13,14). Unequal access to cancer screening and treatment, socioeconomic status, lifestyle factors (e.g., diet, exercise, smoking, and alcohol use), and tumor biology have been suggested as causes of cancer mortality variations (6--14). Cancer mortality data, for specific racial/ethnic populations at the national and state levels, are essential for developing cancer prevention and control programs. These data provide valuable information for identifying where to enhance screening efforts, for increasing access to health care, for assessing the quality of health care, and for developing research plans. In this report, we present rates and trends in cancer mortality data for all cancer sites combined and for the four most commonly diagnosed cancers in the United States by state, sex, and race/ethnicity. Death rates for the 10 primary cancer sites with the highest age-adjusted rates are also presented for each state and the District of Columbia by sex. MethodsMortality data presented in this report were collected by CDC's National Center for Health Statistics (NCHS) (15). SEER*Stat, a statistical software package created and maintained by the National Cancer Institute's (NCI) Surveillance, Epidemiology, and End Results (SEER)* Program (16), was used to calculate the cancer death rates and trends presented (Tables 1--8). Population estimates used as denominators in the death rate calculation are from the U.S. Bureau of the Census and modified by SEER (16). Population estimates are available for race (white, black, American Indian/Alaska Native [AI/AN], and Asian/Pacific Islander [A/PI]) and Hispanic origin (Hispanic, white non-Hispanic, and white Hispanic) (16). All rates presented are per 100,000 population and are age-adjusted to the 2000 U.S. standard population by 5-year age groups. A rate was calculated when >16 deaths occurred in a state-, sex-, and race/ethnicity-specific category. Rates based on death counts <16 were suppressed to avoid presenting unstable rates and to protect patient confidentiality.† Information regarding cancer death is based on primary site (i.e., the body organ in which the cancer arose). The terms all cancer sites combined and all cancers combined are used routinely in reporting cancer-specific statistical data and are used in this summary when presenting cancer rates and trends. The terms refer to an analysis of all malignant cancers of any primary site of origin, including such cancer types as leukemias and lymphomas. Death rates are presented at the national level by expanded race groupings (i.e., all races combined, white, black, A/PI, AI/AN) and by Hispanic origin (i.e., white Hispanic, white non-Hispanic, and Hispanic) (Tables 1--6). State-specific death rates are presented by sex and race/ethnicity (i.e., all races combined, white, white non-Hispanic, white Hispanic, black, and Hispanic) (Tables 1--6). Because of suppression criteria, death rates for AI/ANs and A/PIs by state and sex were only available for a limited number of states and cancer sites and are presented separately (Tables 7 and 8). Annual percentage change (APC) was used to describe recent trends (i.e., during 1990--2000) (Tables 1--8) (16). In certain cases, APCs could not be calculated for 1990--2000 because of suppressed counts during the 11--year period. Statistical significance testing of APCs was performed in SEER*Stat by the weighted least-squares method at significance level a = 0.05. Data are presented graphically also, and these analyses were performed by using the SEER Joinpoint Regression Program§ (Figure 1 and even-numbered Figures 2--102) (17). Joinpoint analysis allows for the description of statistically significant changes in trends within a given period. Trends are illustrated in the graphs by using a statistical model that chooses line segments that change slope at joinpoints denoting a statistically significant change in trend (17). On the figures, lines represent trends, and symbols represent calculated rates (Figure 1 and even-numbered Figures 2--102). For Joinpoint analysis, the overall statistical significance level was a = 0.05, with a maximum of three joinpoints and four line segments allowed. An APC was used to describe the trend for each line segment generated in the Joinpoint Program. APCs for specific years, corresponding to the graphed Joinpoint trend lines, are presented (Tables 1 and 2). Death rates for the 10 primary cancer sites with the highest age-adjusted rates by state for all races combined were created by using S-Plus® (Insightful Corporation, Seattle, Washington) (odd-numbered Figures 3--103).¶ Five-year aggregate rates during 1996--2000 were calculated by taking the sum of death counts for the 5-year period and dividing by the population totals for the same 5-year period. The resulting rates were then age-adjusted to the 2000 U.S. standard population by 5-year age groups. Five-year rates were calculated to improve the stability of the estimates. For each primary cancer site, the state-specific rate was compared with the rate calculated for the United States. Tests for statistically significant differences between each state and the national death rates were performed by using the rate-ratio test. A conservative significance level, a = 0.001, was chosen because of multiple comparisons being performed on the rates. Data are presented in this report, where available, by race and ethnicity. Hispanic origin is not mutually exclusive from the race categories (white, black, AI/AN, and A/PI) because race data are collected separately from Hispanic origin on death certificates. Three states whose data are presented began to collect Hispanic ethnicity at different times during 1990--2000. Louisiana began to collect Hispanic origin data in 1991; New Hampshire in 1993; and Oklahoma in 1997. Thus, Hispanic origin rates and APCs throughout are only presented for these states from the first year of collection of the data item through 2000.** Results††All Cancer SitesAll Races Combined During 1990--1998, mortality from all cancers declined among men and women of all races, with a more rapid decline occurring during 1994--1998 for men (--1.8%/year) and during 1995--1998 for women (--1.3%/year). Cancer mortality stabilized during 1998--2000 among men and women of all races (--0.8%/year and 0.1%/year, respectively) (Tables 1 and 2) (Figure 1). In 2000, death rates of all cancers were approximately 1.5 times higher among men compared with women (249.8 for men; 167.3 for women) (Tables 1 and 2) (Figure 1). In 2000, death rates among men and women were the highest in the District of Columbia (311.4 and 190.9, respectively) (Tables 1 and 2) (Figure 1). Five-year aggregate death rates were significantly higher among men in the District of Columbia compared with the U.S. aggregate death rate for prostate (54.2 versus 32.9), colorectal (32.5 versus 25.8), esophageal (13.8 versus 7.6), stomach (11.2 versus 6.9), liver (10.9 versus 6.6), and oral cavity/pharynx (9.4 versus 4.4) cancers (Figure 19). Five-year aggregate death rates were significantly higher among women in the District of Columbia compared with the U.S. aggregate death rate for breast (37.6 versus 27.7), colorectal (22.7 versus 18.0), uterine (7.4 versus 4.1), stomach (6.5 versus 3.4), and cervical (4.8 versus 3.0) cancers and myeloma (6.0 versus 3.2) (Figure 19). In 2000, Mississippi and Kentucky had the second and third highest death rates (303.4 and 301.3, respectively) for all cancer sites combined among men; West Virginia (188.5) and Alaska (185.1) had the second and third highest among women (Figures 4, 36, 50, and 98). In 2000, Utah had the lowest death rates for all cancer sites combined among men (183.6) and the second lowest among women (129.4). Hawaii had the lowest rate for women (127.1) and the second lowest rate for men (192.8). Colorado had the third lowest death rate for men (209.7) for all cancer sites combined; North Dakota had the third lowest among women (142.5) (Tables 1 and 2) (Figures 12, 24, 70, 90). Five-year aggregate death rates were significantly lower among men and women in Utah compared with the U.S. aggregate death rate for lung and bronchus (36.7 versus 79.5 for men; 17.6 versus 40.7 for women), colorectal (18.8 versus 25.8 for men; 14.9 versus 18.0 for women), and pancreatic (9.6 versus 12.2 for men; 6.5 versus 9.2 for women) cancers. A significantly lower rate for stomach cancer was also observed for men in Utah (4.8 versus 6.9) (Figure 91). Additionally, Utah is the only state whose 5-year aggregate rates indicate breast cancer, not lung and bronchus cancer, as the leading cause of cancer-related death among women (23.7 for breast; 17.6 for lung/bronchus) (Figure 91). Five-year aggregate death rates were significantly lower among men and women in Hawaii compared with the U.S. aggregate death rate for lung and bronchus (54.3 versus 79.5 for men; 27.4 versus 40.7 for women) and colorectal cancers (19.6 versus 25.8 for men; 12.9 versus 18.0 for women), and for leukemia (7.4 versus 10.3 for men; 4.3 versus 5.9 for women). Significantly lower rates for prostate and esophageal cancers among men and breast and ovarian cancers among women were also observed in Hawaii (21.9 versus 32.9 for prostate, 5.6 versus 7.6 for esophageal, 20.0 versus 27.7 for breast, and 5.9 versus 8.8 for ovarian cancers) (Figure 25). During 1990--2000, mortality from all cancers declined among black and A/PI men (--2.0%/year and --1.4%/year) and women (--0.6%/year and --0.6%/year), although the decline in the early 1990s was not statistically significant for black men (--0.5%/year). Declines in mortality also occurred among white men and women in the mid 1990s (--1.7%/year and --1.3%/year, respectively), and Hispanic men during 1995--2000 (--0.8%/year). During 1990--2000, cancer mortality was stable among AI/AN men and women (0.1%/year and --0.1%/year, respectively), and among Hispanic women (0%/year). Cancer mortality significantly increased among white women during 1998--2000 (0.3%/year) (Tables 1 and 2) (Figure 1). Race-Specific Cancer Mortality During 1990--2000, declines in mortality from all cancers for black men were observed in 35 states, ranging from --0.5%/year to --4.3%/year, with a significant decline occurring in 24 states. For black women, 28 states demonstrated declines in cancer mortality, ranging from --0.1%/year to --5.4%/year, with a significant decline occurring in seven states (Tables 1 and 2). During 1998--2000, a significant increase in mortality among black men was reported in North Carolina (0.6%/year) (Table 1) (Figure 68). During 1990--2000, declines in mortality from all cancers for white men were observed in all 50 states and the District of Columbia, ranging from --0.1%/year to --3.2%/year, with a significant decline occurring in 45 states. For white women, 42 states demonstrated declines in cancer mortality, ranging from --0.1%/year to --1.6%/year, with a significant decline occurring in 24 states (Tables 1 and 2). During 1990--2000, a significant increase in cancer mortality was observed among white women in Mississippi (0.5%/year) (Table 2) (Figure 50). In 2000, black men and women had the highest death rates of all cancers (343.3 and 194.3, respectively), followed by white (244.6 and 166.4, respectively), Hispanic (174.6 and 111.7), AI/AN (158.1 and 109.4), and A/PI (151.8 and 101.0) men and women (Tables 1 and 2) (Figure 1). In 2000, death rates among black men were approximately 1.4 times higher compared with white men (343.3 versus 244.6), and 2.2 times higher compared with A/PI men (343.3 versus 151.8). In 2000, death rates among black women were approximately 1.2 times higher compared with white women (194.3 versus 166.4), and 1.9 times higher compared with A/PI women (194.3 versus 101.0) (Tables 1 and 2) (Figure 1). Lung and Bronchus CancerAll Races Combined During 1990--2000, lung and bronchus cancer mortality declined by 1.7%/year among men and increased by 1.0%/year among women (rate was 90.6 in 1990 and 76.9 in 2000 for men; rate was 36.8 in 1990 and 41.2 in 2000 for women) (Table 3). These changes were statistically significant. In 2000, lung and bronchus cancer death rates among men were approximately 1.9 times higher compared with those among women (76.9 versus 41.2). In 2000, Kentucky had the highest lung and bronchus cancer death rates among men (116.1) and the second highest among women (54.0) (Table 3). In 2000, Nevada had the highest death rate among women (56.1); Mississippi had the second highest among men (111.7). In 2000, West Virginia had the third highest lung and bronchus cancer death rate among men (104.1) and women (51.8). In 2000, Utah had the lowest lung and bronchus death rate among men (39.7) and women (16.2), and Hawaii had the second lowest (49.8 for men; 23.8 for women) (Table 3). Colorado had the third lowest death rate among men (52.1), and North Dakota had the third lowest death rate among women (28.3). Race-Specific Lung and Bronchus Cancer Mortality During 1990--2000, a statistically significant decline in lung and bronchus cancer mortality occurred among men of all racial/ethnic populations except AI/AN; declines ranged from --0.9%/year to --2.1%/year (Table 3). Among women, statistically significant increases in lung and bronchus cancer mortality, ranging from 0.7%/year to 2.0%/year, occurred among whites, blacks, and AI/ANs. During 1990--2000, declines in lung and bronchus cancer mortality for black men were observed in 32 states, ranging from --0.1%/year to --4.9%/year, with a significant decline occurring in 21 states (Table 3). For black women, 23 states demonstrated increases in lung and bronchus cancer mortality, ranging from 0.1%/year to 2.5%/year, with a significant increase occurring in six states. During 1990--2000, declines in lung and bronchus cancer mortality for white men were observed in 49 states, ranging from --0.1%/year to --5.4%/year, with a significant decline occurring in 40 states (Table 3). For white women, 47 states demonstrated increases in lung and bronchus cancer mortality, ranging from 0.3%/year to 3.2%/year, with a significant increase occurring in 30 states. In 2000, black men had the highest lung and bronchus cancer death rates (101.6), followed by white (75.7), AI/AN (43.5), A/PI (41.1), and Hispanic men (39.5). In 2000, white women had the highest lung and bronchus cancer death rates (42.2), followed by black (39.9), AI/AN (25.1), A/PI (18.4), and Hispanic women (14.8). In 2000, lung and bronchus cancer death rates among black men were approximately 1.3 times higher than white men (101.6 versus 75.7) and 2.6 times higher than Hispanic men (101.6 versus 39.5). In 2000, lung and bronchus cancer death rates were slightly higher among white women than black women (42.2 versus 39.9) and approximately 2.9 times higher among white women compared with Hispanic women (42.2 versus 14.8). Colorectal CancerAll Races Combined During 1990--2000, colorectal cancer mortality declined by 2.0%/year among men, and by 1.7%/ among women (rate was 30.8 in 1990 and 25.2 in 2000 for men; rate was 20.6 in 1990 and 17.6 in 2000 for women) (Table 4). These declines were statistically significant. In 2000, colorectal cancer death rates were approximately 1.4 times higher among men compared with women (25.2 versus 17.6). In 2000, the District of Columbia had the highest colorectal cancer death rates among men and women (36.9 for men; 23.3 for women). Alaska and Kentucky had the second and third highest rates among men (32.7 and 30.4, respectively); South Dakota and Maine had the second and third highest rates among women (23.1 and 21.6, respectively). In 2000, Idaho had the lowest colorectal cancer death rate among men (18.7), and the second lowest among women (14.2). Wyoming had the second lowest rate among men (19.0), and Hawaii had the third lowest (19.6). Hawaii had the lowest colorectal cancer death rates among women (12.7), and Colorado had the third lowest (14.7). Race-Specific Colorectal Cancer Mortality During 1990--2000, colorectal cancer mortality decreased significantly among white, black, and A/PI men and women. Colorectal cancer mortality was stable among Hispanic men and women (0.4%/year for men; 0%/year for women), and AI/AN women (--0.1%/year). During 1990--2000, decreases in colorectal cancer mortality for black men and women were observed in 18 and 20 states, respectively, ranging from --0.2%/year to --2.9%/year, with the majority of decreases being nonsignificant. A statistically significant increase in colorectal cancer mortality for black women was observed in one state, Mississippi (1.8%/year). During 1990--2000, declines in colorectal cancer mortality for white men were observed in 46 states, ranging from --0.1%/year to --4.1%/year, with a significant decline occurring in 32 states. For white women, 45 states experienced decreases in colorectal cancer mortality, ranging from --0.2%/year to --3.1%/year, with 28 states having a significant decrease. In 2000, black men and women had the highest colorectal cancer death rates (35.2 and 24.0, respectively), followed by white (24.6 for men; 17.1 for women), Hispanic (18.2 for men; 11.6 for women), AI/AN (17.3 for men; 10.7 for women), and A/PI men and women (16.4 for men; 10.1 for women). In 2000, colorectal cancer death rates among black men were approximately 1.4 times higher than white men (35.2 versus 24.6), and 2.1 times higher than A/PI men (35.2 versus 16.4). In 2000, colorectal cancer death rates were approximately 1.4 times higher among black women compared with white women (24.0 versus 17.1), and 2.4 times higher among black women compared with A/PI women (24.0 versus 10.1). Prostate CancerAll Races Combined During 1990--2000, prostate cancer mortality significantly declined by 2.6%/year among men (rate was 38.6 in 1990 and 30.6 in 2000) (Table 5). In 2000, the District of Columbia, Mississippi, and South Carolina had the highest prostate cancer death rates (52.7, 41.1, and 39.6, respectively). In 2000, Delaware, Hawaii, and Vermont had the lowest prostate cancer death rates (22.2, 22.4, and 24.2, respectively). Race-Specific Prostate Cancer Mortality During 1990--2000, prostate cancer mortality decreased significantly among white, black, and A/PI men (--2.8%/year, --1.4%/year, and --3.4%/year, respectively) (Table 5). During 1990--2000, declines in prostate cancer mortality among black men were observed in 23 states, ranging from --0.1%/year to --3.7%/year, with a significant decline occurring in eight states. During 1990--2000, declines in prostate cancer mortality among white men were observed in 49 states, ranging from --0.5%/year to --5.0%/year, with a significant decline occurring in 43 states. In 2000, prostate cancer death rates were highest among black men (69.2), followed by white, Hispanic, AI/AN, and A/PI men (27.9, 22.2, 20.1, and 12.8, respectively). In 2000, prostate cancer death rates were approximately 2.5 times higher among black men compared with white men (69.2 versus 27.9), and approximately 5.4 times higher compared with A/PI men (69.2 versus 12.8). Female Breast CancerAll Races Combined During 1990--2000, breast cancer mortality declined by 2.3%/year among women (rate was 33.1 in 1990 and 26.7 in 2000) (Table 6). This decline was statistically significant. In 2000, Delaware, New Jersey, and Louisiana had the highest breast cancer death rates among women (31.4, 31.0, 30.4, respectively). In 2000, Hawaii, Nebraska, and Utah had the lowest breast cancer death rates among women (18.1, 22.2, 22.8, respectively). Race-Specific Female Breast Cancer Mortality During 1990--2000, breast cancer mortality decreased significantly among white, black, Hispanic, and A/PI women (--2.5%/year, --0.9%/year, --1.1%/year, and --1.4%/year respectively) (Table 6). Breast cancer mortality among AI/AN women remained stable (0.2%/year). During 1990--2000, declines in breast cancer mortality among black women were observed in 21 states, ranging from --0.2%/year to --4.6%/year, with a significant decline occurring in nine states (Table 6). During 1990--2000, declines in breast cancer mortality among white women were observed in 50 states, ranging from --0.8%/year to --4.0%/year, with a significant decline occurring in 43 states. In 2000, female breast cancer death rates were highest among black women (34.6), followed by white, Hispanic, AI/AN, and A/PI women (26.3, 17.0, 13.7, and 12.3, respectively) (Table 6). In 2000, breast cancer death rates were approximately 1.3 times higher among black women compared with white women (34.6 versus 26.3), and approximately 2.8 times higher among black women compared with A/PI women (34.6 versus 12.3). Cancer Mortality Among AI/ANs and A/PIs Data for AI/ANs and A/PIs are provided only for states and cancer sites where suppression criteria permitted an analysis (see Methods). During 1990--2000, overall cancer mortality among AI/AN men and women in all states was stable (0.1%/year for men; --0.1%/year for women) (Table 7). During 1990--2000, lung and bronchus cancer mortality significantly increased among AI/AN women in the United States (2.0%/year). During 1990--2000, California and Oklahoma reported significant increases in mortality from all cancers among AI/AN men (5.0%/year and 2.8%/year, respectively), and Oklahoma reported a significant increase in lung and bronchus cancer mortality among AI/AN women (5.5%/year) (Table 7). During 1990--2000, overall cancer mortality significantly decreased among A/PIs (--1.4%/year for men and --0.6%/year for women) (Table 8). During 1990--2000, California, Florida, and Washington reported significant decreases in mortality from all cancers among A/PI men (--1.1%/year, --3.7%/year, --2.6%/year, respectively); and Hawaii and Washington reported significant decreases in mortality from all cancers among A/PI women (--0.6%/year and --3.0%/year, respectively) (Table 8). During 1990--2000, California and Hawaii reported significant decreases in prostate cancer among A/PI men (--4.4%/year and --2.6%/year, respectively) (Table 8). DiscussionThe data presented in this report indicate that cancer mortality decreased during 1990--2000 among the majority of populations, when analyzed by sex, race/ethnicity, and geographic location. Multiple factors, including cigarette smoking, cancer screening, and effective treatment options, influence cancer mortality trends. The decline in lung and bronchus cancer mortality among men is probably a result of reduced tobacco use (4,18,19) that began in the 1960s when the first U.S. Surgeon General's report on smoking and health was published (20). During 1990--2000, a decline in colorectal cancer mortality was observed also. Fecal occult blood test (FOBT) and sigmoidoscopy/colonoscopy screenings offer the best opportunities for early detection of colorectal cancer. In 2001, approximately 37% of the population aged >50 years reported having a sigmoidoscopy/colonoscopy within the last 5 years, and approximately 31% reported having an FOBT within the last 2 years (21). The use of these screening methods, which can detect colorectal cancer early (4,18,19), and the availability of more effective treatment options (22), might have contributed to the overall decrease in colorectal cancer mortality. Prostate cancer mortality decreased among all racial/ethnic populations, although death rates remain substantially higher among black men than other populations. This reduction is possibly a result of screening for serum prostate-specific antigen (PSA), although the effectiveness of screening in reducing prostate cancer mortality has not been established (23). Advances in treatment (e.g., surgery [24], radiotherapy, and more recently, hormonal therapy [antiandrogen] [25,26]), might also have contributed to the reduction in prostate cancer mortality. Reduced female breast cancer mortality might be the result of both earlier detection and improved treatment (4,18,19). In 2000, approximately 70% of women in the United States aged >40 years reported having a mammogram in the previous 2 years (27). The widespread use of tamoxifen treatment might be a contributing factor also (28). Breast cancer mortality might decrease further as a result of newer effective treatments (e.g., the aromatase inhibitor letrozole, which has been reported to substantially improve breast cancer survival after the completion of standard tamoxifen treatment among postmenopausal women [29]). Although cancer mortality decreased during 1990--2000, a statistically significant increase in lung and bronchus cancer was reported among women. This increase occurred among women of all races, except A/PI women. Approximately 90% of all lung cancer deaths among U.S. women smokers are attributable to smoking (30). Smoking prevalence among women increased from <6% in 1924 to 34% in 1965 (30), and peaked at 55% among women born during 1935--1944 (31). This rapid increase in cigarette smoking that occurred among women in the first part of the 20th century is directly related to the epidemic of lung and bronchus cancer deaths in the second half of that century (31). Smoking prevalence among women began to decline in the late 1970s (30), and this decline is expected to result in a leveling off of lung and bronchus cancer mortality among women in the 21st century (31). However, multiple current trends in tobacco smoking will negatively affect lung and bronchus cancer mortality in the future. Cigarette smoking prevalence remains high among women (22%--23% in the late 1990s) (30), and during 1993--2000, smoking prevalence did not decrease among those aged 18--24 years (32). Further research and program development targeting reduction of tobacco use among women and recommendations made by the U.S. Surgeon General (30) should serve as valuable tools in decreasing smoking prevalence among women. The findings in this report are subject to at least five limitations. First, racial/ethnic misclassification exists on death certificates, which in turn affects the death rates reported for all racial/ethnic populations. One study demonstrated that published death rates from all cancers were overstated for whites and blacks by an estimated 1.0% and 5.0%, respectively (33). Death rates are understated for AI/ANs by approximately 21%, A/PIs by approximately 11%, and Hispanics by approximately 2% (33). Relative differences in cancer mortality by race/ethnicity are probably affected by this misclassification. Second, causes of deaths are more often misclassified among minority populations as "symptoms, signs, and ill-defined conditions," and this misclassification can affect cause-specific death rates (34). Third, death rates for certain racial/ethnic populations at the state level might be unstable, particularly within geographic areas where limited numbers of a specific population reside. Fourth, death rates for certain cancers might differ among different racial/ethnic populations (e.g., high prostate cancer death rates among black men); therefore, when comparing death rates across states, the racial makeup of the state's population should be considered. Fifth, this report is a description of state and national trends and not an evaluation of cancer intervention studies; therefore, the findings presented here should be interpreted with that in mind. The overall decline in cancer mortality demonstrates progress in tobacco control and early detection and treatment of cancer. Despite this overall decline, an increase in lung and bronchus cancer mortality among women remains. Prevention strategies that reduce tobacco use among women are necessary to attenuate this increase. Programs and policies that deter smoking initiation and promote cessation among women, men, and adolescents are essential to ensure future decreases in lung and bronchus cancer mortality. Additional research is needed to sustain and further reduce the overall decline in cancer mortality. Areas of research should include improved access to and use of recommended screening methods, improved early detection methods, development of primary prevention programs, and improved diagnostic procedures and treatment. To reduce disparities in cancer mortality by sex, race/ethnicity, and geography, effective programs of comprehensive cancer care, prevention, and control should be accessible to and used by all U.S. residents. References1. American Cancer Society. Cancer facts & figures 2004. Atlanta, GA: American Cancer Society, 2004. 2. CDC. Deaths, age-adjusted death rates, and comparisons by state for selected leading causes of death. Hyattsville, MD: US Department of Health and Human Services, CDC, National Center for Health Statistics, 2003. Available at http://www.cdc.gov/nchs/releases/03facts/mortalitytables.htm. 3. Hotes JL, Wu X-C, McLaughlin C, et al., eds. Cancer in North America, 1996--2000. Volume Two: Mortality. Springfield, IL: North American Association of Central Cancer Registries, 2003. 4. Edwards BK, Howe HL, Ries LAG, et al. Annual report to the nation on the status of cancer, 1973--1999, featuring implications of age and aging on U.S. cancer burden. Cancer 2002;94:2766--92. 5. Wingo PA, Ries LAG, Parker SL, Health CW Jr. Long-term cancer patient survival in the United States. Cancer Epidemiol Biomarkers Prev 1998;7:271--82. 7. Hershman D, Weinberg M, Rosner Z, et al. Ethnic neutropenia and treatment delay in African American women undergoing chemotherapy for early-stage breast cancer. J Natl Cancer Inst 2003;95:1545--8. 8. Clegg LX, Li FP, Hankey BF, Chu K, Edwards BK. Cancer survival among US whites and minorities: a SEER (Surveillance, Epidemiology, and End Results) Program population-based study. Arch Intern Med 2002;162:1985--93. 9. Chu KC, Lamar CA, Freeman HP. Racial disparities in breast carcinoma survival rates. Cancer 2003;97:2853--60. 10. CDC. Cancer death rates---Appalachia, 1994--1998. MMWR 2002;51:527--9. 11. Jemal A, Kulldorff M, Devesa SS, Hayes RB, Fraumeni JR Jr. Geographic analysis of prostate cancer mortality in the United States, 1970--89. Int J Cancer 2002;101:168--74. 12. CDC. Breast cancer incidence and mortality---United States, 1992. MMWR 1996;45:833--7. 14. Cobb N, Paisano RE. Patterns of cancer mortality among Native Americans. Cancer 1998;83:2377--83. 15. CDC. Vital statistics of the United States, 1950--1999. Volume II: Mortality, parts A and B [CD-ROM]. Washington, DC: US Department of Health and Human Services, CDC, National Center for Health Statistics, 2001. 16. Reis LAG, Eisner MP, Kosary CL, et al., eds. SEER cancer statistics review, 1975--2000. Bethesda, MD: National Cancer Institute. Available at http://seer.cancer.gov/csr/1975_2000/. 17. Kim H-J, Fay MP, Feuer EJ, Midthune DN. Permutation tests for joinpoint regression with applications to cancer rates. Stat Med 2000;19:335--51. 18. Howe HL, Wingo PA, Thun MJ et al. Annual report to the nation on the status of cancer (1973 through 1998), featuring cancers with recent increasing trends. J Natl Cancer Inst 2001;93:824--42. 19. Weir HK, Thun MJ, Hankey BF, et al. Annual report to the nation on the status of cancer, 1975--2000, featuring the uses of surveillance data for cancer prevention and control. J Natl Cancer Inst 2003;95:1276--99. 20. U.S. Public Health Service. Smoking and health. Report of the Advisory Committee to the Surgeon General of the Public Health Service. Washington, DC: US Department of Health, Education and Welfare, Public Health Service, Centers for Disease Control, 1964. 22. Moertel CG. Chemotherapy for colorectal cancer. N Engl J Med 1994;330:1136--42. 23. U.S. Preventive Services Task Force. Screening for prostate cancer: recommendation and rationale. Ann Intern Med 2002;137:915--6. 24. Holmberg L, Bill-Axelson A, Helgesen F et al. for the Scandinavian Prostatic Cancer Group Study Number 4. Randomized trial comparing radical prostatectomy with watchful waiting in early prostate cancer. N Engl J Med 2002;347:781--9. 25. Messing EM, Manola J, Sarosdy M, Wilding G, Crawford ED, Trump D. Immediate hormonal therapy compared with observation after radical prostatectomy and pelvic lymphadenectomy in men with node-positive prostate cancer. N Engl J Med 1999;341:1781--8. 26. Bolla M, Collette L, Blank L, et al. Long-term results with immediate androgen suppression and external irradiation in patients with locally advanced prostate cancer (an EORTC study): a phase II randomized trial. Lancet 2002;360:103--8. 27. Swan J, Breen N, Coates RJ, Rimer BK, Lee NC. Progress in cancer screening practices in the United States: results from the 2000 National Health Interview Survey. Cancer 2003;97:1528--40. 28. Mariotto A, Feuer E, Harlan L, Wun LM, Johnson KA, Abrams J. Trends in use of adjuvant multi-agent chemotherapy and tamoxifen for breast cancer in the United States: 1975--1999. J Natl Cancer Inst 2000;94:1626--34. 29. Goss PE, Ingle JN, Martino S, et al. Randomized trial of letrozole in postmenopausal women after five years of tamoxifen therapy for early-stage breast cancer. N Engl J Med 2003;349:1793--802. 30. CDC. Women and smoking: a report of the Surgeon General. MMWR 2002;51(No. RR-12):1--30. 31. Wingo PA, Ries LAG, Giovino GA, et al. Annual report to the nation on the status of cancer, 1973--1996, with a special section on lung cancer and tobacco smoking. J Natl Cancer Inst 1999;91:675--90. 32. CDC. Cigarette smoking among adults---United States, 2000. MMWR 2002;51:642--5. 33. Rosenberg HM, Maurer JD, Sorlie PD, et al. Quality of death rates by race and Hispanic origin: a summary of current research, 1999. Hyattsville, MD: US Department of Health and Human Services, CDC, National Center for Health Statistics, 1999. (Vital and Health Statistics, Series 2, No. 128). 34. Becker TM, Wiggins CL, Key CR, Samet JM. Symptoms, signs, and ill-defined conditions: a leading cause of death among minorities. Am J Epidemiol 1990;131:664--8. * Additional information regarding SEER and the SEER*Stat software is available at http://seer.cancer.gov/seerstat. † Additional information regarding using <16 as the statistical standard is available at http://www.cdc.gov/cancer/npcr/uscs. § Additional information is available at http://srab.cancer.gov/joinpoint. ¶ Additional information is available at http://www.insightful.com/products/splus/default.asp. ** Additional information is available at http://www.cdc.gov/nchs/datawh/nchsdefs/hispanic.htm. †† All rates are per 100,000 population. Table 1 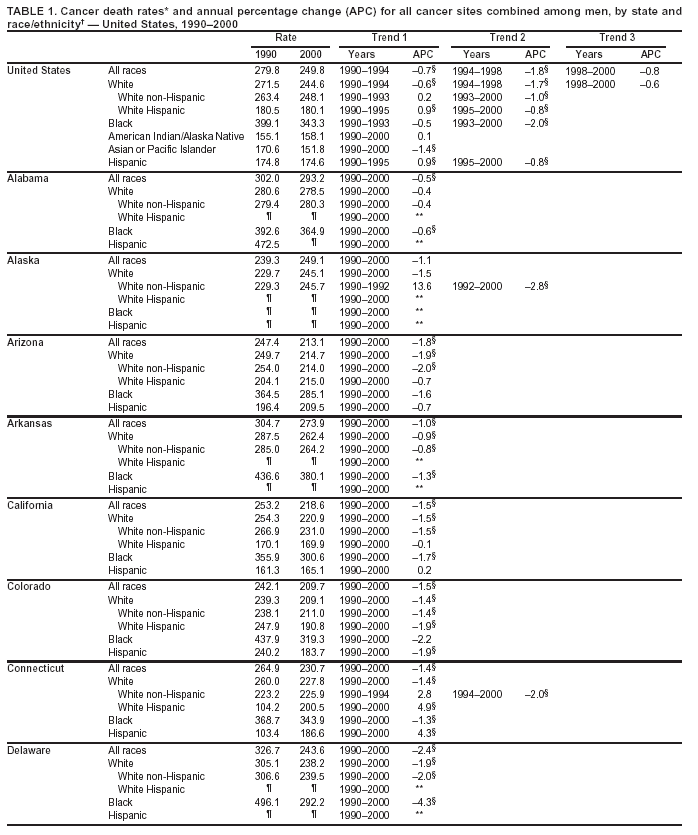
Return to top. Figure 1 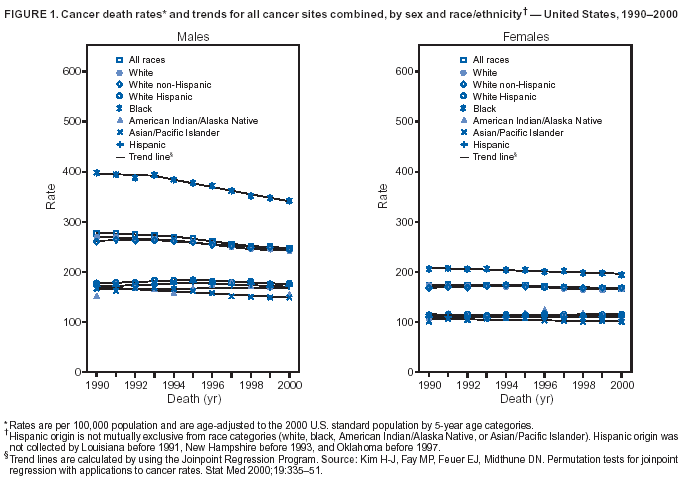 Return to top. Table 2 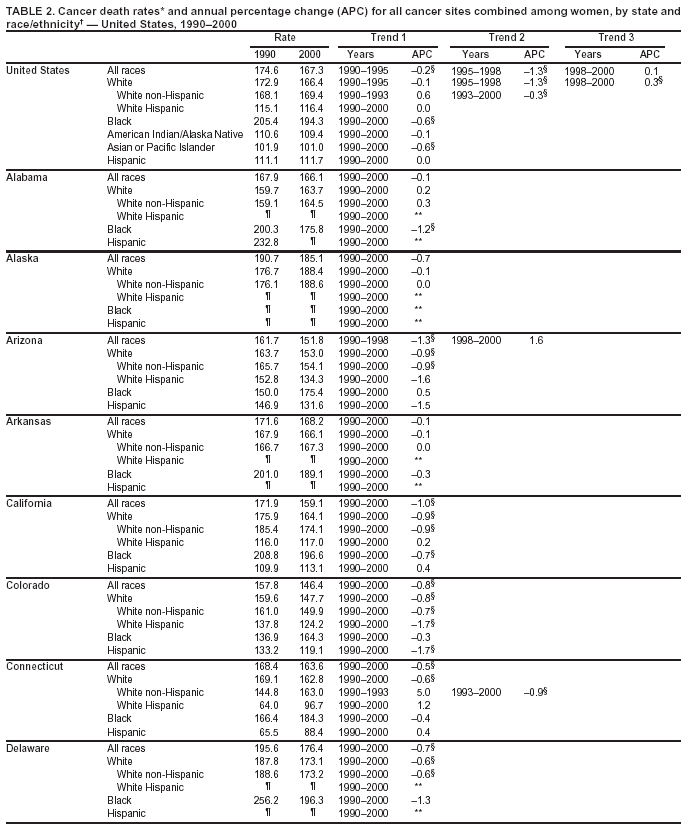 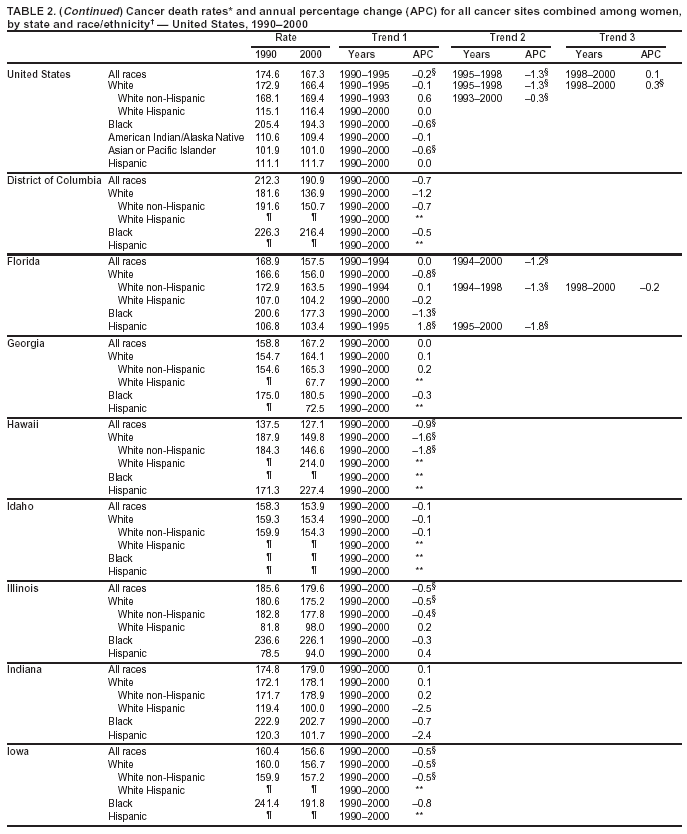
Return to top. Figure 2 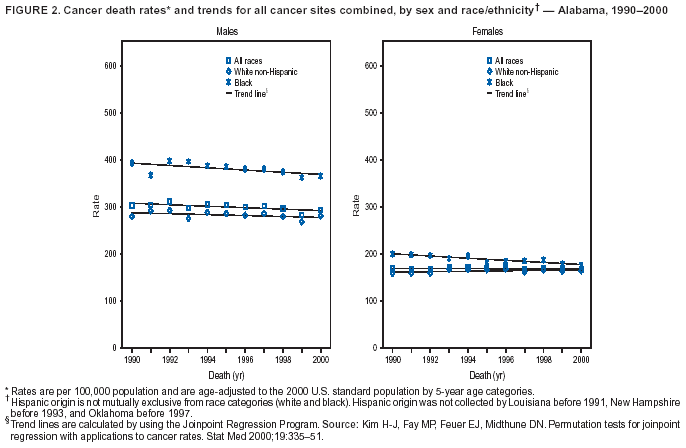 Return to top. Table 3 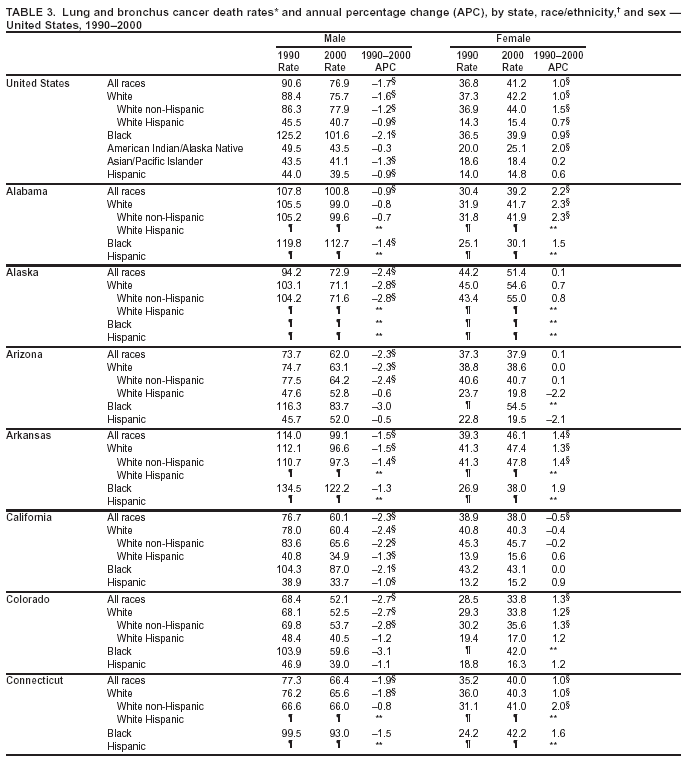 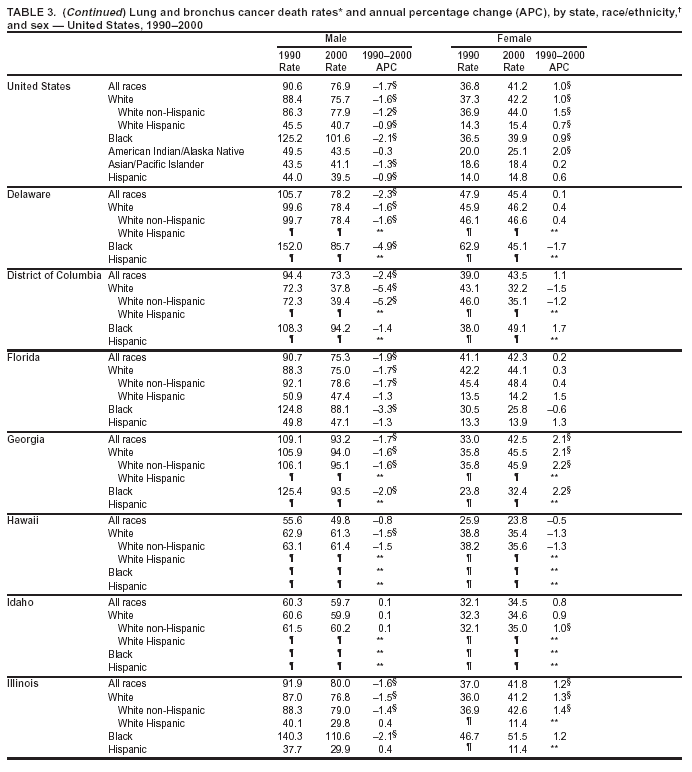 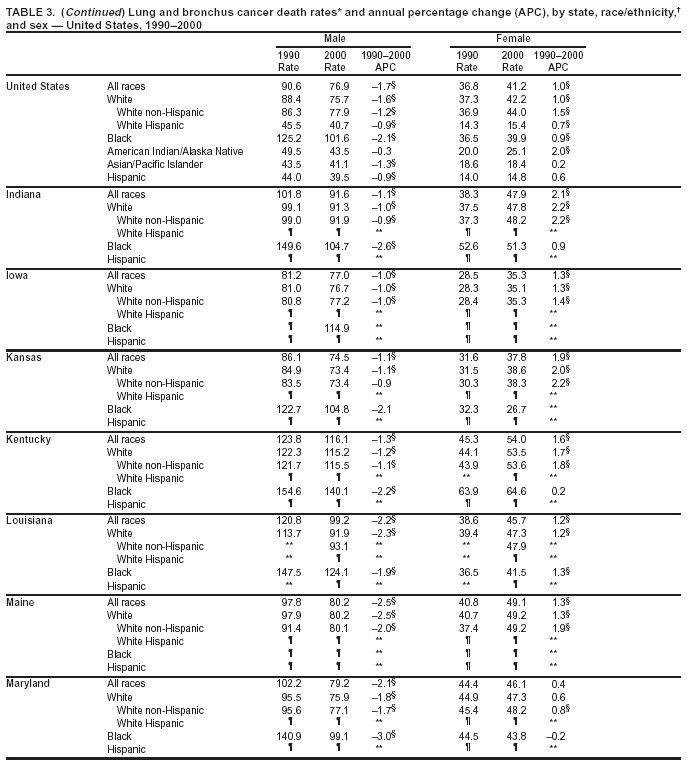 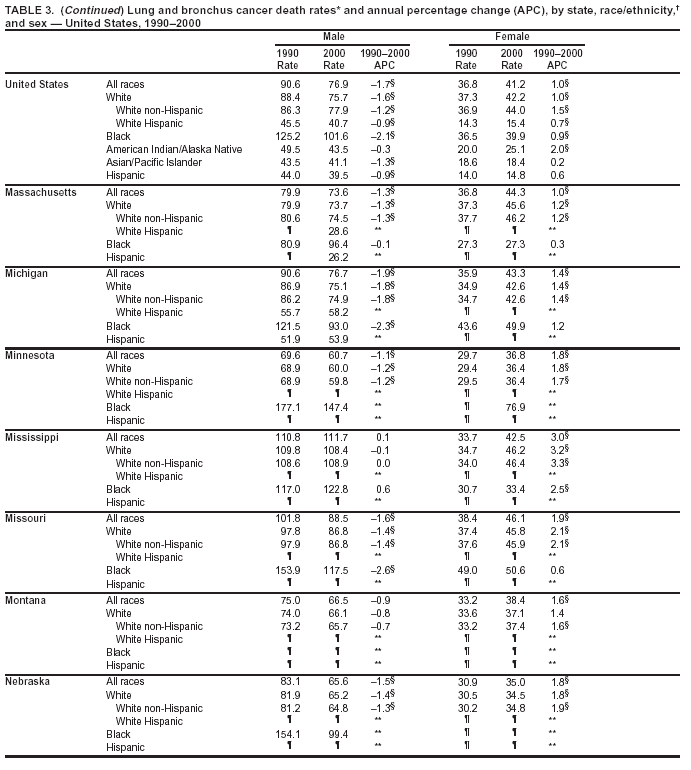 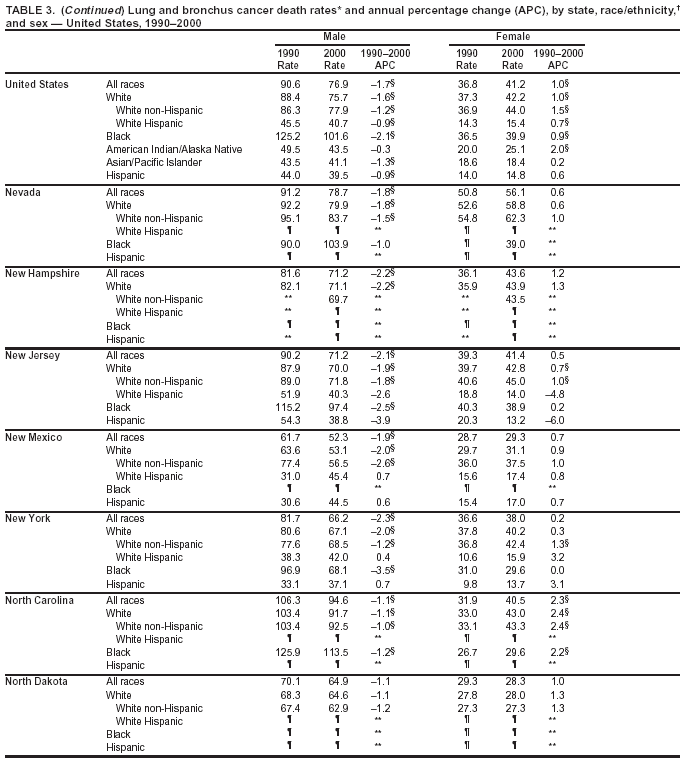 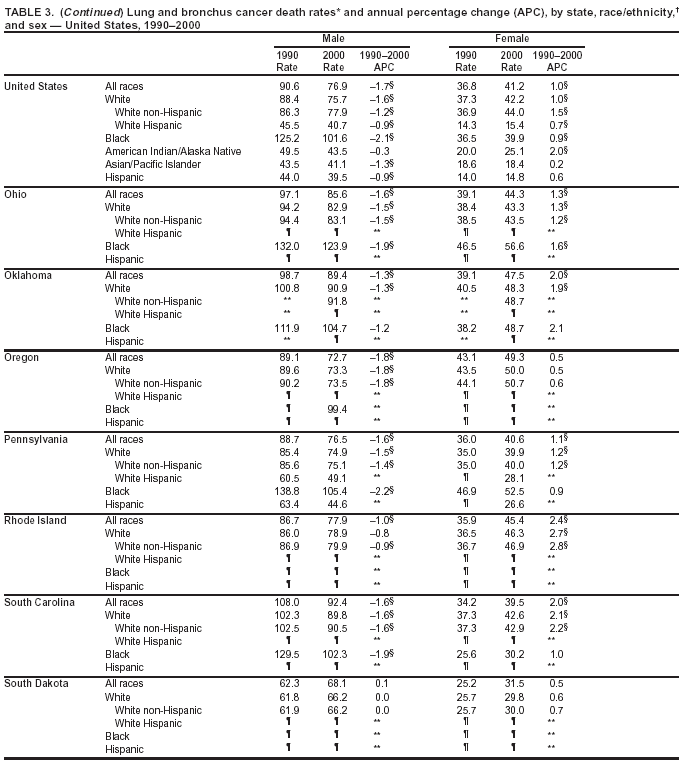
Return to top. Figure 3 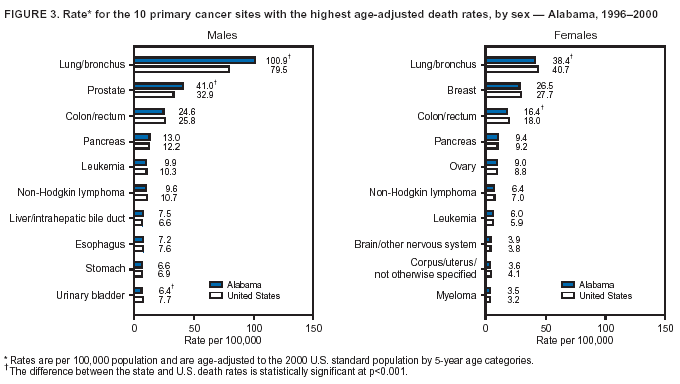 Return to top. Table 4 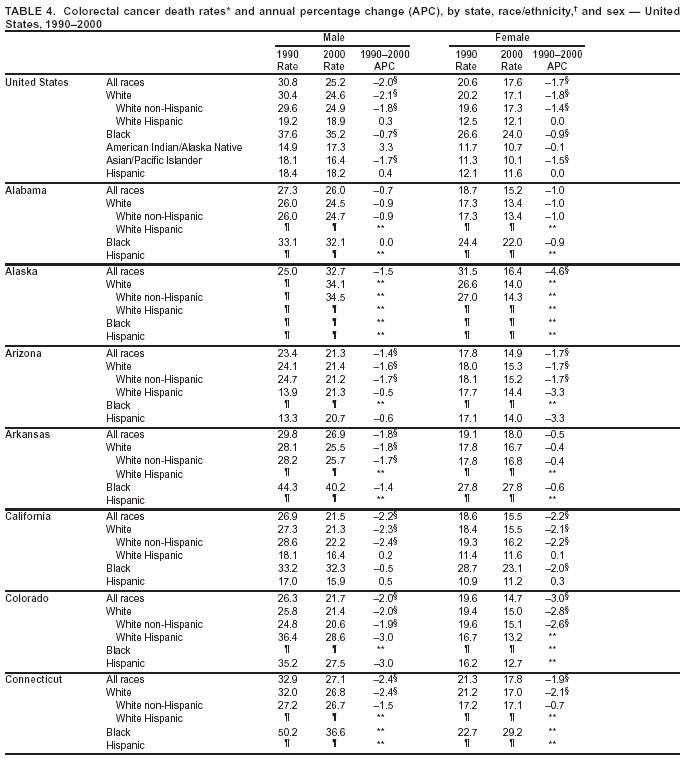
Return to top. Figure 4 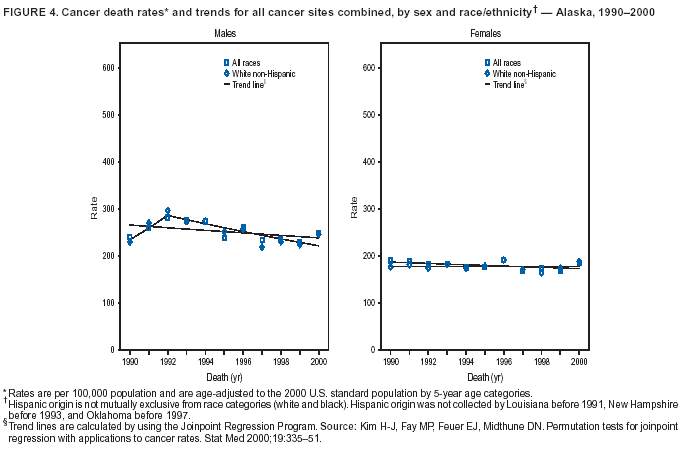 Return to top. Table 5 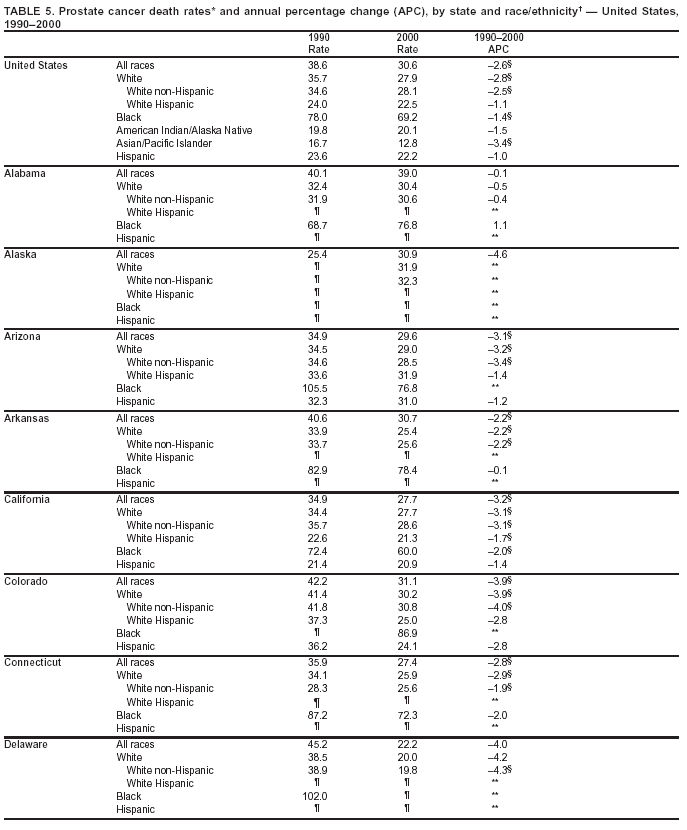 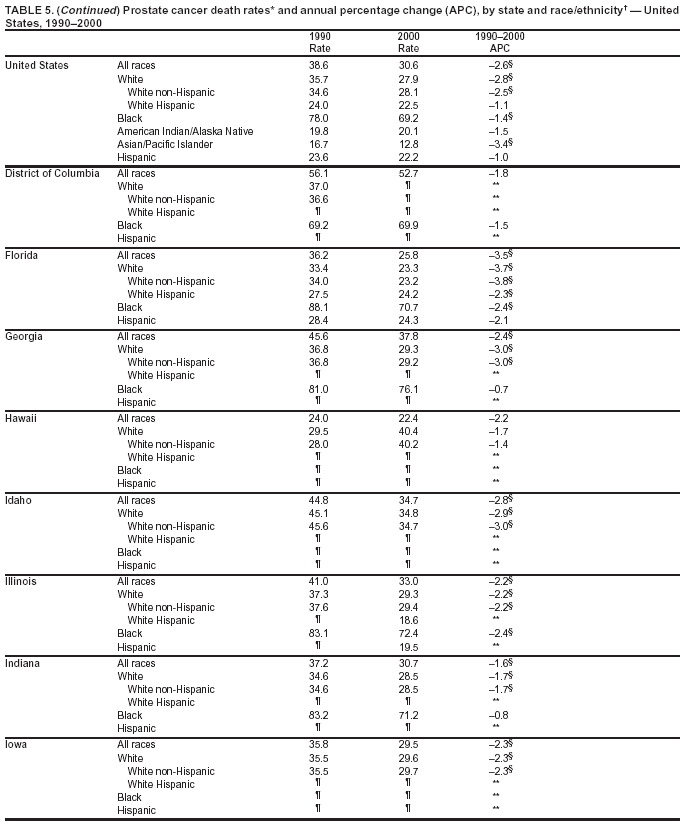 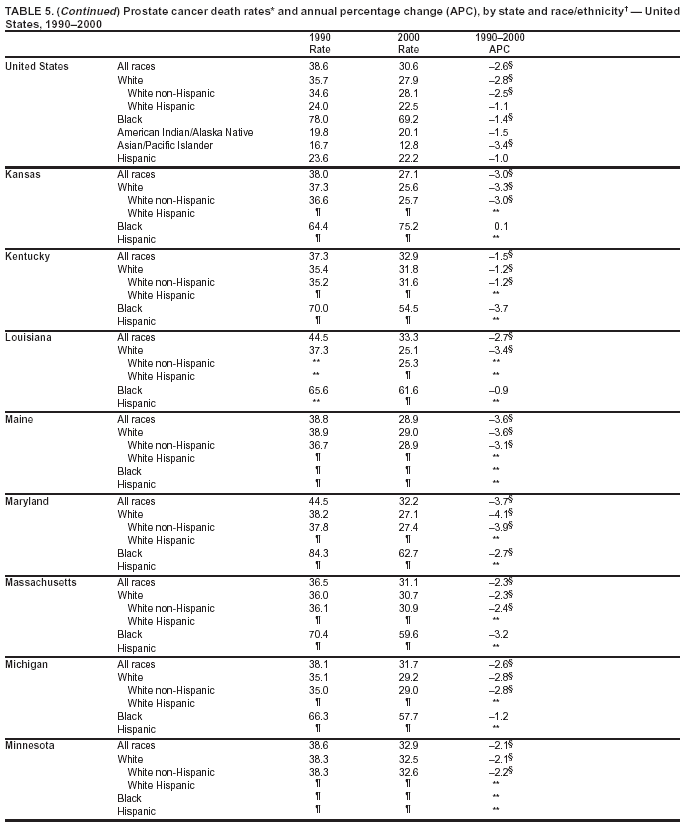 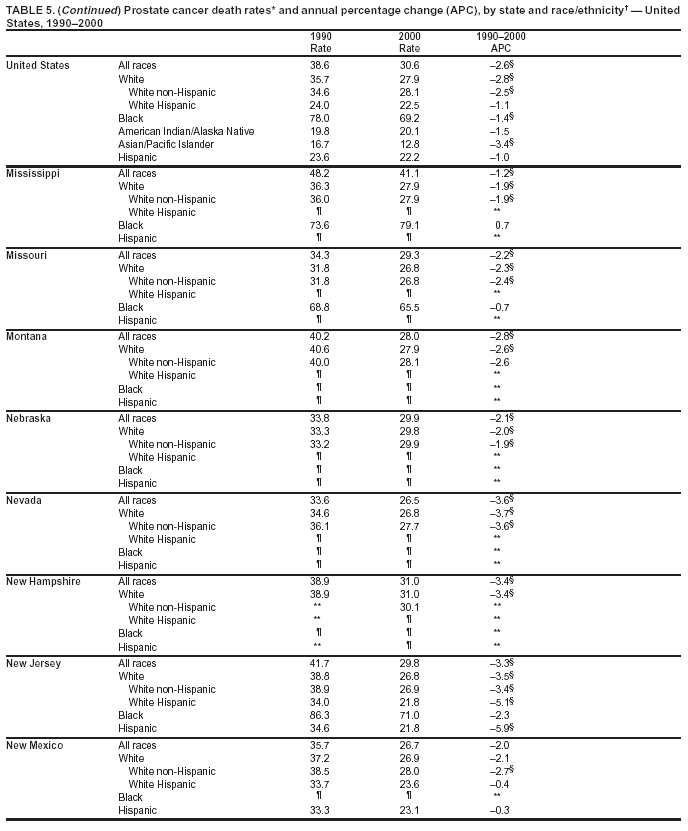 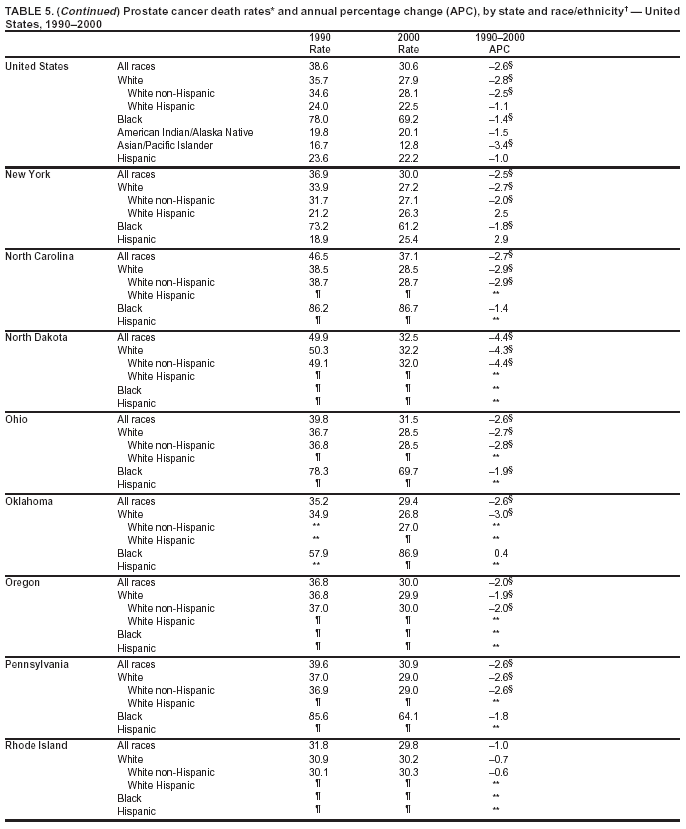 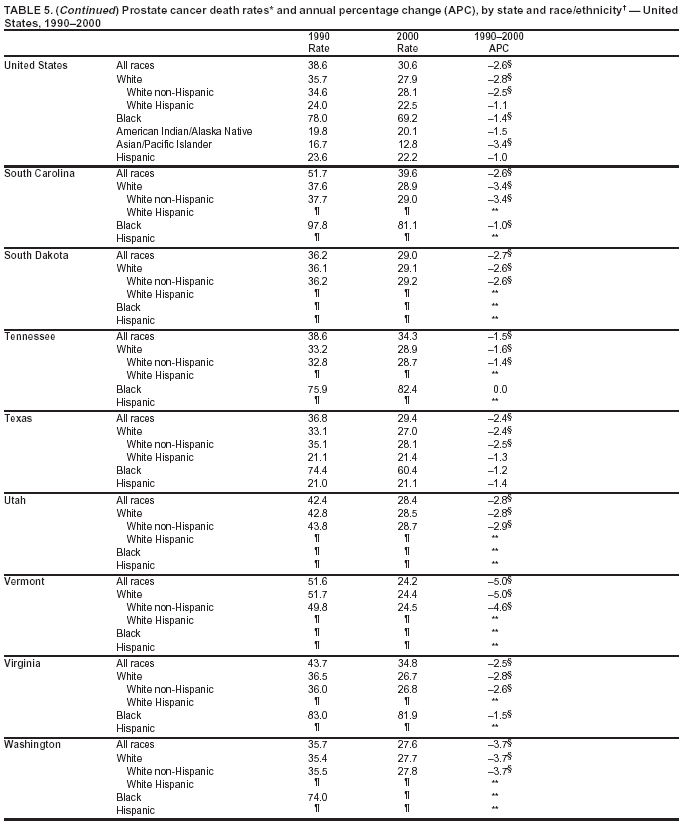 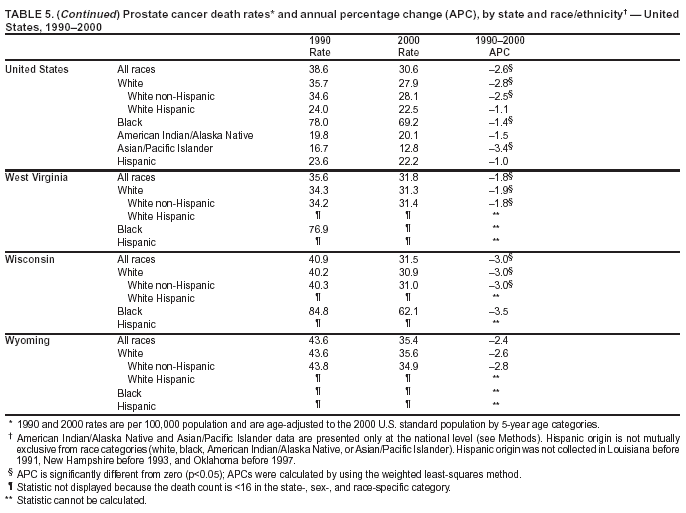 Return to top. Figure 5  Return to top. Table 6 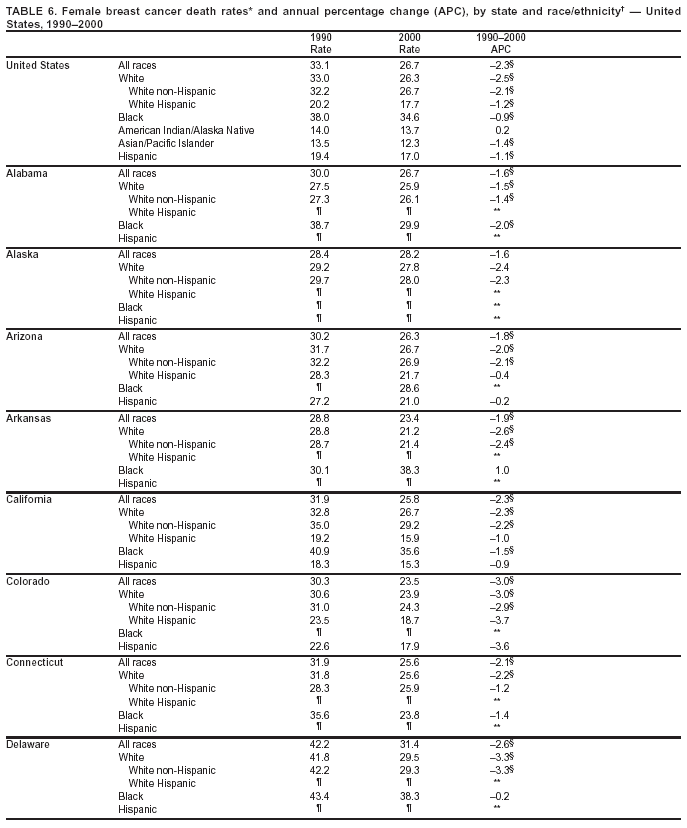 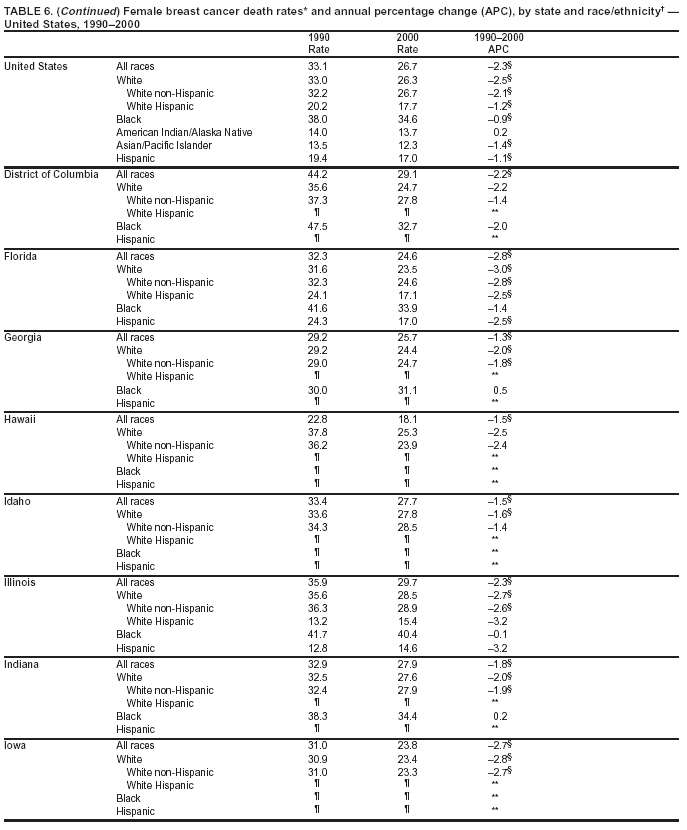 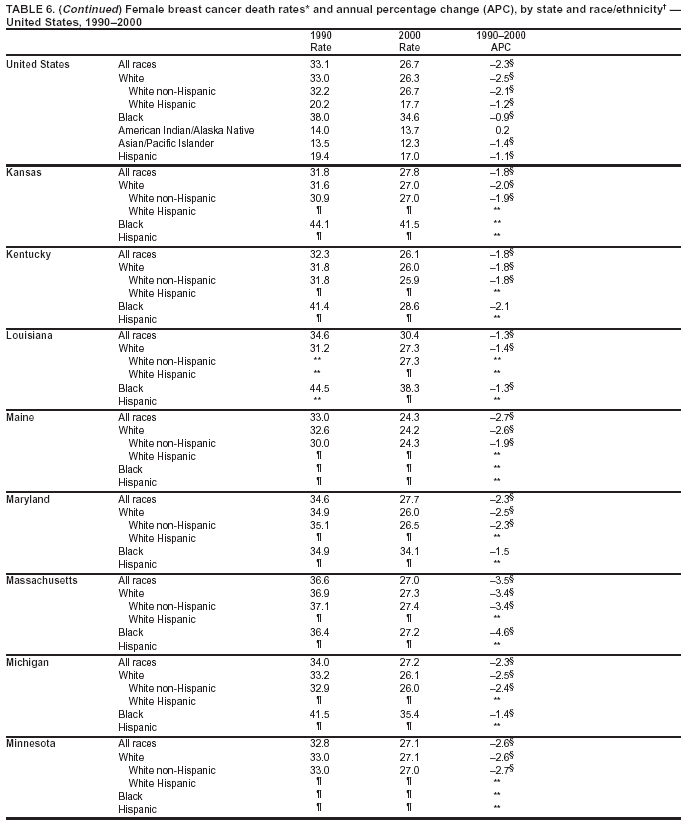 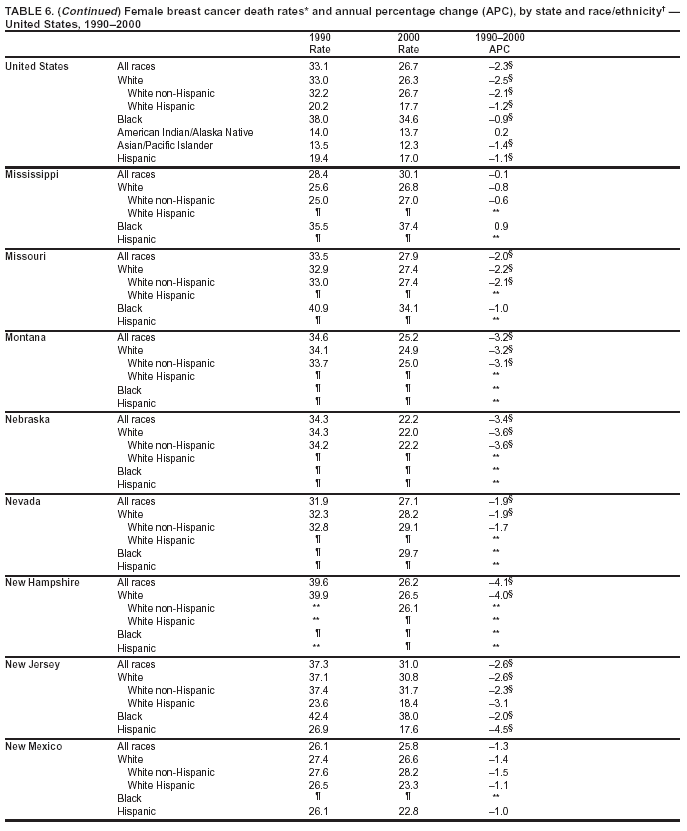 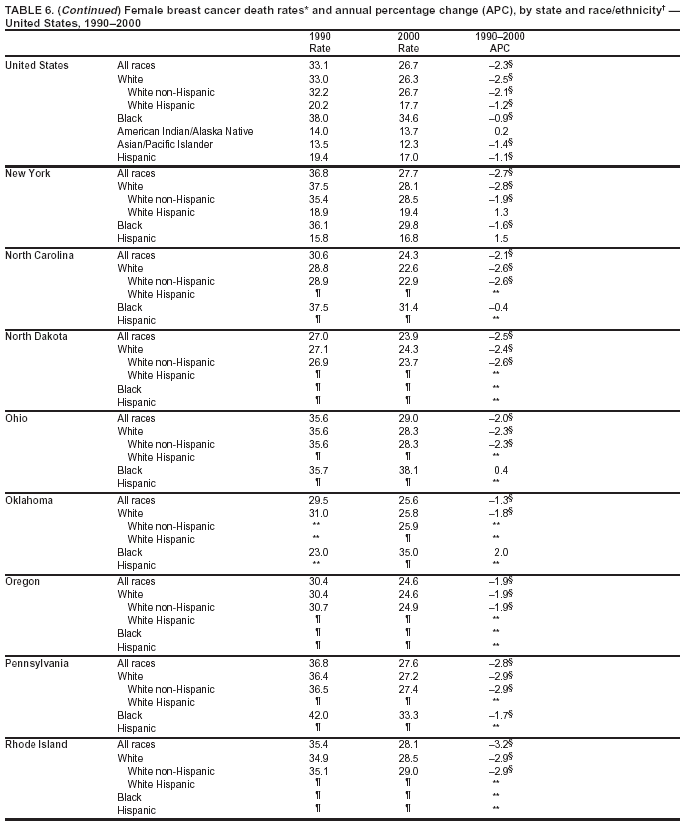 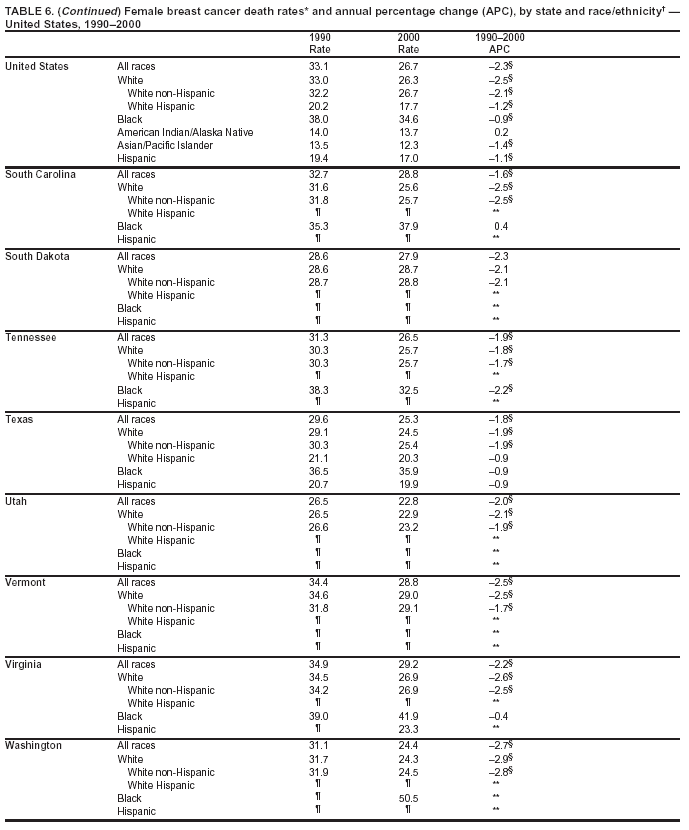 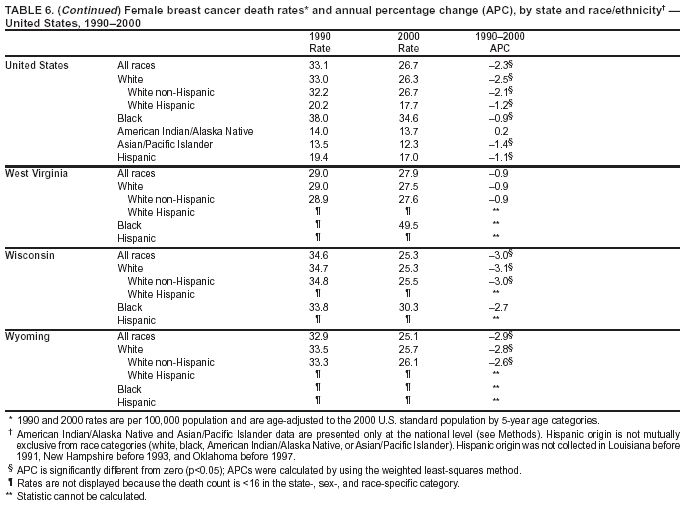 Return to top. Figure 6 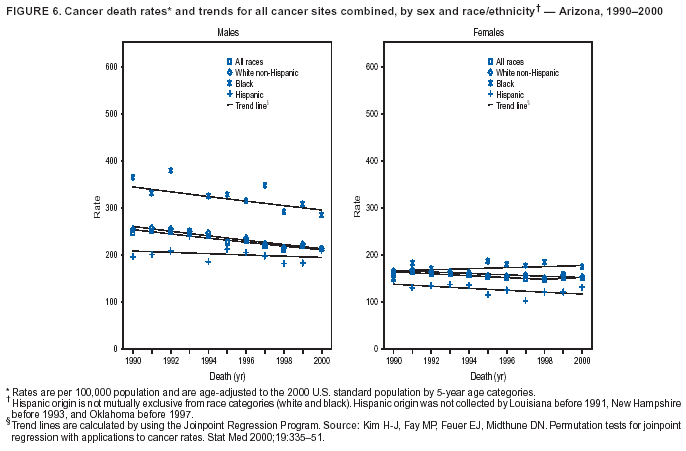 Return to top. Table 7 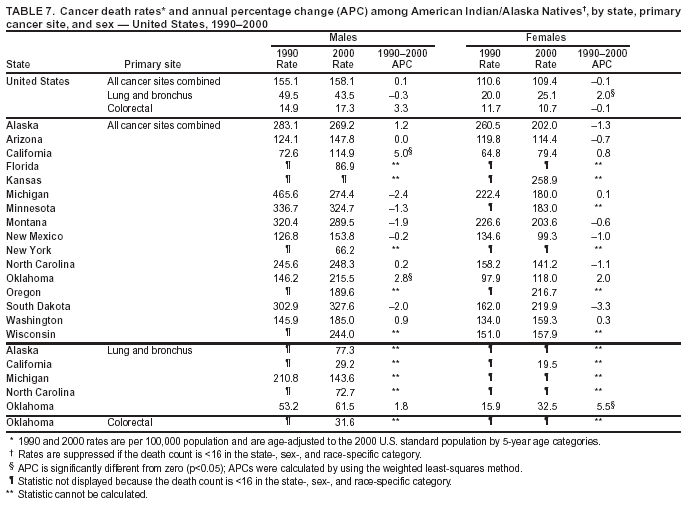 Return to top. Figure 7 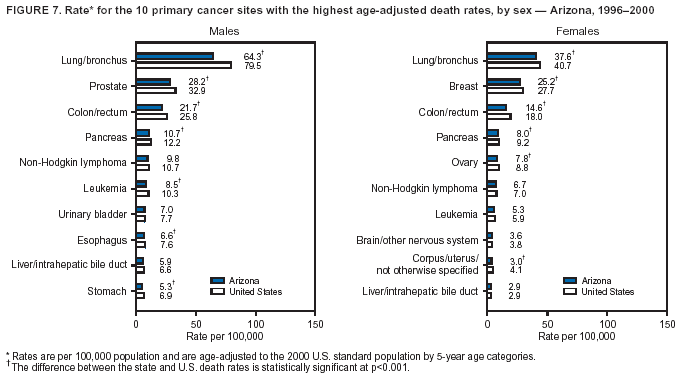 Return to top. Table 8 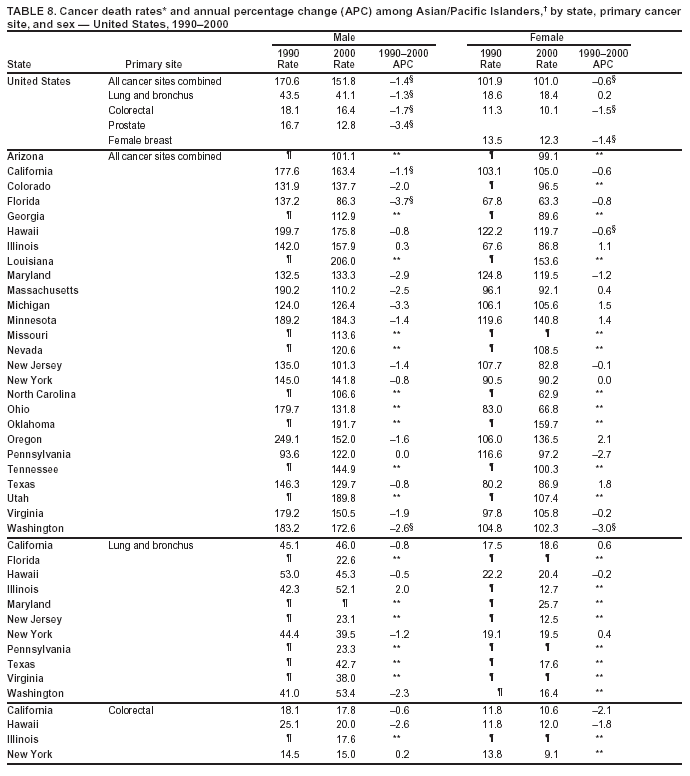 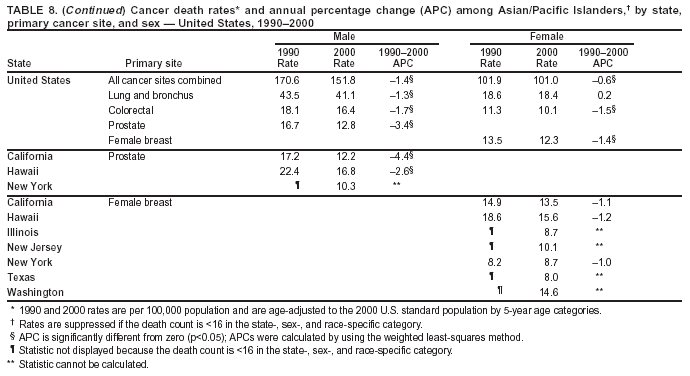 Return to top. Figure 8  Return to top. Figure 9  Return to top. Figure 10 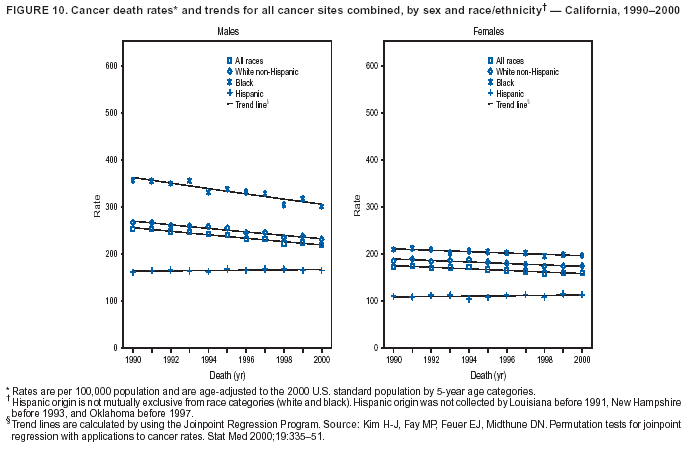 Return to top. Figure 11 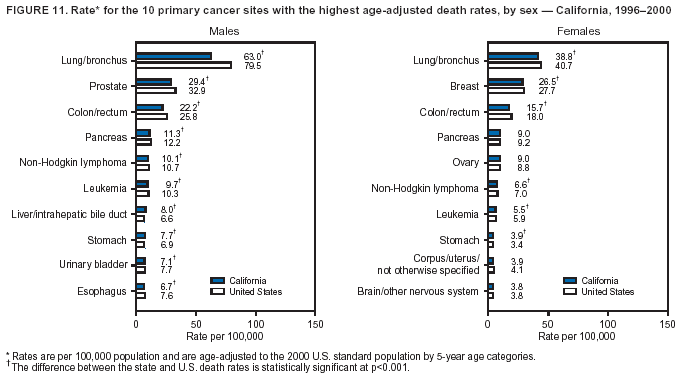 Return to top. Figure 12 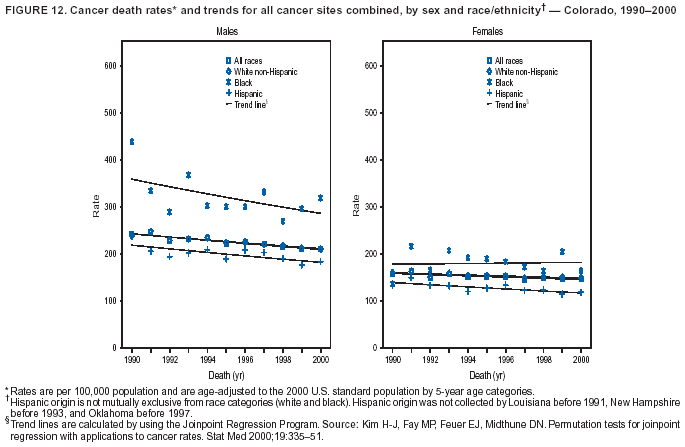 Return to top. Figure 13 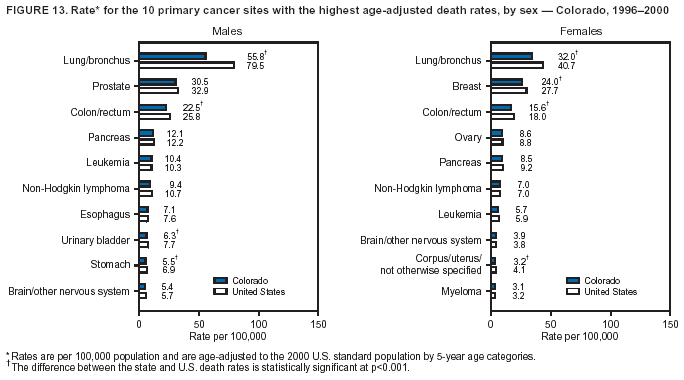 Return to top. Figure 14 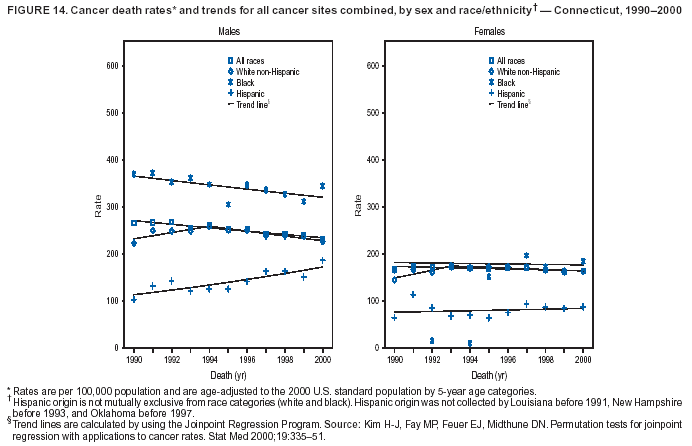 Return to top. Figure 15 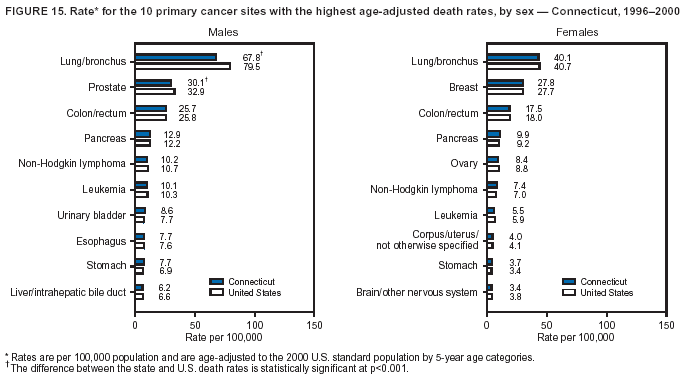 Return to top. Figure 16 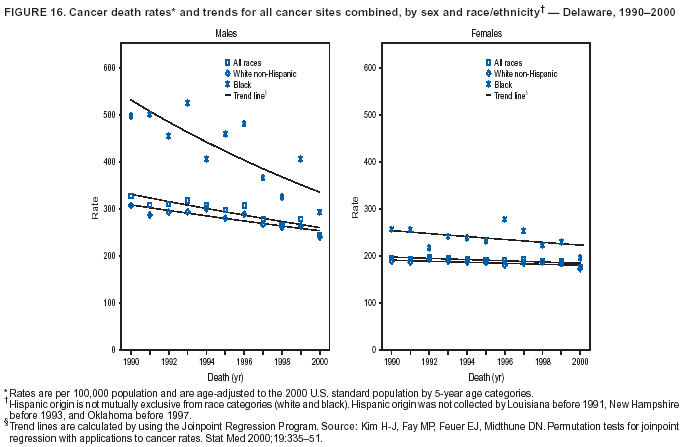 Return to top. Figure 17 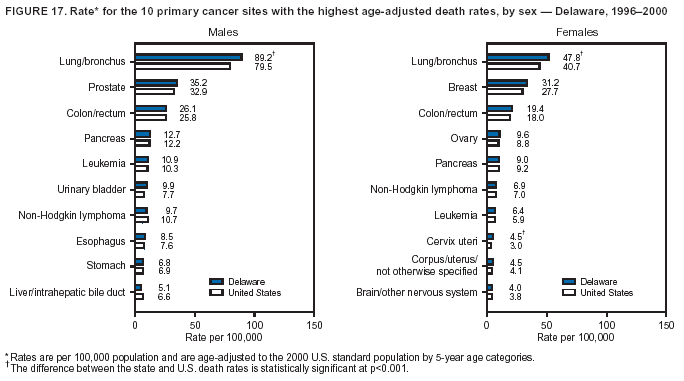 Return to top. Figure 18 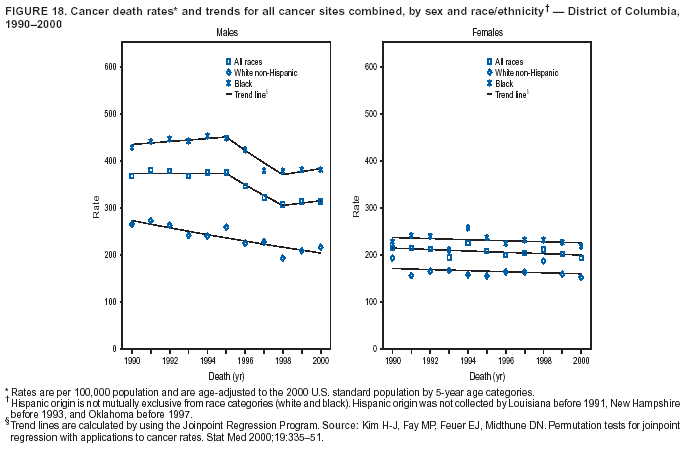 Return to top. Figure 19 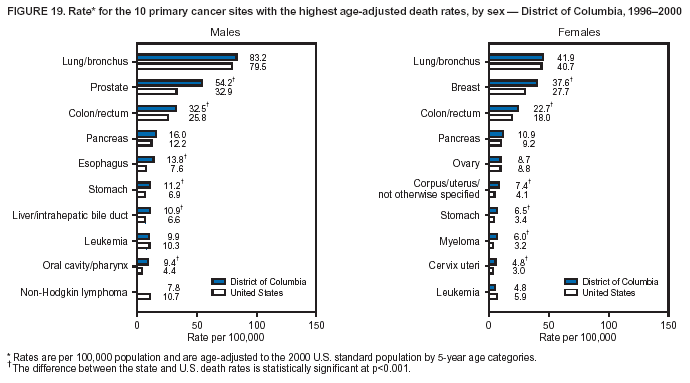 Return to top. Figure 20 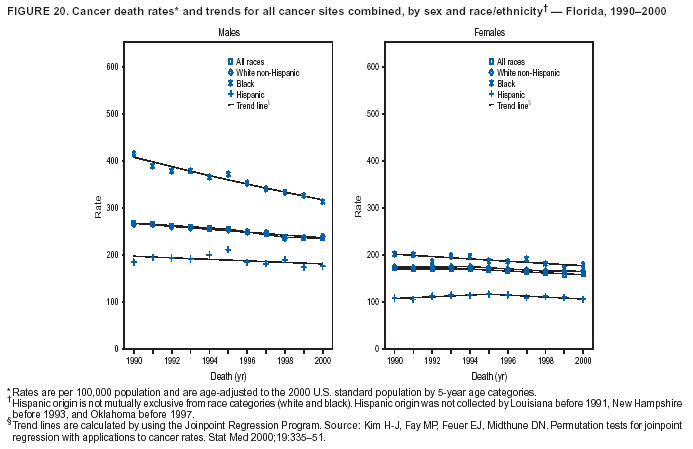 Return to top. Figure 21 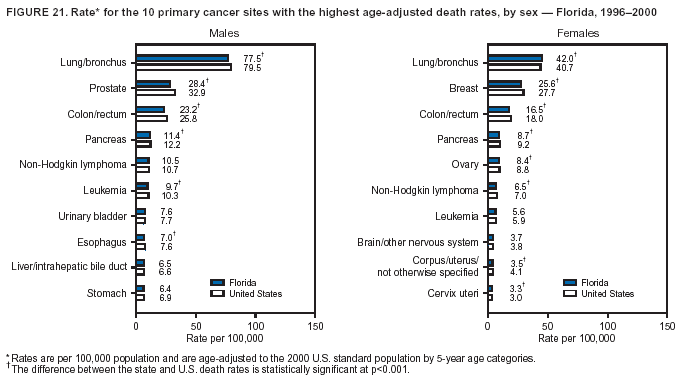 Return to top. Figure 22 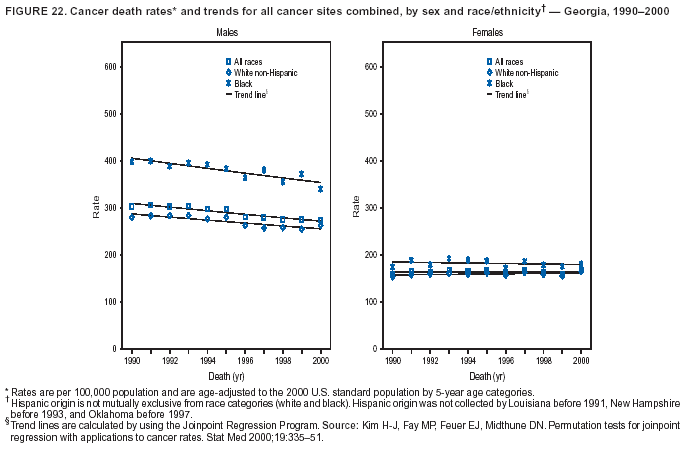 Return to top. Figure 23 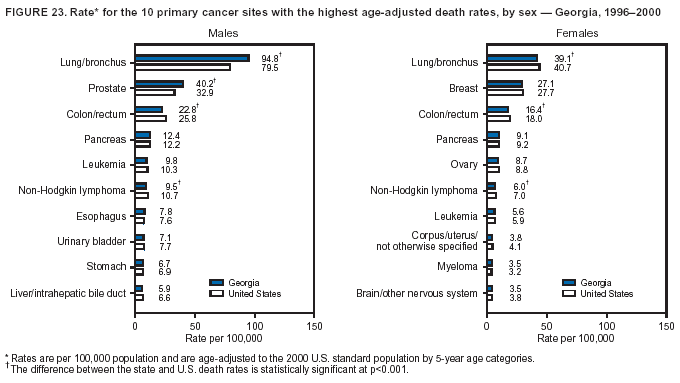 Return to top. Figure 24 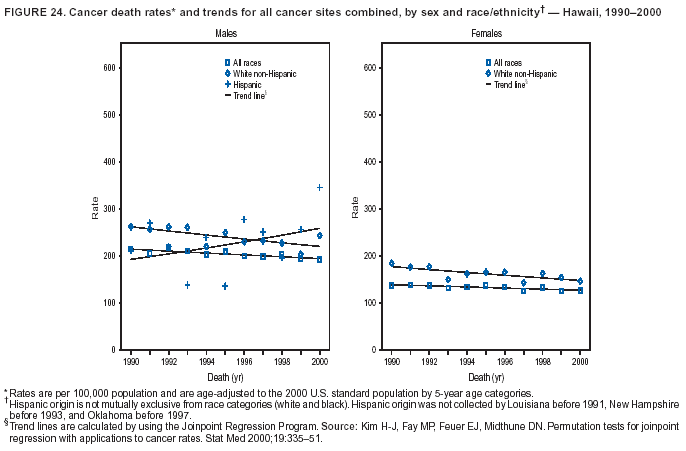 Return to top. Figure 25 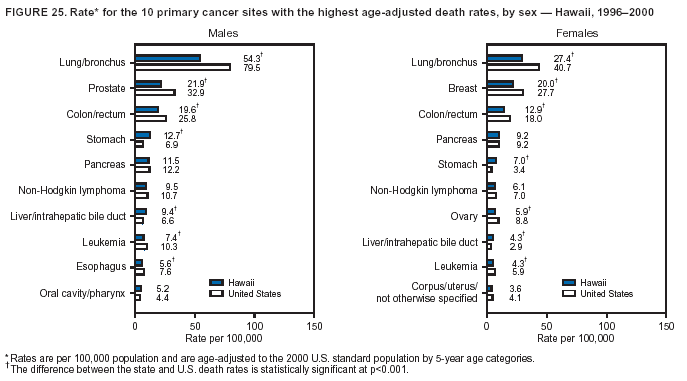 Return to top. Figure 26  Return to top. Figure 27  Return to top. Figure 28  Return to top. Figure 29 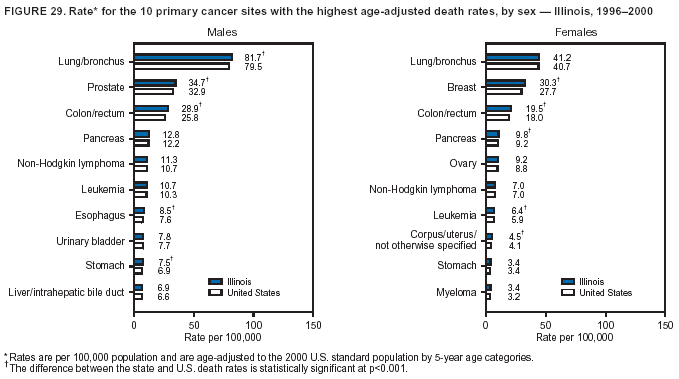 Return to top. Figure 30 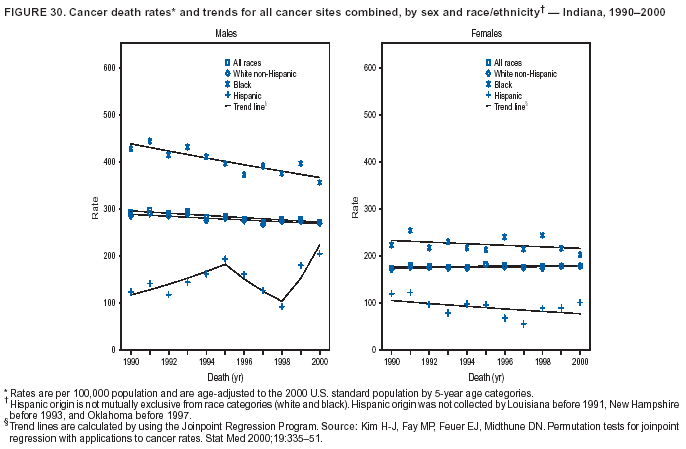 Return to top. Figure 31 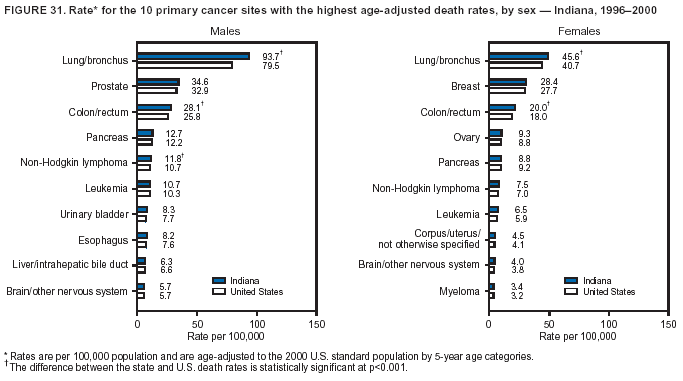 Return to top. Figure 32 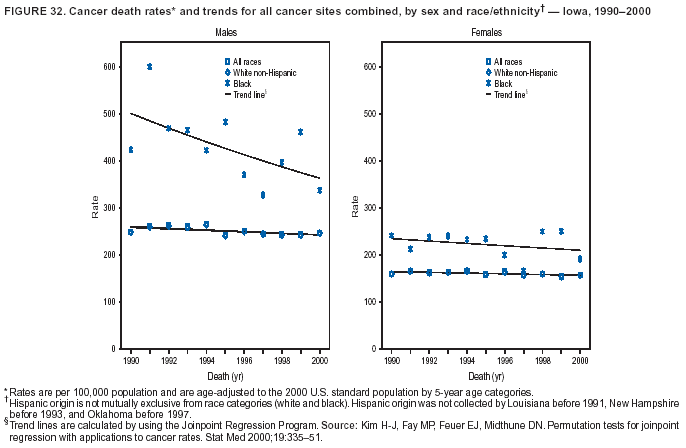 Return to top. Figure 33 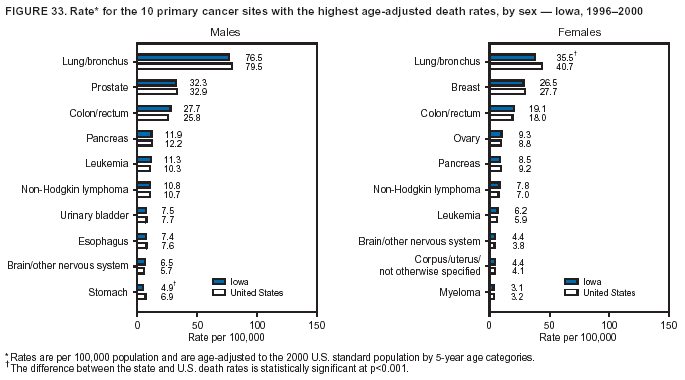 Return to top. Figure 34 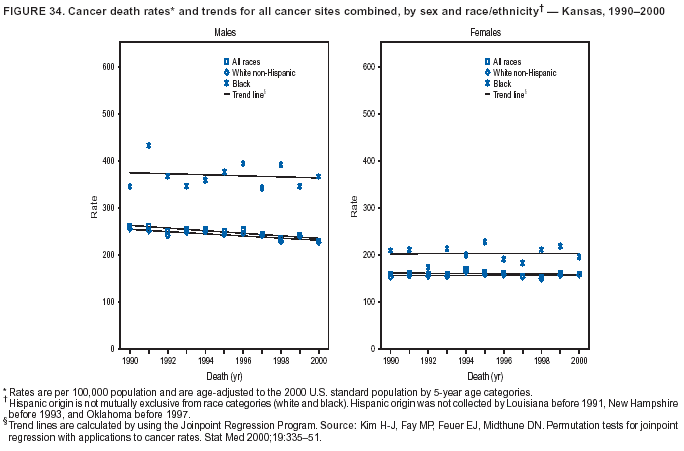 Return to top. Figure 35 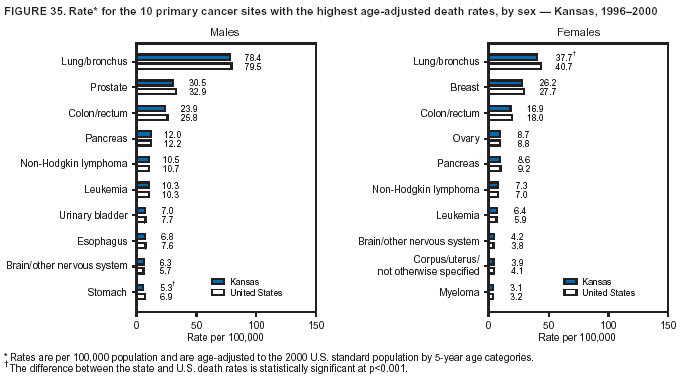 Return to top. Figure 36 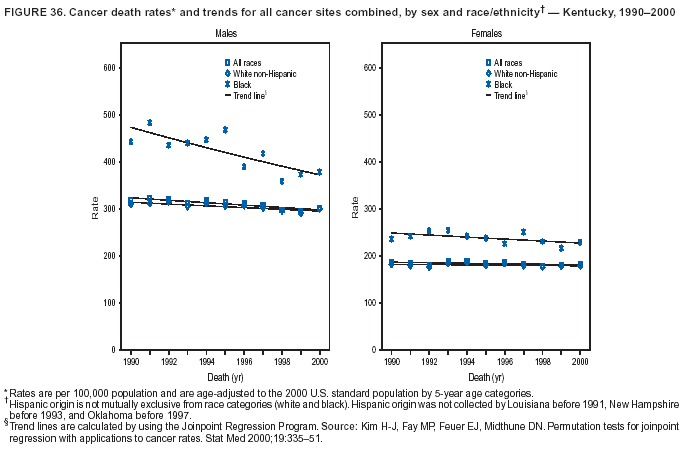 Return to top. Figure 37  Return to top. Figure 38 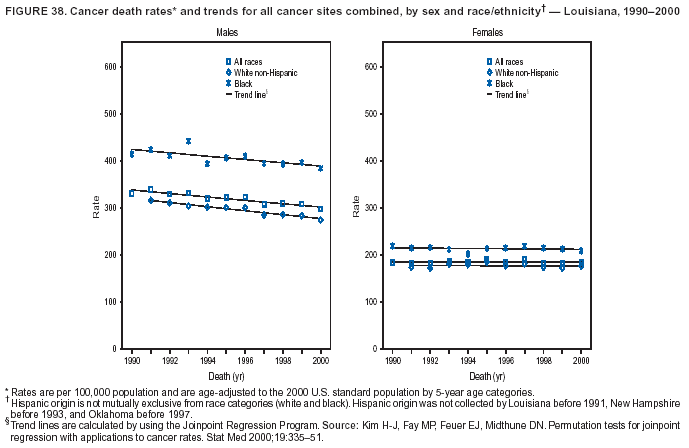 Return to top. Figure 39  Return to top. Figure 40 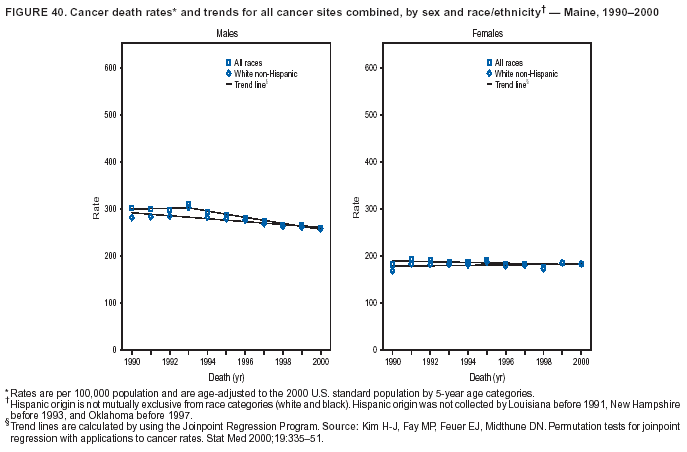 Return to top. Figure 41 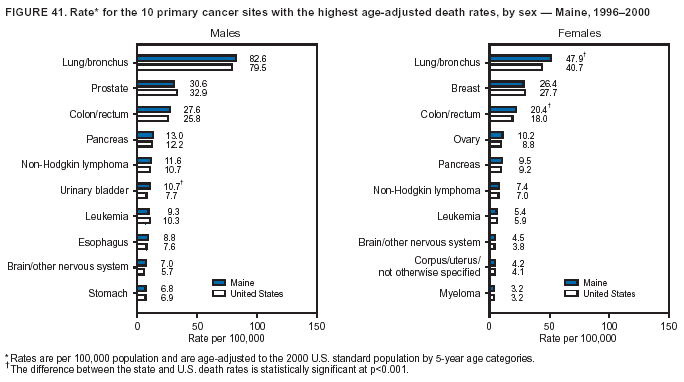 Return to top. Figure 42 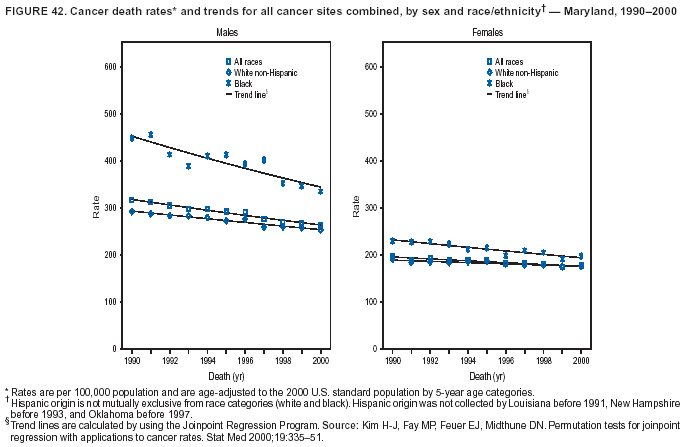 Return to top. Figure 43 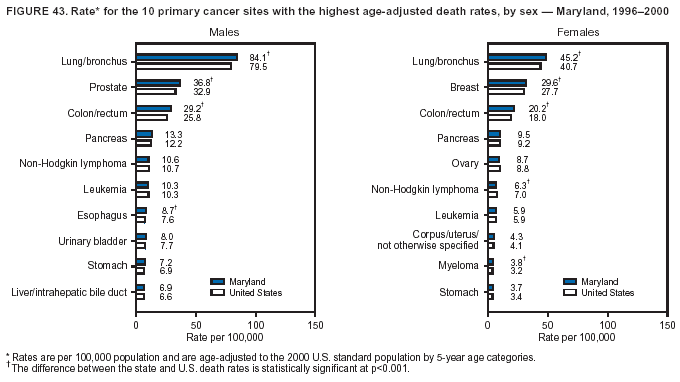 Return to top. Figure 44 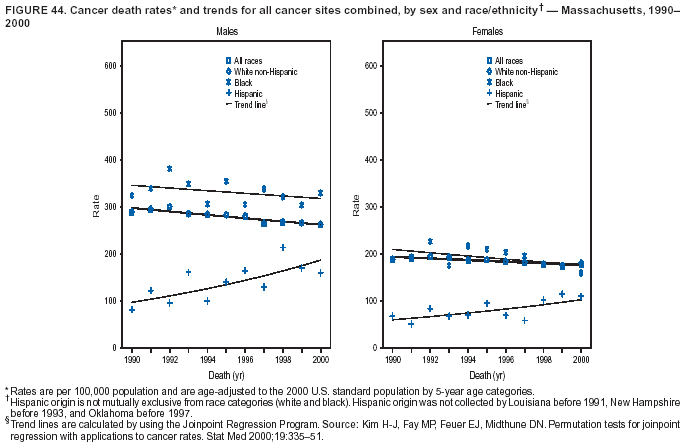 Return to top. Figure 45 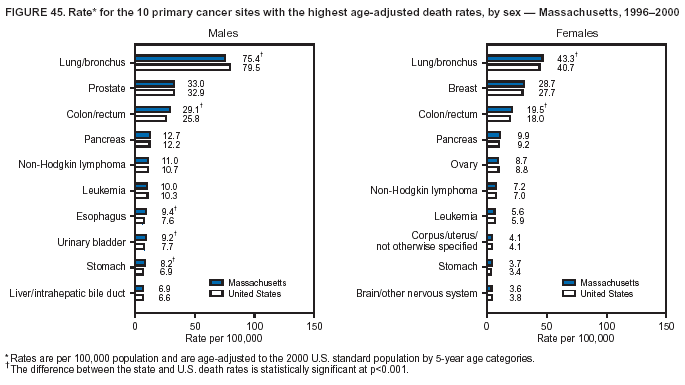 Return to top. Figure 46 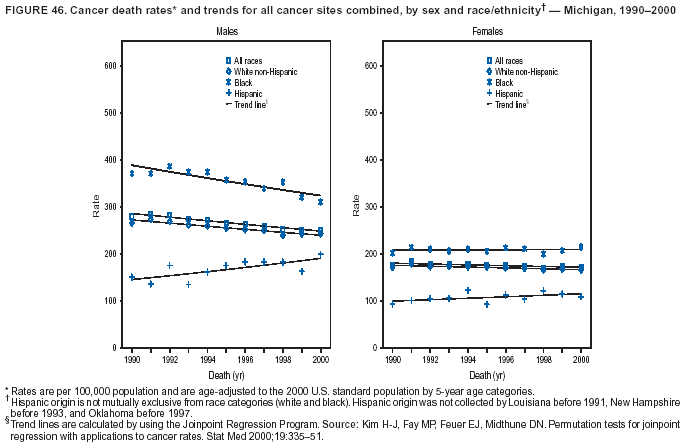 Return to top. Figure 47 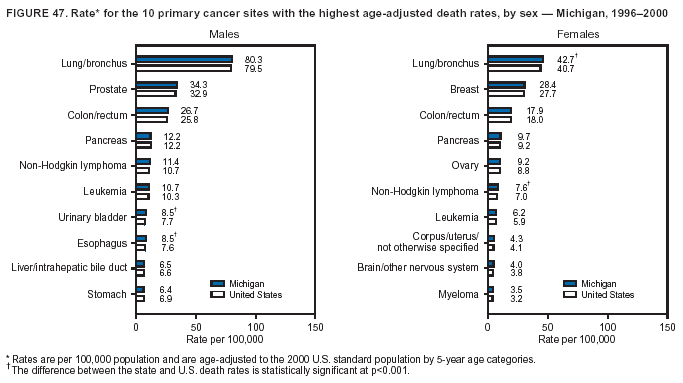 Return to top. Figure 48 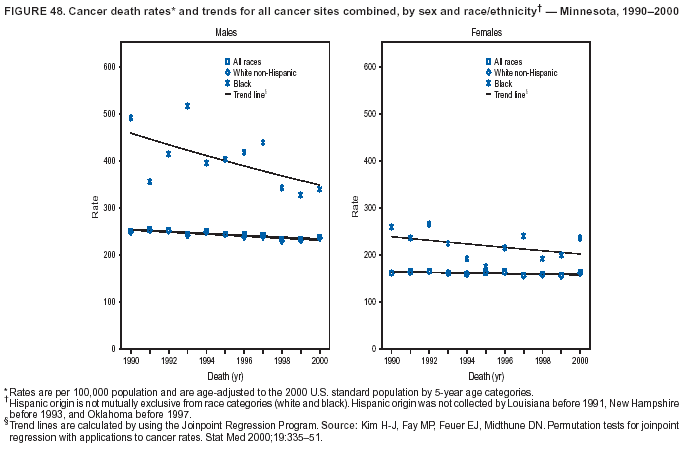 Return to top. Figure 49 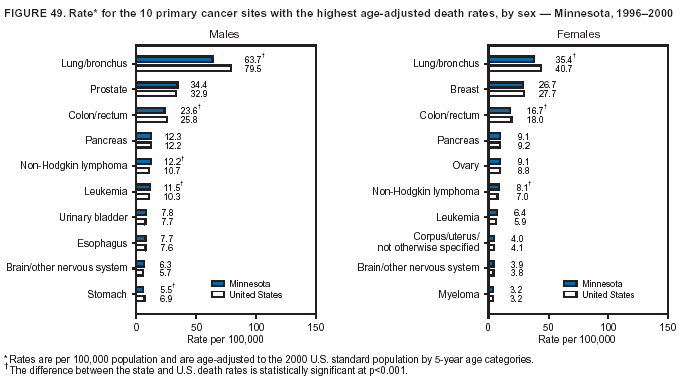 Return to top. Figure 50 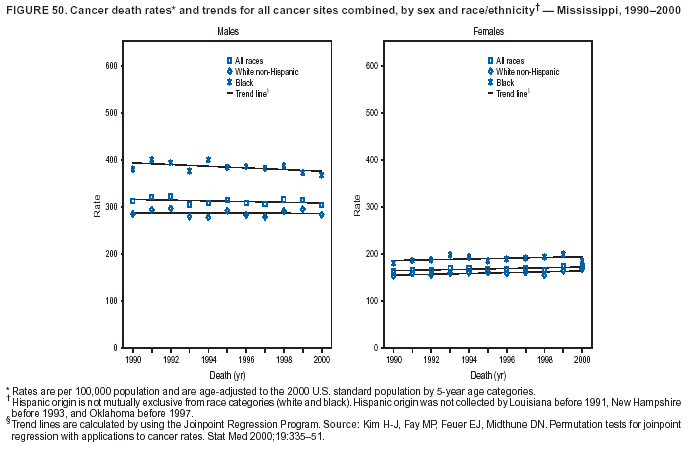 Return to top. Figure 51 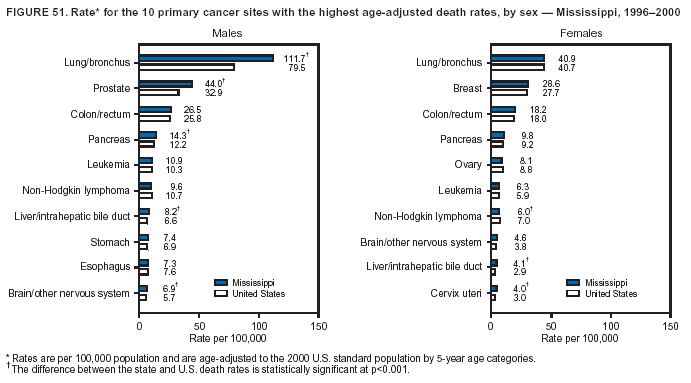 Return to top. Figure 52 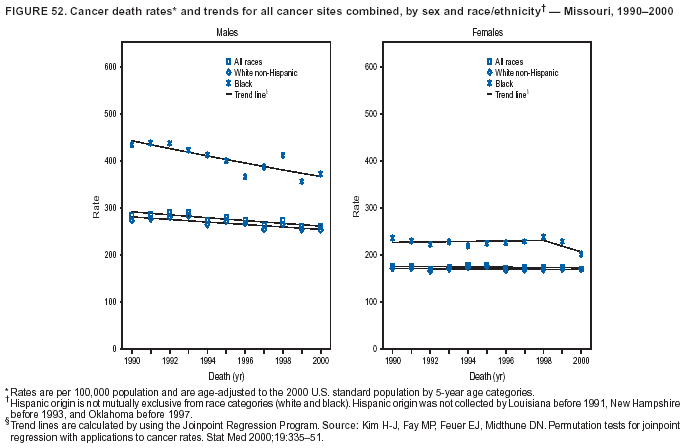 Return to top. Figure 53 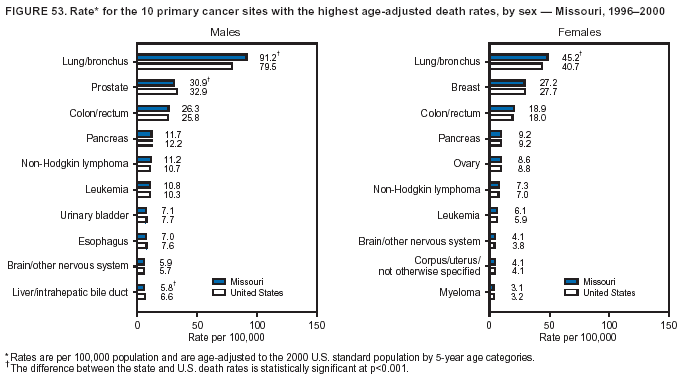 Return to top. Figure 54 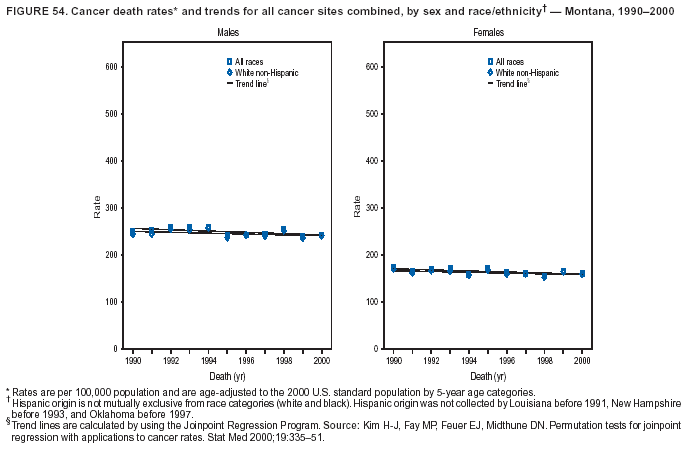 Return to top. Figure 55 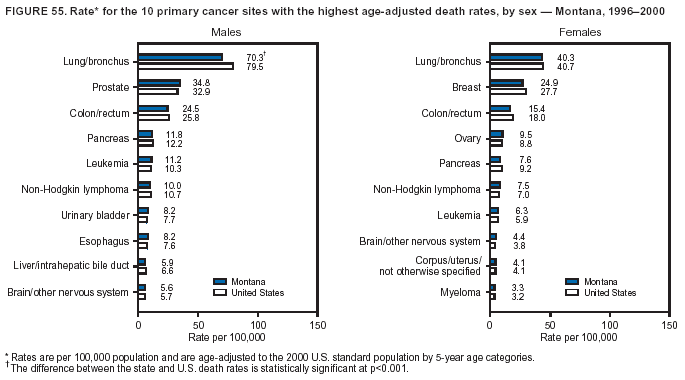 Return to top. Figure 56 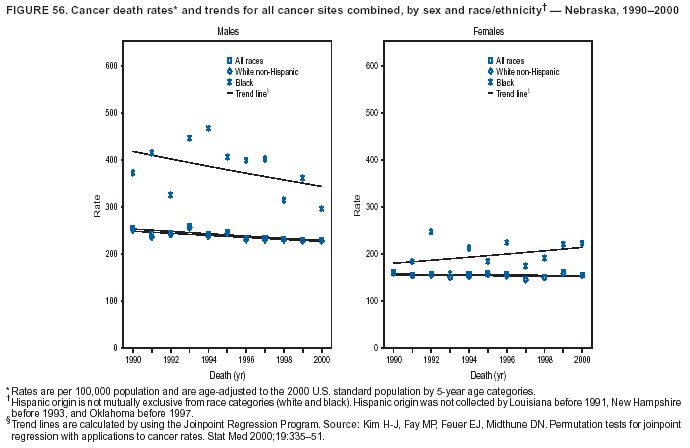 Return to top. Figure 57 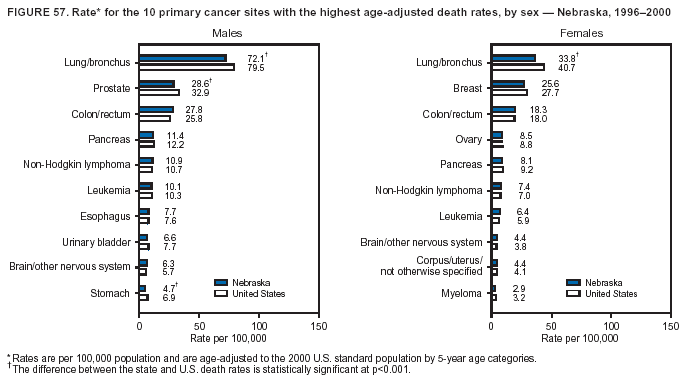 Return to top. Figure 58 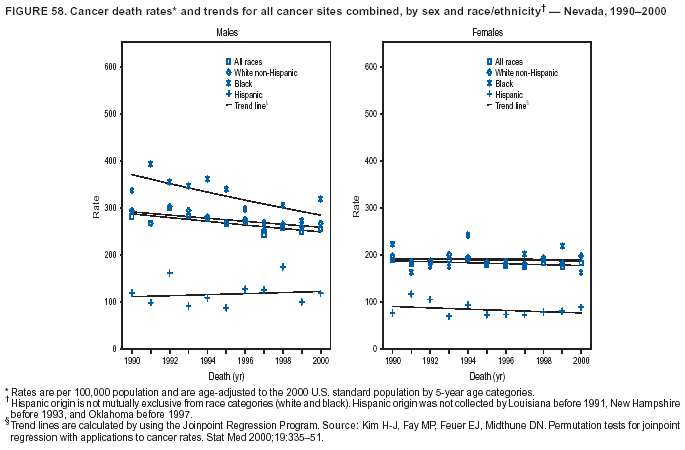 Return to top. Figure 59  Return to top. Figure 60 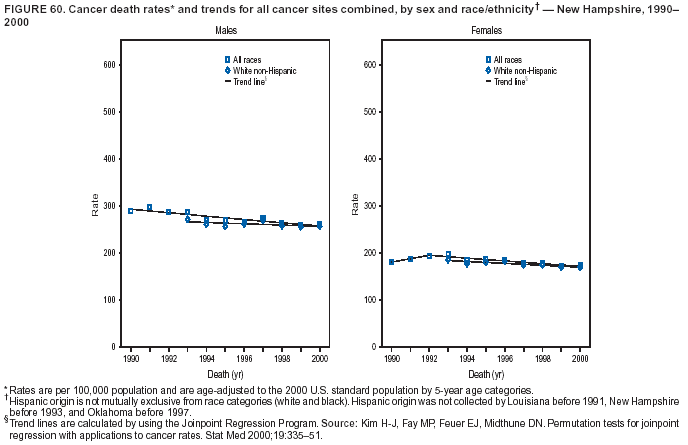 Return to top. Figure 61 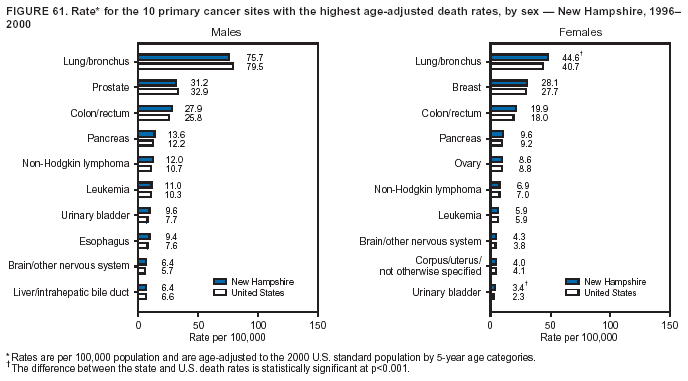 Return to top. Figure 62 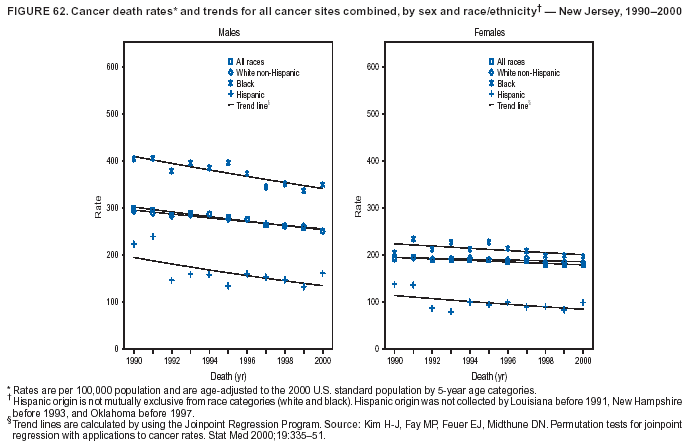 Return to top. Figure 63 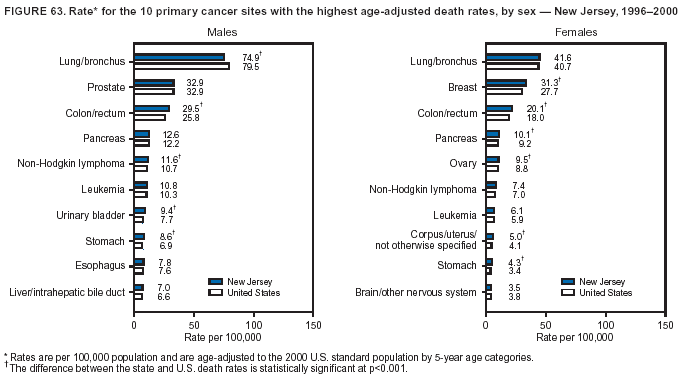 Return to top. Figure 64 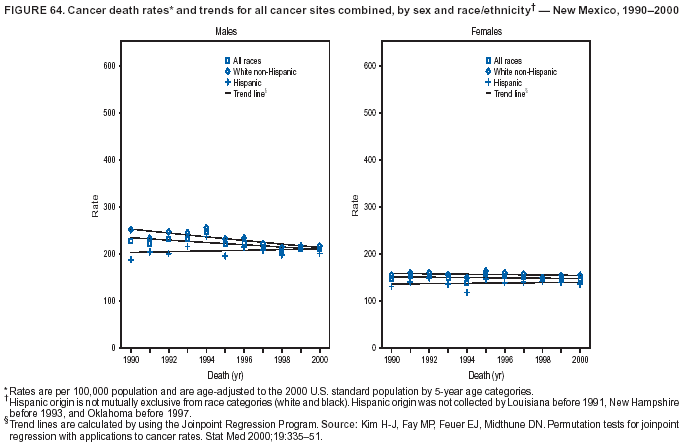 Return to top. Figure 65 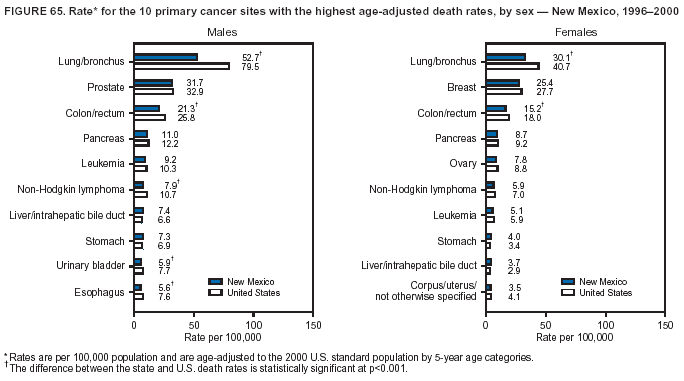 Return to top. Figure 66 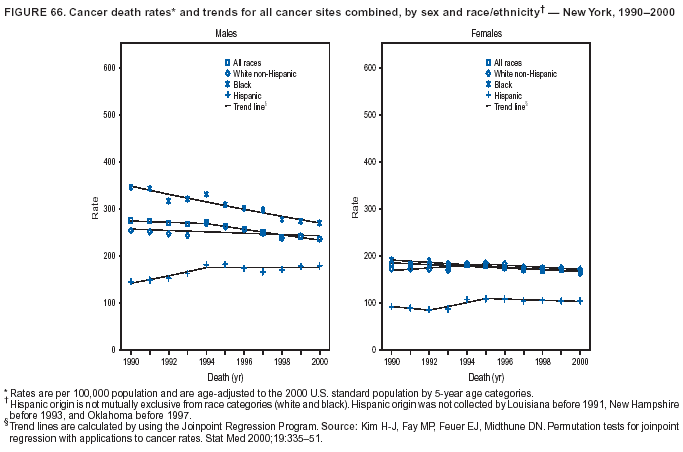 Return to top. Figure 67 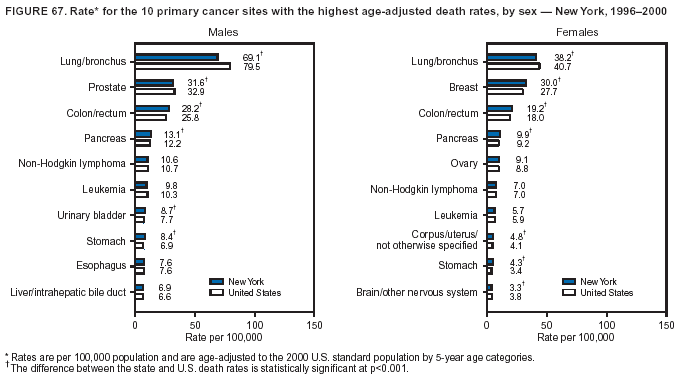 Return to top. Figure 68 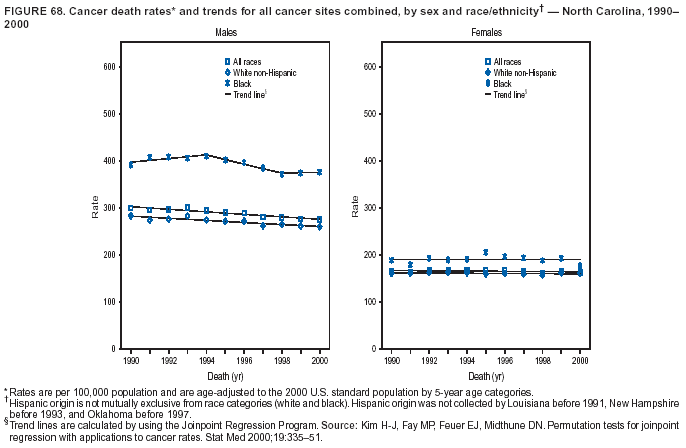 Return to top. Figure 69  Return to top. Figure 70 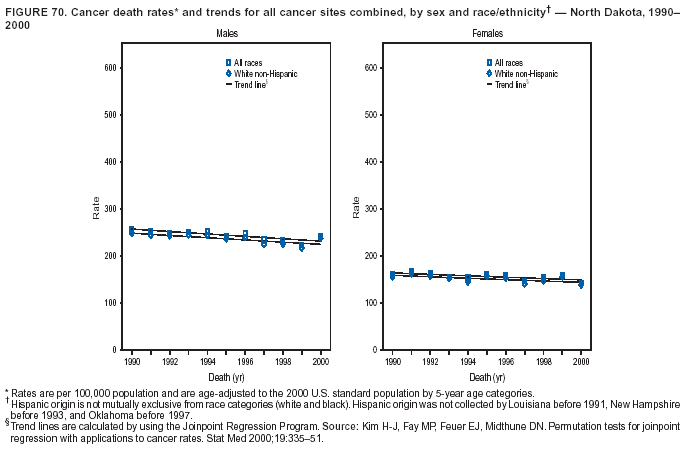 Return to top. Figure 71 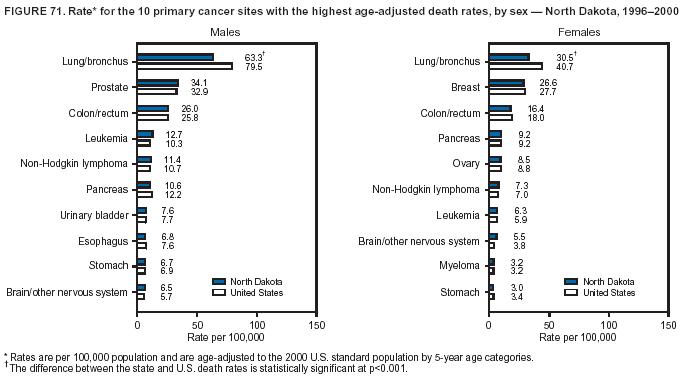 Return to top. Figure 72 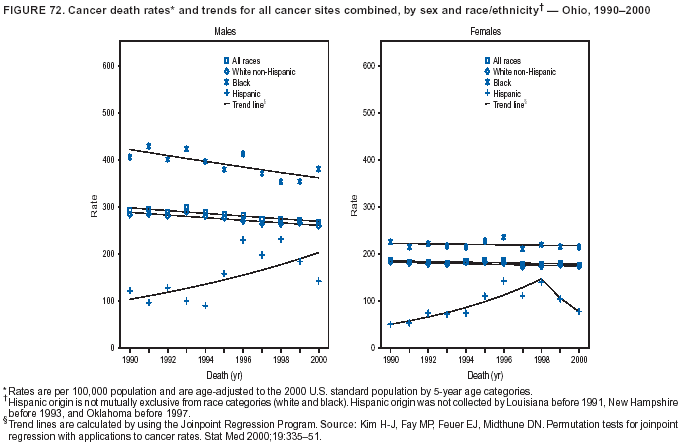 Return to top. Figure 73 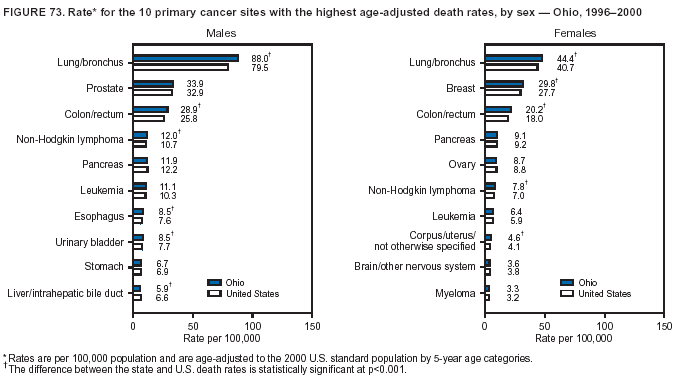 Return to top. Figure 74 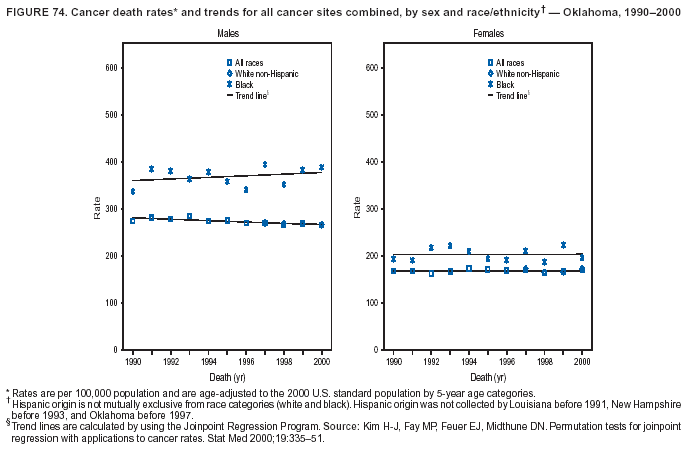 Return to top. Figure 75 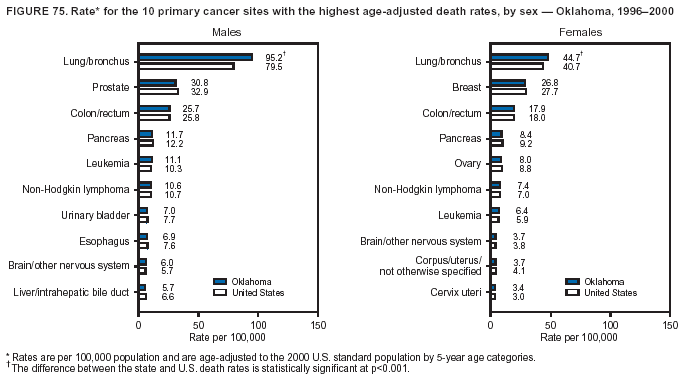 Return to top. Figure 76 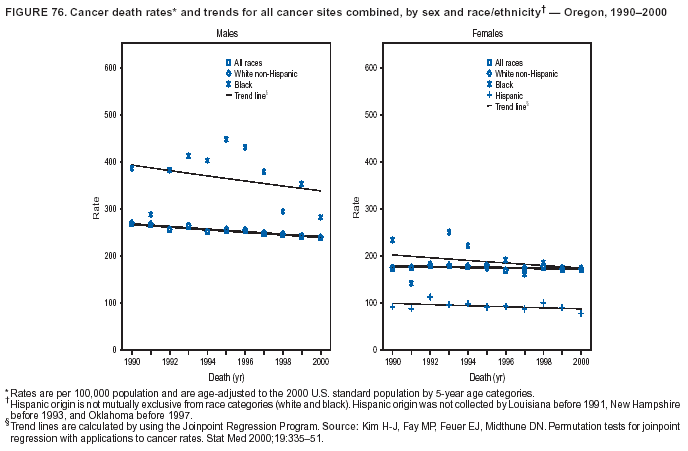 Return to top. Figure 77 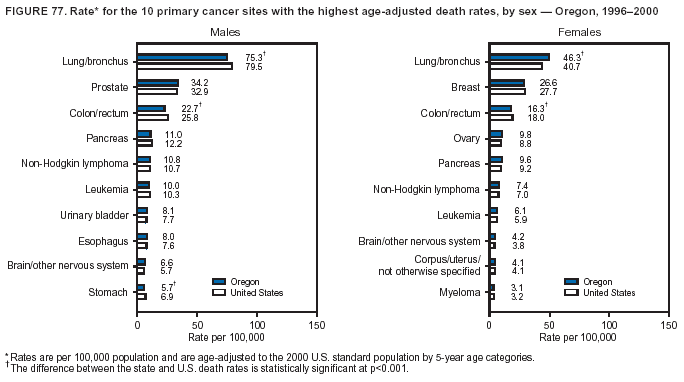 Return to top. Figure 78 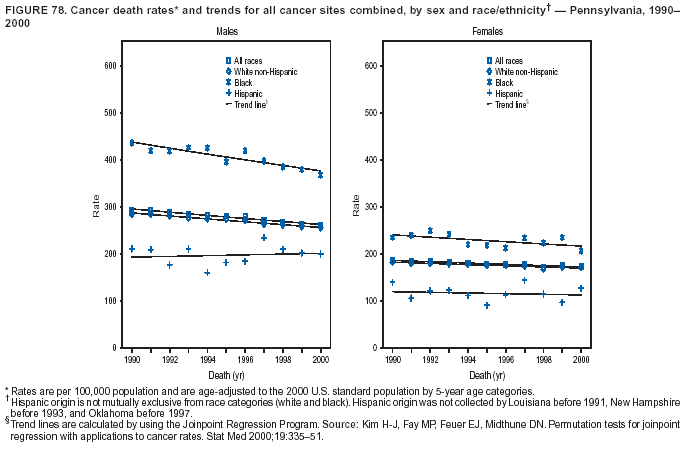 Return to top. Figure 79 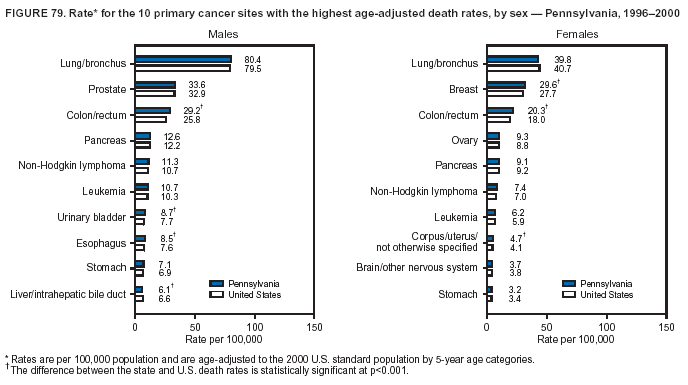 Return to top. Figure 80 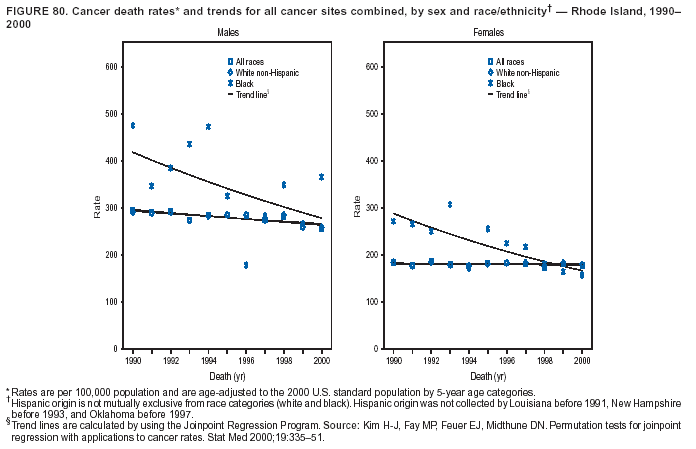 Return to top. Figure 81 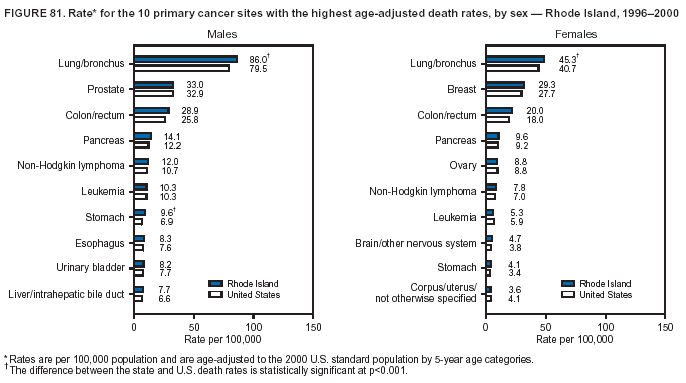 Return to top. Figure 82 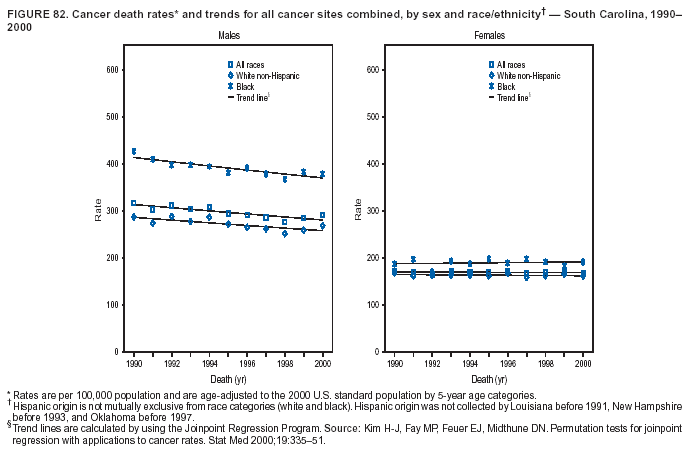 Return to top. Figure 83 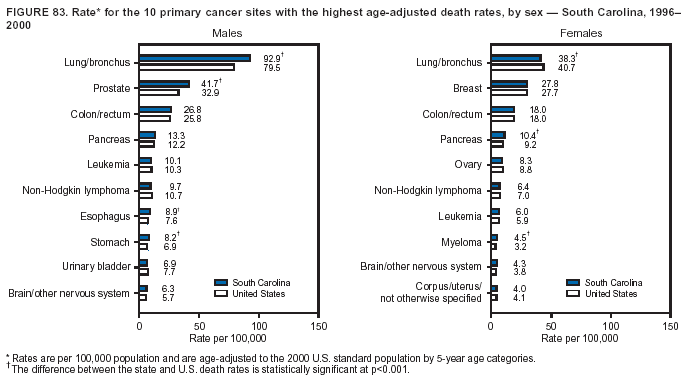 Return to top. Figure 84 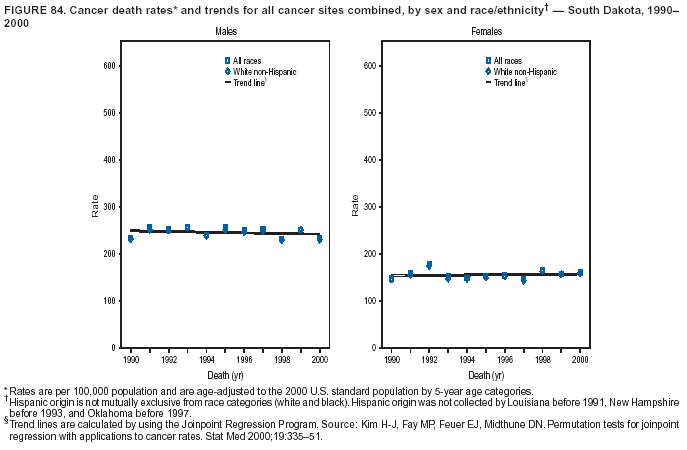 Return to top. Figure 85 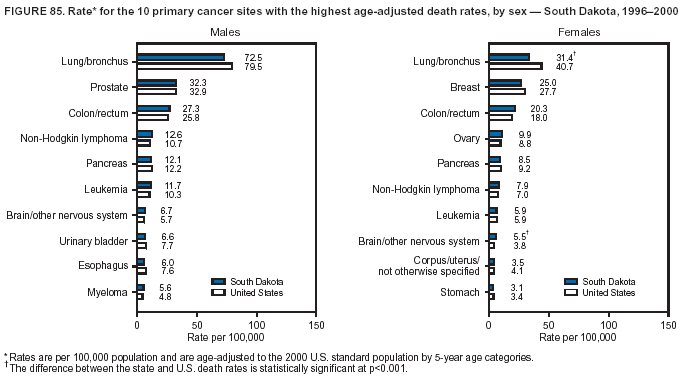 Return to top. Figure 86 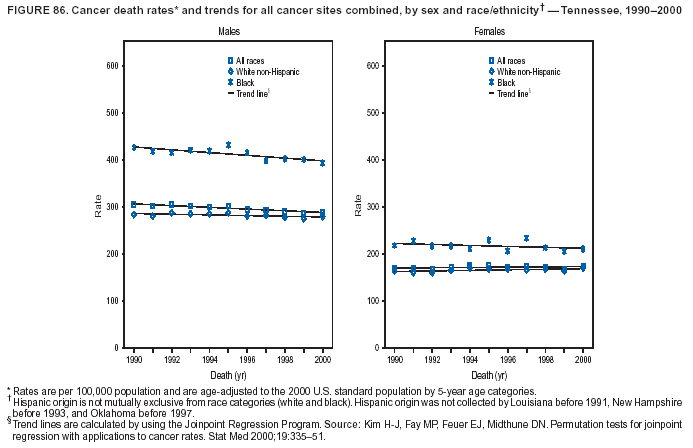 Return to top. Figure 87 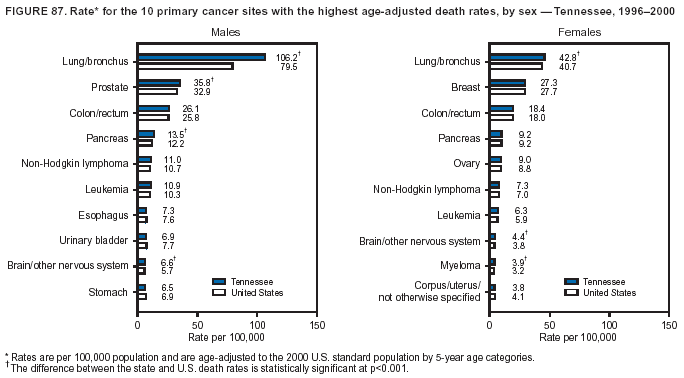 Return to top. Figure 88 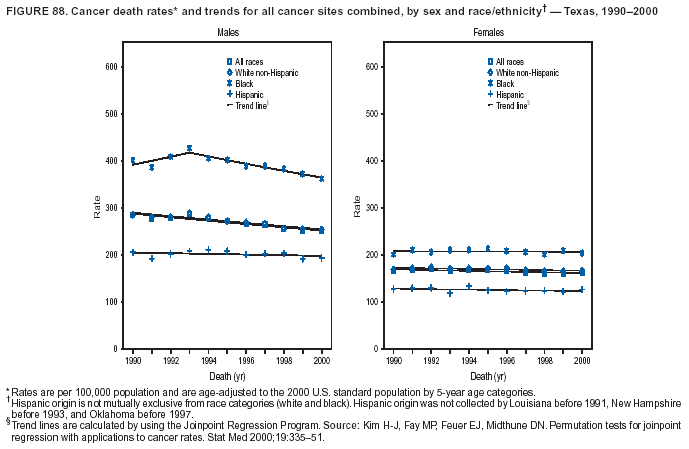 Return to top. Figure 89 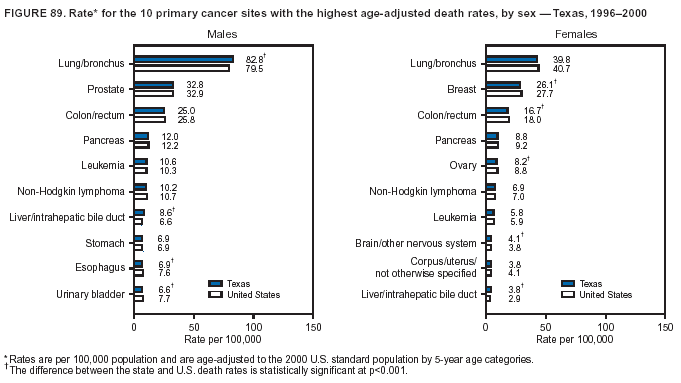 Return to top. Figure 90 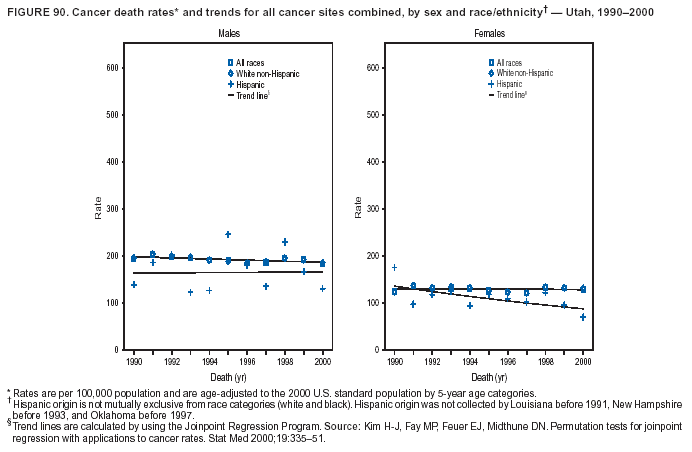 Return to top. Figure 91 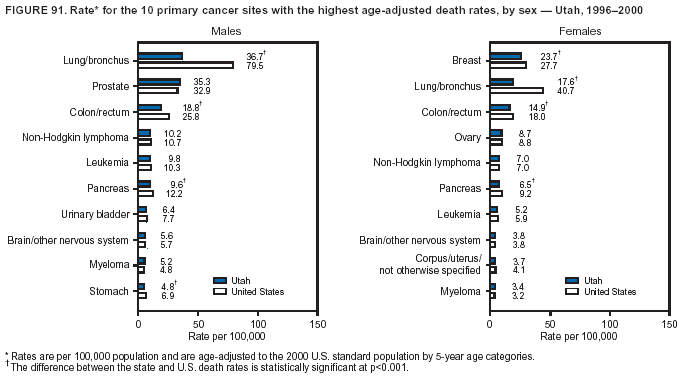 Return to top. Figure 92 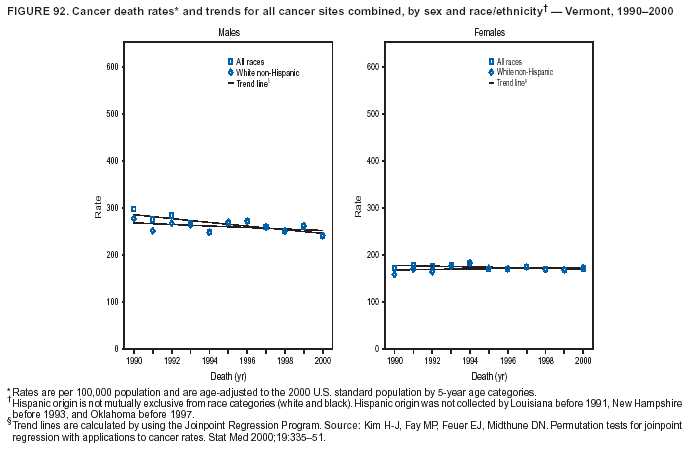 Return to top. Figure 93 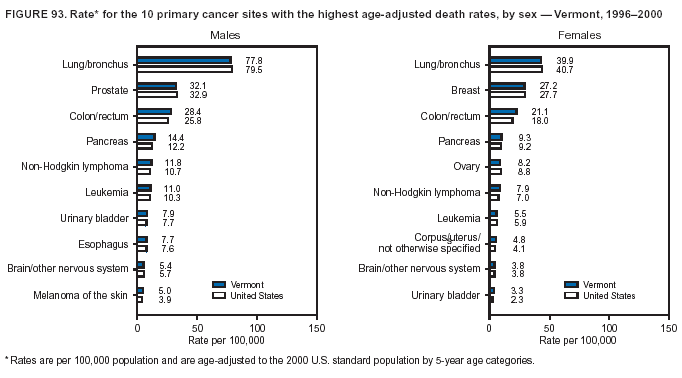 Return to top. Figure 94 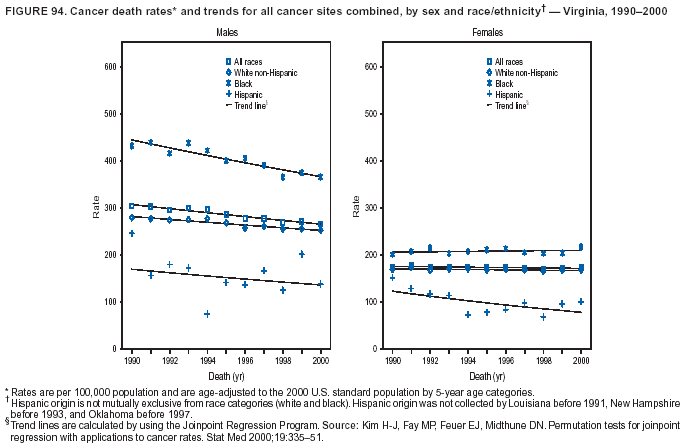 Return to top. Figure 95 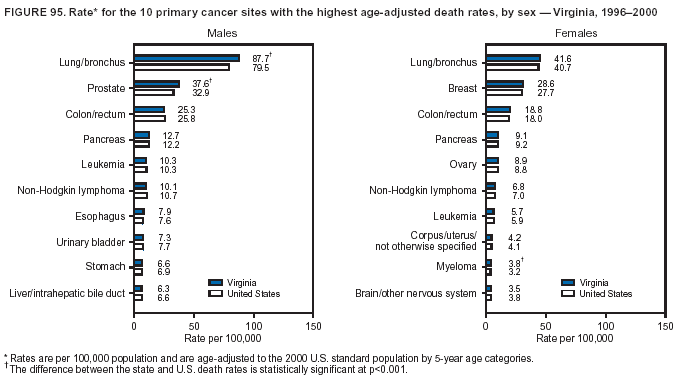 Return to top. Figure 96  Return to top. Figure 97 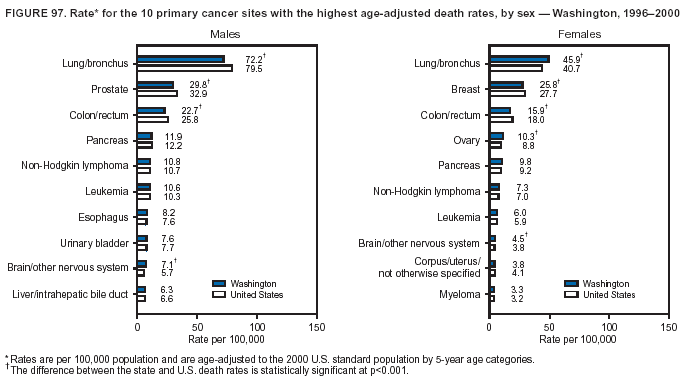 Return to top. Figure 98 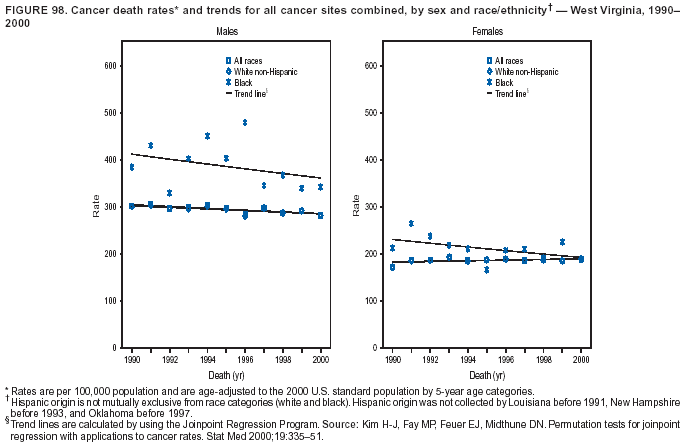 Return to top. Figure 99  Return to top. Figure 100 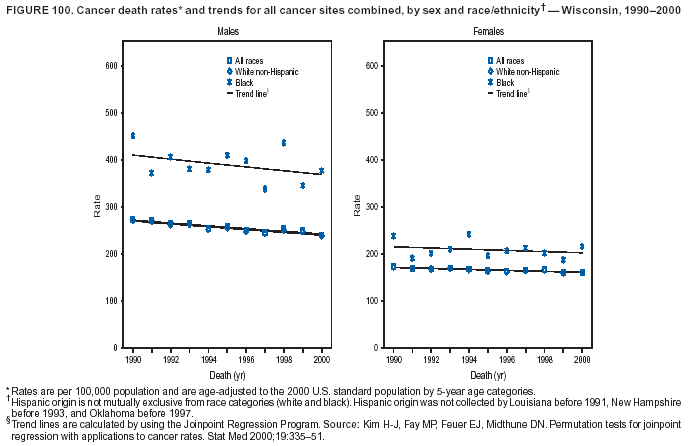 Return to top. Figure 101 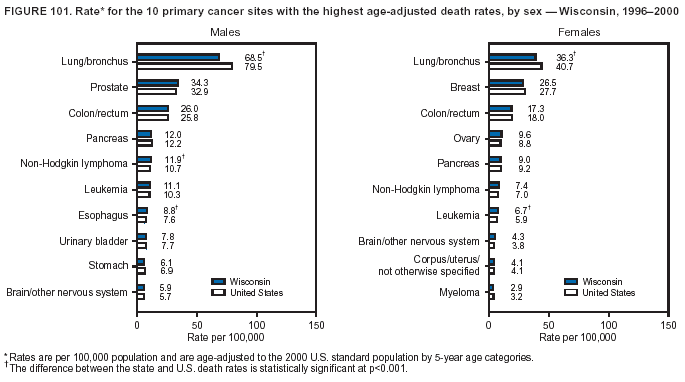 Return to top. Figure 102 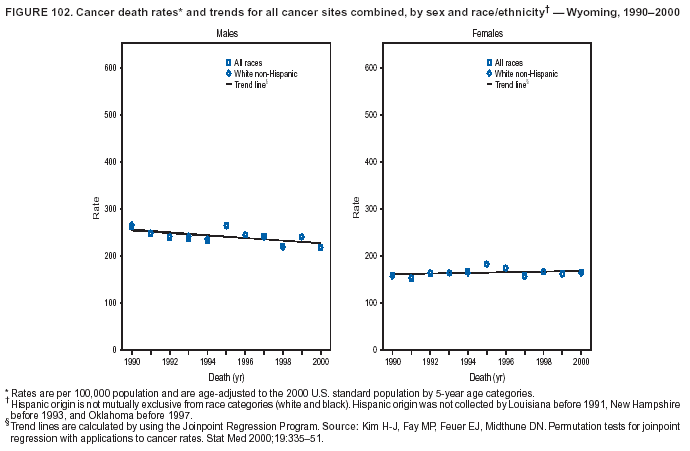 Return to top. Figure 103 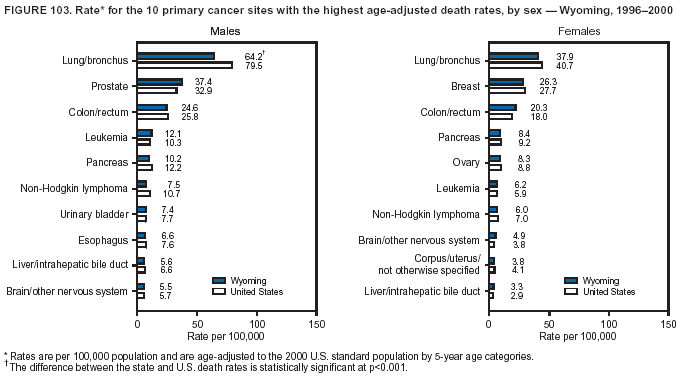 Return to top.
Disclaimer All MMWR HTML versions of articles are electronic conversions from ASCII text into HTML. This conversion may have resulted in character translation or format errors in the HTML version. Users should not rely on this HTML document, but are referred to the electronic PDF version and/or the original MMWR paper copy for the official text, figures, and tables. An original paper copy of this issue can be obtained from the Superintendent of Documents, U.S. Government Printing Office (GPO), Washington, DC 20402-9371; telephone: (202) 512-1800. Contact GPO for current prices. **Questions or messages regarding errors in formatting should be addressed to mmwrq@cdc.gov.Page converted: 5/24/2004 |
|||||||||
This page last reviewed 5/24/2004
|