 |
|
|
|
|
|
|
| ||||||||||
|
|
|
|
|
|
|
||||
| ||||||||||
|
|
|
|
|
Persons using assistive technology might not be able to fully access information in this file. For assistance, please send e-mail to: mmwrq@cdc.gov. Type 508 Accommodation and the title of the report in the subject line of e-mail. Breast Cancer Incidence and Mortality -- United States, 1992Breast cancer is the most commonly diagnosed nondermatologic cancer and the second leading cause of cancer-related deaths among women in the United States (1-3). In 1996, a total of 184,300 new cases of and 44,300 deaths from invasive breast cancer are projected among women (3). To assess trends in incidence and death rates for breast cancer among U.S. women, CDC analyzed national incidence data from the National Cancer Institute's Surveillance, Epidemiology, and End Results (SEER) program (2) and death-certificate data from CDC's National Center for Health Statistics (NCHS) (4). This report presents incidence and death rates for breast cancer for 1992 (the most recent year for which SEER data were available) and summarizes trends in these rates for 1973-1992. Overall, these findings indicate that incidence rates for invasive breast cancer increased among women during 1973-1987 and stabilized during 1988-1992, while mortality rates remained stable during 1973-1988 and decreased during 1989-1992. The incidence rate of breast cancer in the United States is estimated by using aggregate data reported by the SEER program, which includes a nonrandom sample of approximately 14% of the U.S. population (2,5). Based on 1990 data from the Bureau of the Census, the demographic characteristics of persons included in SEER is representative of the total U.S. population for whites and blacks; in addition, persons included in SEER reflect the percentage of persons among the total U.S. population living below the poverty level * and the percentage of adults who graduated from high school (5). However, a higher proportion of persons included in SEER resided in urban areas (5). This analysis includes all cases of invasive breast cancer (International Classification of Diseases, for Oncology, codes C50.0-C50.9) registered in SEER. Annual incidence rates were computed for 1973-1992, and race- and age-specific average annual incidence rates were computed for the combined years of 1988-1992. Decedents for which the underlying cause of death was breast cancer (International Classification of Diseases, Adapted, Ninth Revision, codes 174.0-174.9) were identified from public-use mortality data tapes (4). Annual death rates were computed for 1973-1992, and race-specific average annual death rates by age and by state were computed for the combined years of 1988-1992. Denominators for annual incidence and death rate calculations were derived from U.S. census population estimates. Rates were directly standardized to the age distribution of the 1970 U.S. population using 5-year age groupings. Data are presented only for whites and blacks because numbers for other racial/ethnic groups were too small for meaningful analysis. Breast Cancer Incidence In 1992, the overall age-adjusted incidence rate for breast cancer was 110.6 per 100,000 women. The rate for white women (113.1) was higher than that for black women (101.0). During 1973-1992, the overall incidence rate increased from 82.5 to 110.6: rates increased steadily during 1973-1987, and stabilized during 1988-1992 (Figure_1). During 1988-1992, incidence rates increased directly with age until age 75-79 years for whites and age 80-84 years for blacks (2); the rates for whites and blacks were similar for women aged less than 45 years, but for women aged greater than or equal to 45 years, the rate was higher for whites than for blacks. During 1973-1992, race-specific rates varied: for white women, the age-adjusted rate increased 34% (from 84.3 to 113.1) and, for black women, increased 47% (from 68.7 to 101.0) (2). Breast Cancer Mortality In 1992, a total of 43,063 U.S. women died from breast cancer. The death rate was 26.2 per 100,000 women. During 1973-1992, the overall death rate varied; rates were stable during 1973-1988, before decreasing during 1989-1992 (Figure_1). During 1988-1992, the overall ratio of black-to-white death rates was 1.2 (Table_1). Rates increased directly with age (2). For women aged less than 70 years, the rate was higher for blacks than for whites; for women aged greater than or equal to 70 years, the rate was higher for whites than for blacks. During this period, race-specific rates varied. During 1989-1992, the rate for white women decreased 6% (from 27.5 to 26.0) and, for black women, increased 3% (from 30.4 to 31.2) (2). During 1988-1992, the state-specific age-adjusted death rate ranged from 18.2 in Hawaii to 35.3 in the District of Columbia (Table_1). Reported by: Div of Cancer Prevention and Control, National Center for Chronic Disease Prevention and Health Promotion, CDC. Editorial NoteEditorial Note: The findings in this report indicate that incidence rates for breast cancer increased 34% during 1973-1992. The increase and later stabilization of incidence rates during the 1980s is most likely related to increased use of breast cancer screening methods (6) -- particularly mammography and clinical breast examination, which enable earlier diagnosis of the disease (3). The decrease in breast cancer death rates during 1989-1992 may reflect a combination of factors, including earlier diagnosis and improved treatment. For example, screening mammography and clinical breast examination are effective methods for reducing breast cancer mortality among women aged greater than or equal to 50 years (7). Survival from breast cancer increases when the disease is diagnosed at earlier stages, and from 1974-1976 to 1986-1991, the survival rate for invasive breast cancer increased substantially (2). Differences in the race-specific and state-specific incidence and death rates for breast cancer during 1973-1992 may reflect differences in factors such as socioeconomic status, access to and delivery of medical care, and the prevalence of specific risks for disease (1,5,8). For example, women in minority populations are less likely than white women to be screened for breast cancer (9). Although socioeconomic and risk-factor data were not analyzed in this report, the findings underscore the need for further characterization of the burden of cancer for U.S. women in racial/ethnic, geographic, and other subgroups. Early detection and appropriate treatment are essential to reducing the burden of breast cancer in the United States. CDC's National Breast and Cervical Cancer Early Detection Program provides early detection screening and referral services for cancers of the breast and cervix among older women who have low incomes or are uninsured, underinsured, or in a racial/ethnic minority. Additional efforts by this program and health-care professionals are needed to ensure that every U.S. woman at risk for breast cancer receives breast cancer screening, prompt follow-up, and assurance that tests are conducted in accordance with current federal quality standards. References
Figure_1 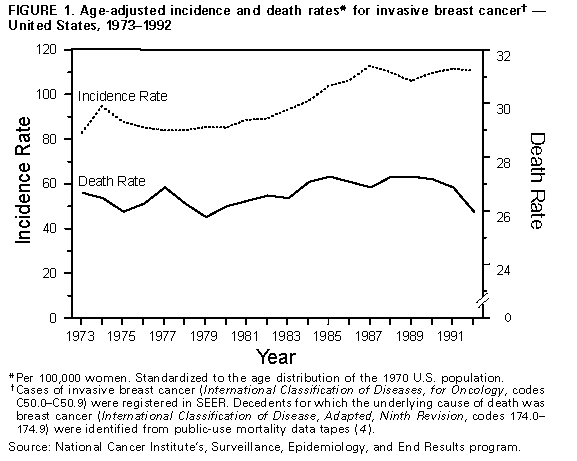 Return to top. Table_1 Note: To print large tables and graphs users may have to change their printer settings to landscape and use a small font size.
TABLE 1. Number of deaths from breast cancer * and age-adjusted death rate +, by state
and race & -- United States, 1988-1992
================================================================================================================
                                No. deaths                     Rate
                        --------------------------    ----------------------- Black-to-white
State                     White    Black     Total    White   Black    Total      ratio
--------------------------------------------------------------------------------------------
Alabama                   2,440      871     3,318     23.5 @  31.5    25.2        1.3
Alaska                      158     **         190     26.3     **     23.6        **
Arizona                   2,609     **       2,707     24.6     **     24.0 @      **
Arkansas                  1,668      298     1,972     22.9 @  30.3    23.8 @      1.3
California               18,702    1,579    21,121     26.9    32.1    26.0 @      1.2
Colorado                  2,169     **       2,260     24.9     **     24.7        **
Connecticut               2,897      181     3,089     26.7    30.0    26.9        1.1
Delaware                    593     **         692     32.0     **     32.5        **
District of Columbia        197      509       712     29.3    38.0    35.3 @      1.3
Florida                  11,859    1,158    13,044     25.2 @  29.0    25.5 @      1.2
Georgia                   3,419    1,116     4,547     24.3 @  27.4    24.9 @      1.1
Hawaii                      177     **         546     25.4     **     18.2 @      **
Idaho                       712     **         717     25.0     **     24.7        **
Illinois                  9,457    1,353    10,853     29.3 @  32.8    29.5 @      1.1
Indiana                   4,513      365     4,888     26.7    33.9    27.2        1.3
Iowa                      2,726     **       2,756     26.5     **     26.4        **
Kansas                    2,078     **       2,191     25.7     **     25.8        **
Kentucky                  2,823      231     3,062     25.4    33.0    25.8        1.3
Louisiana                 2,324    1,046     3,386     25.0    33.2    27.2        1.3
Maine                     1,110     **       1,116     26.7     **     26.7        **
Maryland                  3,188      859     4,073     28.0    32.0    28.6        1.1
Massachusetts             6,110      201     6,335     30.1    31.2    30.0 @      1.0
Michigan                  6,959    1,071     8,070     27.5    33.7    28.1        1.2
Minnesota                 3,686     **       3,744     27.1     **     26.9        **
Mississippi               1,290      631     1,922     22.7    27.8    24.2 @      1.2
Missouri                  4,271      449     4,734     26.1    32.0    26.6        1.2
Montana                     626     **         646     24.8     **     24.8        **
Nebraska                  1,431     **       1,463     26.9     **     26.8        **
Nevada                      803     **         861     26.7     **     26.3        **
New Hampshire             1,021     **       1,025     30.8     **     30.7        **
New Jersey                7,474      894     8,423     31.5 @  34.7    31.6 @      1.1
New Mexico                  963     **       1,000     24.6     **     23.6        **
New York                 16,211    2,292    18,643     31.1 @  29.6    30.5 @      1.0
North Carolina            4,307    1,160     5,518     25.3    30.5    26.3        1.2
North Dakota                564     **         575     27.3     **     27.2        **
Ohio                      9,404      987    10,409     28.3    32.2    28.6        1.1
Oklahoma                  2,259      136     2,468     24.9    24.7    24.0 @      1.0
Oregon                    2,339     **       2,389     25.7     **     25.4        **
Pennsylvania             12,081    1,089    13,200     29.2 @  34.8    29.6 @      1.2
Rhode Island              1,103     **       1,141     31.5     **     31.6        **
South Carolina            1,995      745     2,744     25.5    29.0    26.3        1.1
South Dakota                606     **         624     26.5     **     26.3        **
Tennessee                 3,358      688     4,056     24.1 @  34.2    25.4        1.4
Texas                     9,638    1,412    11,100     23.5 @  30.3    24.0 @      1.3
Utah                        883     **         897     23.3     **     23.2        **
Vermont                     494     **         494     28.0     **     27.9        **
Virginia                  4,035      983     5,057     27.2    33.4    27.9        1.2
Washington                3,713     **       3,851     27.1     **     26.5        **
West Virginia             1,564     **       1,631     24.7     **     24.9        **
Wisconsin                 4,312      130     4,455     27.3    33.1    27.3        1.2
Wyoming                     320     **         324     25.9     **     25.6        **

Total                   189,639   23,114   215,039     27.0    31.3    27.1        1.2
--------------------------------------------------------------------------------------------
 * Decedents for which the underlying cause of death was breast cancer (International Classification of
   Diseases, Adapted, Ninth Revision, codes 174.0-174.9) were identified from public-use mortality data
   tapes (4).
 + Per 100,000 women. Adjusted to the age distribution of the 1970 U.S. population.
 & Numbers for racial/ethnic groups other than black and white were too small for meaningful analysis.
   However, all totals include numbers for other races.
 @ The difference between the state-specific rate and the corresponding U.S. rate is statistically significant
   (p<=0.0002, Bonferroni-adjusted).
** These data were excluded because the annual average number of persons in the denominator was
   <75,000.
================================================================================================================
Return to top. Disclaimer All MMWR HTML versions of articles are electronic conversions from ASCII text into HTML. This conversion may have resulted in character translation or format errors in the HTML version. Users should not rely on this HTML document, but are referred to the electronic PDF version and/or the original MMWR paper copy for the official text, figures, and tables. An original paper copy of this issue can be obtained from the Superintendent of Documents, U.S. Government Printing Office (GPO), Washington, DC 20402-9371; telephone: (202) 512-1800. Contact GPO for current prices. **Questions or messages regarding errors in formatting should be addressed to mmwrq@cdc.gov.Page converted: 09/19/98 |
|||||||||
This page last reviewed 5/2/01
|