|
|
|
|
|
|
|
| ||||||||||
|
|
|
|
|
|
|
||||
| ||||||||||
|
|
|
|
|
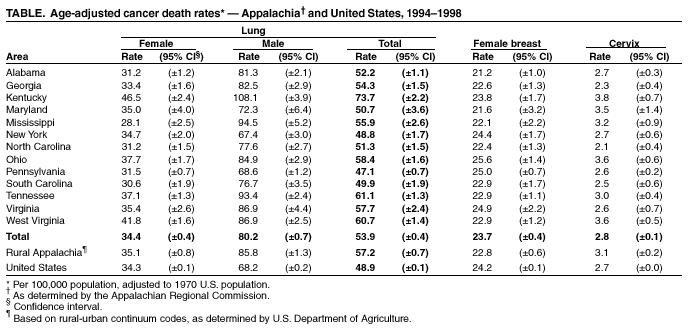
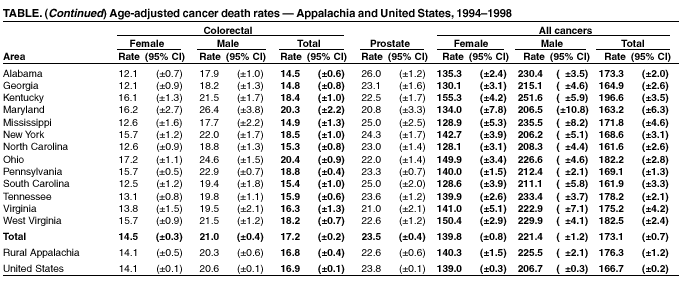
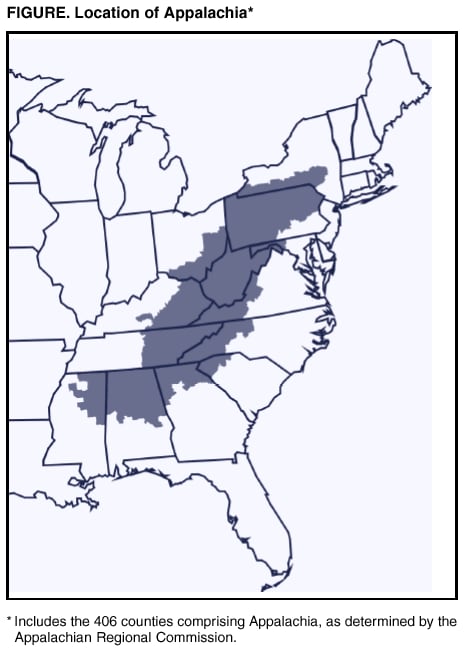
Persons using assistive technology might not be able to fully access information in this file. For assistance, please send e-mail to: mmwrq@cdc.gov. Type 508 Accommodation and the title of the report in the subject line of e-mail. Cancer Death Rates --- Appalachia, 1994--1998Cancer is the second leading cause of death in the United States (1). Although descriptive analyses of mortality data are used often to identify variations by time and person, analyses that focus on regional variations are less common. Appalachia* is a U.S. region with a high prevalence of risk factors for cancer (e.g., tobacco use, physical inactivity, and inadequate access to medical care). Analyses that focus on Appalachia provide valuable information for cancer control, research, and intervention (2). To assess the impact of cancer in Appalachia, researchers from the University of Kentucky and Pennsylvania State University, in collaboration with CDC, analyzed mortality data from CDC's National Center for Health Statistics for 1994--1998. This report summarizes the results of that analysis, which indicate elevated cancer mortality, underscoring the need for ongoing cancer prevention and control programs as a major public health priority in this region. Appalachia encompasses 406 counties in 13 states along the spine of the Appalachian mountains ranging from New York to Mississippi (Figure). The population of Appalachia (1994--1998 average population: 21,927,337) is approximately 8.3% of the total U.S. population. Cancer death rates were age-adjusted by using the 1970 U.S. standard million population; this standard was used instead of the 2000 standard effective with data for 1999 to allow comparability of rates with earlier internal state reports. Rates were calculated by sex and by selected anatomic sites for the United States, all Appalachia, rural Appalachia, and the Appalachian regions of each of the 13 states (3). Rural Appalachian counties were identified according to urban-rural continuum codes (1994--1998 average rural population: 6,835,378) (4,5). Population files from the National Cancer Institute (NCI) Surveillance, Epidemiology, and End Results (SEER) program were used to calculate the age-adjusted death rates (6). Cancers were classified by anatomic site by using the International Classification of Disease (ICD-9). Death rates and 95% confidence intervals (CIs) were calculated for the four anatomic sites associated with the leading causes of cancer deaths: lung, colon-rectum, female breast, and prostate. Rates for cervical cancer also were calculated because of the historically high death rates from this cancer in Appalachia. The death rates for all cancers for rural Appalachia (176.3 per 100,000 population; 95% CI=±1.2) and all Appalachia (173.1; 95% CI=±0.7) were significantly higher than the corresponding U.S. death rate for this period (166.7; 95% CI=±0.2) (Table). The death rates for lung cancer were significantly higher in rural Appalachia and in Appalachia as a whole than in the United States overall, and the rural Appalachian cervical cancer death rate and the Appalachian colorectal cancer death rate were significantly higher than the corresponding overall U.S. rate. The death rates for all cancers, and for lung cancer in particular, for the Appalachian regions of nine of the 13 states were significantly higher than the corresponding U.S. rates (Table). Cervical cancer death rates for the Appalachian regions of three states (Kentucky, Ohio, and West Virginia) were significantly higher than the overall U.S. cervical cancer death rate. The colorectal cancer death rates for the Appalachian regions of six of the 13 states were significantly higher than the corresponding overall U.S. rate. The Appalachian region of Kentucky had the highest death rates for all cancers (196.6; 95% CI=±3.5), lung cancer (73.7; 95% CI=±2.2), and cervical cancer (3.8; 95% CI=±0.7). Reported by: B Huang, MS, SW Wyatt, DMD, TC Tucker, PhD, D Bottorff, MBS, Markey Cancer Center, Cancer Control Program, Univ of Kentucky, Lexington, Kentucky. E Lengerich, VMD, Pennsylvania State Univ, State College, Pennsylvania. HI Hall, PhD, Div of Cancer Prevention and Control, National Center for Chronic Disease Prevention and Health Promotion, CDC. Editorial Note:Residents of Appalachia and other rural regions in the United States have higher rates of poverty, lower education levels, and more limited access to health care (7). Because these factors place these populations at high risk for death from many diseases, including cancer, NCI designated any rural population as a "special population" (8). The high all-cancer death rate in Appalachia reflect higher death rates for males in that region. Elevated lung cancer death rates, which are attributable to a high prevalence of smoking (9), have the greatest impact on Appalachia's all-cancer death rate. The cervical cancer death rate in this region has been higher historically than the U.S. rate. CDC, NCI, and academic and community partners are collaborating to develop research and intervention priorities to address the elevated cervical cancer death rate in this region. In addition, CDC's National Breast and Cervical Cancer Early Detection Program provides screening services for low-income and underserved women in the United States, including Appalachia (10). The high colorectal cancer death rates in parts of Appalachia highlight the need for increased public health attention to this cancer. CDC's National Colorectal Cancer Action Campaign provides information to promote screening for persons aged >50 years (10). The findings in this report underscore the need for a strengthened focus on cancer prevention and control programs as major public health priorities for communities, health-care providers, and public health agencies throughout this region. References
* As determined by the Appalachian Regional Commission, which was mandated federally in 1965 to support economic and social development in the Appalachian region. The Commission is a partnership composed of the governors of the 13 Appalachian states and a presidential appointee representing the federal government.
|
Use of trade names and commercial sources is for identification only and does not imply endorsement by the U.S. Department of
Health and Human Services. |
Disclaimer All MMWR HTML versions of articles are electronic conversions from ASCII text into HTML. This conversion may have resulted in character translation or format errors in the HTML version. Users should not rely on this HTML document, but are referred to the electronic PDF version and/or the original MMWR paper copy for the official text, figures, and tables. An original paper copy of this issue can be obtained from the Superintendent of Documents, U.S. Government Printing Office (GPO), Washington, DC 20402-9371; telephone: (202) 512-1800. Contact GPO for current prices.
**Questions or messages regarding errors in formatting should be addressed to mmwrq@cdc.gov.Page converted: 6/20/2002
|
|
|||||
|
HOME |
ABOUT MMWR |
MMWR SEARCH |
DOWNLOADS |
RSS
|
CONTACT
|
|||||
|
|
|||||
|
This page last reviewed 6/20/2002