 |
|
|
|
|
|
|
|
|
|
|
|
|
|
|
|
|
||||
| ||||||||||
|
|
|
|
|
Persons using assistive technology might not be able to fully access information in this file. For assistance, please send e-mail to: mmwrq@cdc.gov. Type 508 Accommodation and the title of the report in the subject line of e-mail. State-Specific Prevalence of Selected Chronic Disease-Related Characteristics --- Behavioral Risk Factor Surveillance System, 2001Indu B. Ahluwalia, Ph.D. Abstract Problem: High-risk behaviors and lack of preventive care are associated with higher rates of morbidity and mortality in the United States. Without continued monitoring of these factors, state health departments would have difficulty tracking and evaluating progress toward Healthy People 2010 and their own state objectives. Monitoring chronic disease-related behaviors is also key to developing targeted education and intervention programs at the national, state, and local levels to improve the health of the public. Reporting Period Covered: Data collected in 2001 are compared with data from 1991 and 2000, and progress toward Healthy People 2010 targets is assessed. Description of System: The Behavioral Risk Factor Surveillance System (BRFSS) is an ongoing, state-based, telephone survey of persons aged >18 years. State health departments collect the data in collaboration with CDC. In 2001, participants in data collection included all 50 states, the District of Columbia, Guam, the U.S. Virgin Islands, and the Commonwealth of Puerto Rico. BRFSS data are used to track the prevalence of chronic disease-related characteristics and monitor progress toward national health objectives related to 1) decreasing high-risk behaviors, 2) increasing awareness of medical conditions, and 3) increasing use of preventive health services. For certain national objectives, BRFSS is the only source of data. Results: BRFSS data indicate changes in certain high-risk behaviors from 1991 to 2001. Among the findings are substantial increases in the prevalence of obesity among adults aged >20 years. Among states, prevalence of persons classified as obese in 2001 ranged from 15.5% in Colorado to 27.1% in Mississippi. From 1991 to 2001, the median prevalence for all participating states and territories increased from 12.9% to 21.6%. In 1991, no state had an obesity prevalence of >20%; in 2001, 37 states had a prevalence of >20%. Percentage increases in prevalence of obesity, from 1991 to 2001, ranged from 24.9% in the District of Columbia to 140.2% in New Mexico. In 2001, substantial variations also existed among states and territories regarding prevalence of other high-risk behaviors and awareness of medical conditions. Ranges included, for no leisure-time physical activity, 16.5% (Utah) to 49.2% (Puerto Rico); cigarette smoking, 9.6% (Virgin Islands) to 31.2% (Guam); binge drinking, 6.8% (Tennessee) to 25.7% (Wisconsin); heavy drinking, 2.5% (Tennessee) to 8.7% (Wisconsin); persons ever told they had diabetes, 4% (Alaska) to 9.8% (Puerto Rico); persons ever told they had high blood pressure, 20% (New Mexico) to 32.5% (West Virginia); and persons ever told they had high blood cholesterol, 24.8% (New Mexico) to 37.7% (West Virginia). Substantial variations also existed among states regarding prevalence of using preventive health services. Ranges included, for persons aged >50 years ever screened for colorectal cancer by use of sigmoidoscopy or colonoscopy, 30.5% (Virgin Islands) to 62% (Minnesota); persons aged >65 years who received an influenza vaccination in the past year, 36.8% (Puerto Rico) to 79% (Hawaii); persons aged >65 years who ever received a pneumococcal vaccination, 24.1% (Puerto Rico) to 70.9% (Oregon). In 2001, 13 states, Guam, and the U.S. Virgin Islands used the women's health module. Ranges included, for women aged >18 years who had a Papanicolaou (Pap) smear test in the past 3 years, 79.8% (Virgin Islands) to 89.6% (Wisconsin); women aged >40 years who ever had a mammogram, 71.9% (Virgin Islands) to 93% (Rhode Island); and women aged >40 years who had a mammogram in the past 2 years, 57.2% (Virgin Islands) to 85.1% (Rhode Island). BRFSS data in 2001 also indicated variations by sex, race or ethnicity, and age group. Greater percentages of men than women reported cigarette smoking, binge drinking, heavy drinking, and were classified as overweight; greater percentages of women reported no leisure-time physical activity. Among racial or ethnic groups, greater percentages of black non-Hispanics than other groups reported being told by a health professional they had high blood pressure and diabetes, and were classified as obese; greater percentages of white non-Hispanics than other groups reported being told they had high cholesterol. Among age groups, greater percentages of persons aged 18--24 years than those in older groups reported smoking cigarettes, binge drinking and heavy drinking; greater percentages of persons in older age groups than younger age groups reported being told they had diabetes, high blood pressure, and high blood cholesterol. Also, comparison of 2001 BRFSS data with 12 targets from Healthy People 2010 indicates that, in 2001, no state had met the targets for obesity, cigarette smoking, binge drinking, receiving a fecal occult blood test within the past 2 years, receiving annual influenza vaccinations, receiving pneumococcal vaccinations, and receiving Pap tests. Certain states had already met targets for no leisure-time activity, receiving a sigmoidoscopy or colonoscopy, having blood cholesterol checked within the past 5 years, and receiving a mammogram within the past 2 years. Interpretation: BRFSS data in this report indicate that despite certain improvements, persons in a high proportion of U.S. states and territories continue to engage in high-risk behaviors and do not report making sufficient use of preventive health practices. Substantial variations (i.e., by state, sex, age group, and race/ethnicity) in prevalence of behaviors, awareness of medical conditions, and use of preventive services indicate a continued need to monitor these factors at state and local levels and assess progress toward reducing morbidity and mortality. Public Health Actions: BRFSS data can be used to guide public health actions at local, state, and national levels. For certain states, BRFSS is the only reliable source of chronic-disease--related, risk-behavioral data. BRFSS data enable states to design, implement, evaluate, and monitor health-promotion strategies, targeting specific high-risk behaviors among populations experiencing high burdens of disease. BRFSS data continue to be key sources for assessing progress toward both national Healthy People 2010 objectives and state health objectives. IntroductionMorbidity and mortality can be reduced by eliminating high-risk behaviors (e.g., cigarette smoking, binge and heavy drinking, or physical inactivity), by increasing awareness of medical conditions, and by timely use of preventive health services (1--8). Reducing the impact of high-risk behaviors, increasing awareness of medical conditions, and increasing use of disease-screening practices are among the national Healthy People 2010 objectives (9). The Behavioral Risk Factor Surveillance System (BRFSS) is a key source for monitoring modifiable risk factors for diseases and the use of preventive health services. The history, rationale, use, reliability, and validity of measures of BRFSS, as well as certain challenges facing this increasingly complex system, have been described in previous reports (10--13). BRFSS has been collecting information for approximately 20 years. This report is one in a series summarizing annual data collected by states and territories for selected factors (14--16). For 2000 and 2001, prevalence estimates are provided for certain 1) risk factors for diseases, 2) awareness of medical conditions, 3) use of screening tests, and 4) receipt of vaccinations. To examine changes during a 10-year span, prevalences from 2001 are compared with those from 1991. To assess progress toward national goals, 2001 data are compared with Healthy People 2010 targets. Additional tables present the 2001 data by sex, age group, and race or ethnicity. MethodsBRFSS is a system of telephone surveys conducted by state health departments with assistance from CDC. The BRFSS questionnaire consists primarily of questions regarding behaviors that increase risk for one or more of the 10 leading causes of death in the United States. BRFSS uses a multistage design based on random-digit--dialing methods to gather a representative sample from each state's noninstitutionalized civilian residents aged >18 years (n = 212,510). The tables in this report also include data from the District of Columbia and U.S. territories of Guam, Puerto Rico, and the Virgin Islands. Summary statistics are presented for all participants. No data are reported where sample sizes are <50. QuestionnaireThe 2001 BRFSS questionnaire included the following core modules: health status, health-care access, exercise, hypertension awareness, cholesterol awareness, asthma, diabetes, arthritis, immunization, tobacco use, alcohol consumption, firearms, disability, physical activity, prostate cancer screening, colorectal cancer screening, and human immunodeficiency virus/acquired immunodeficiency syndrome (HIV/AIDS). In addition, certain states selected optional modules. Indicators used in this report include cigarette smoking; binge and heavy drinking; leisure-time physical activity; overweight and obesity; awareness of hypertension, high cholesterol, and diabetes; screening for colorectal cancer, breast cancer, and cervical cancer; and two vaccinations for those aged >65 years. Certain questions used in the 2001 surveys were worded differently from those in previous years; response formats for certain questions were changed (e.g., diabetes questions added gestational diabetes); and certain explanations were modified or removed (e.g., explanations preceding mammography and Papanicolaou [Pap] smear test questions). Additional information tracing the history of BRFSS questions is available at http://www.cdc.gov/brfss. Data regarding the selected factors are reported by state, sex, age group, and race or ethnicity. The race or ethnicity of respondents is categorized as white non-Hispanic, black non-Hispanic, Hispanic, other race, and multiracial (i.e., respondents who reported they are of more than one race group but who did not specify one of the categories provided). Data Collection and ProcessingBRFSS data are collected monthly during the interviewing period within each state. The data are sent to CDC, where they are checked for quality (13). In 2001, a computer-assisted telephone interviewing system was used in all 50 states, the District of Columbia, and three U.S. territories. Data Weighting and AnalysisCDC staff members edit and aggregate the monthly data files to create a yearly sample for each state. Those files are weighted to the respondents' probability of being selected as well as to the age-, race-, and sex-specific populations from the annually adjusted 1990 census for each state. The weights are used in this report to calculate prevalence estimates for 1991, 2000, and 2001. SUDAAN® (Survey Data Analysis) software (17) was used in the analyses to take into account the complex sampling design and to calculate the standard errors and 95% confidence intervals. The 1991--2001 percentage differences in this report represent the percentage increase or decrease in prevalence estimates between those two data collections: that is [(2001-1991)/1991] x 100.0 In 2001, the numbers of completed BRFSS interviews ranged from 8,628 in Massachusetts to 871 in Guam. Response rates, based on Council of American Survey Research Organizations guidelines, ranged from 81.5% in Puerto Rico to 33.3% in New Jersey. BRFSS data quality is optimal; when compared with other national surveys, BRFSS data have been demonstrated to be reliable and valid (12). However, a recent report discussed challenges and limitations of managing this increasingly complex system (13). Additional information regarding BRFSS data analysis is available at http://www.cdc.gov/brfss. ResultsThis report examines 2001 BRFSS data as they relate to 12 national Healthy People 2010 objectives and targets (Table 1). Data from 2001 indicate no state had met 2010 targets for reducing obesity to 15% (among persons aged >20 years); reducing cigarette smoking to 12% (among persons aged >18 years); reducing binge drinking to 6% (among persons aged >18 years); increasing fecal occult blood testing (FOBT) in the past 2 years to 50% (among persons aged >50 years); increasing annual influenza vaccinations to 90% (among persons aged >65 years); increasing pneumococcal vaccinations to 90% (among persons aged >65 years); increasing Pap tests to 97% (among women aged >18 years); and increasing Pap tests in the past 3 years to 90% (among women aged >18 years). For the four other targets, certain states had met the targets, and others were substantially short of the targets. Also, substantial disparities in chronic disease-related behaviors and practices were indicated when data were examined by sex, age group, and race or ethnicity. Data from 2001 are also compared with those from 1991 and 2000. Following is a summary of the findings. Risk Factors for Chronic DiseasesOverweight and Obesity Self-reported weight and height were used to calculate body mass index (BMI = kg/m2). Persons were classified as overweight if their BMI was >25 and obese if their BMI was >30. In 2001, prevalence of overweight ranged from 51.4% in Hawaii to 63.8% in Mississippi (median: 59.1%) (Table 2). A total of 41 states and Puerto Rico reported slight increases from 2000. Comparing 1991 data with 2001, the median prevalence for all participating states increased from 46.1% to 59.1%. Among states and territories, 1991--2001 percentage increases ranged from 11.9% in the District of Columbia to 44.3% in Colorado. In 2001, more men than women were classified as overweight (median: 67.1% versus 50.3%). Black non-Hispanics were most likely to be classified as overweight (68.2%); those classified as other race or ethnicity were least likely (49.5%) (Table 3). Prevalences by age group indicate that 36.1% of persons aged 18--24 years were overweight, whereas >50% of those aged >25 years were overweight (Table 4). Prevalence of persons (aged >20 years) classified as obese in 2001 ranged from 15.5% in Colorado to 27.1% in Mississippi (Table 5). A total of 41 states and Puerto Rico reported slight increases from 2000. Comparing 1991 data with 2001, the median prevalence for all participating states increased from 12.9% to 21.6%. Percentage changes from 1991 to 2001 ranged from 24.9% in the District of Columbia to 140.2% in New Mexico. In 1991, no state had an obesity prevalence of >20% (Figure 1); in 2001, 37 states had a prevalence of >20% (Figure 2). In 2001, men and women were approximately equally likely to be classified as obese (median: 21.9% versus 21.1%, respectively). Prevalence of obesity was highest among black non-Hispanics (median: 32.4%) and lowest among those classified as other race or ethnicity (16.2%) (Table 6). Prevalence of obesity increased with age, ranging from 12.3% for persons aged 20--24 years to 25.6% for persons aged 55--64 years (Table 7). The Healthy People 2010 prevalence target for obesity is 15%. According to 2001 data, no state had reduced its obesity prevalence to meet that target. No Leisure-Time Physical Activity Respondents were asked whether, in the past month, they had participated in leisure-time physical activity (e.g., running, calisthenics, golf, gardening, or walking). In 2001, prevalence of no leisure-time physical activity ranged from 49.2% in Puerto Rico to 16.5% in Utah (Table 8). Slight improvement overall was indicated from 1991 (median: 28%) and 2000 (27%) to 2001 (25.8%). In 2001, women were more likely than men to report no leisure-time physical activity (median: 28.1% versus 23.1%, respectively). Among racial or ethnic groups, Hispanics (35.7%) were most likely to report no leisure-time physical activity, and white non-Hispanics least likely (22.8%) (Table 9). Prevalence of no leisure-time physical activity increased with age, ranging from 18.9% for persons aged 18--24 years to 39.1% for those aged >75 years (Table 10). The Healthy People 2010 target for no leisure-time physical activity is 20%. The 2001 BRFSS results indicated six states had already exceeded that target, and eight additional states were near the target level. Cigarette Smoking Respondents were asked a series of questions regarding their former and current smoking habits. Respondents who had smoked >100 cigarettes in their lifetime and who also now smoke were classified as cigarette smokers. In 2001, prevalence of cigarette smoking ranged from 31.2% in Guam to 9.6% in the Virgin Islands. Among states, cigarette smoking ranged from 30.9% in Kentucky to 13.2% in Utah (Table 11). A slight decline was indicated from 2000 (median: 23.2%) to 2001 (22.9%). Comparing 1991 with 2001, data indicated a decrease in cigarette smoking from a median of 24.1% to 22.9%. Although the majority of states reported declining rates in cigarette smoking during 1991--2001, a total of 15 states reported increases (Figure 3). In 2001, cigarette smoking was more prevalent among men than women (median: 25.5% versus 21.3%, respectively). Among racial or ethnic groups, cigarette smoking ranged from 32% for persons in the multiracial group to 22.4% for black non-Hispanics (Table 12). Prevalence of cigarette smoking decreased with age, ranging from a median of 30.7% for persons aged 18--24 years to 6.5% for those aged >75 years (Table 13). The Healthy People 2010 target for cigarette smoking is to reduce prevalence to 12%. BRFSS data indicated no state had met that target in 2001. Binge Drinking Respondents were asked a series of questions regarding their consumption of alcoholic beverages. Binge drinking was defined as having >5 drinks on >1 occasion in the past month. In 2001, self-reported binge drinking ranged from 25.7% in Wisconsin to 6.8% in Tennessee, with a median of 14.8% (Table 14). Comparing data from 1991 with 2001, approximately no change was indicated in binge drinking (median: 14.5% versus 14.8%, respectively). Of the 47 states with data for both years, 23 states and the District of Columbia reported an increase in binge drinking from 1991--2001, and 24 reported a decline. In 2001, a greater proportion of men (median: 22.7%) than women (7%) reported binge drinking. Prevalence of binge drinking by race or ethnic group ranged from a median of 18.3% for Hispanics to 10.2% for black non-Hispanics (Table 15). Binge drinking was highest (median: 30.3%) among the group aged 18--24 years and <7% for those aged >55 years (Table 16). The Healthy People 2010 target for binge drinking is to reduce prevalence to 6%. BRFSS data from 2001 indicated no state had met that target. Heavy Drinking Heavy drinking is defined as an average, in the past month, of >2 drinks/day for men and >1 drink/day for women. In 2001, prevalence of heavy drinking ranged from 8.7% in Wisconsin to 2.5% in Tennessee, with a median of 5.2% (Table 17). Comparing data from 1991 with 2001 indicates an increase from a median of 3.4% to a median of 5.2%. Among the 47 states reporting data for both years, 43 and the District of Columbia reported increases in heavy drinking from 1991 to 2001. In 2001, a greater proportion of men than women (median: 6.4% versus 3.9%, respectively) reported heavy drinking. Prevalence of heavy drinking by race or ethnic group ranged from a median of 5.5% for white non-Hispanics to 3.3% for black non-Hispanics (Table 18). Persons aged 18--24 years reported the highest prevalence of heavy drinking (8.6%), with the behavior decreasing with age to 1.8% for persons aged >75 years (Table 19). Awareness of Medical ConditionsDiabetes Respondents were asked, "Have you ever been told by a doctor that you have diabetes?" Respondents who answered "yes" included those with gestational diabetes; specific classifications of diabetes (e.g., type 1 or type 2) were not assessed. In 2001, the percentage of persons ever told they had diabetes ranged from 9.8% in Puerto Rico to 4% in Alaska, with a median of 6.6% (Table 20). In 1991, the range was from 7.2% in Tennessee to 2.9% in Colorado (median: 4.8%). All states reporting on this indicator, except Alaska and Hawaii, indicated increases in awareness of diabetes from 1991 to 2001 (Figures 4,5). In 2001, men and women were almost equally likely to be told they had diabetes (median: 6.6% versus 6.5%). Persons told they had diabetes ranged from 9.6% for those classified as multiracial to 5.9% for white non-Hispanics (Table 21). Prevalence of being told they had diabetes varied among age groups, ranging from 0.7% for persons aged 18--24 years to 15.4% for persons aged 65--74 years (Table 22). Hypertension Respondents were asked, "Have you ever been told by a doctor, nurse, or other health professional that you have high blood pressure?" In 2001, the percentages of respondents who reported ever being told by a health professional that they had high blood pressure ranged from 32.5% in West Virginia to 20% in New Mexico (median: 25.6%) (Table 23). Comparing data from 1991 with 2001 indicated an overall increase in awareness of high blood pressure from a median of 21% to 25.6%. In 2001, men and women were almost equally likely to have been told they had high blood pressure (median: 25% versus 26.2%, respectively). A greater prevalence of black non-Hispanics (median: 33.1%) were told they had high blood pressure than other racial or ethnic groups, whereas Hispanics had the lowest prevalence (19.2%) (Table 24). Prevalence of persons told they had high blood pressure increased substantially with age, ranging from a median of 6% among persons aged 18--24 years to 54.4% for those aged >75 years (Table 25). High Blood Cholesterol Prevalence of BRFSS participants who reported ever having been told by a health professional that they had high blood cholesterol ranged, in 2001, from 37.7% in West Virginia to 24.8% in New Mexico (median: 30.3%) (Table 26). In 1991, prevalences ranged from 31.5% in Michigan to 20.3% in the District of Columbia (median: 26.2%). Comparing 1991 data with 2001, the majority of states indicated an increase in the proportion of persons ever told they had high cholesterol. In 2001, men were slightly more likely than women to have been told they had high blood cholesterol (median: 31.2% versus 29.7%, respectively). White non-Hispanics (median: 31%) were most likely to have been told they had high blood cholesterol than other racial or ethnic groups; Hispanics (median: 24.6%) were least likely (Table 27). Prevalence of persons told they had high blood cholesterol increased with age, ranging from a median of 8% for persons aged 18--24 years to 40.6% for persons aged >75 years (Table 28). Screening PracticesBlood Cholesterol In 2001, percentages of respondents who reported ever having their blood cholesterol checked ranged from 84.7% in Massachusetts to 69.1% in Guam (median: 77%) (Table 29). The 1991 prevalences for blood cholesterol checks ranged from 74.3% in Connecticut to 59.6% in Utah (median: 66.8%). Comparing the data from 1991 with 2001 indicated an increase among all states in prevalence of ever having blood cholesterol checked (Figure 6). In 2001, more women reported ever having their blood cholesterol checked than men (median: 79.5% versus 75%, respectively). White non-Hispanics (median: 80.2%) were most likely to report ever having their cholesterol checked; Hispanics (66.6%) were least likely (Table 30). Prevalence of having blood cholesterol checked increased with age, ranging from a median of 44.6% for persons aged 18--24 years, to 93.7% for persons aged 65--74 years (Table 31). For comparison with the national target, the percentages of respondents who reported having their blood cholesterol checked in the past 5 years is also presented in this report. In 2001, those percentages ranged from 81.4% in Massachusetts to 65.4% in Nebraska (median: 72.5%) (Table 32). All 48 states with data for both years observed increases from 1991--2001. In 2001, more women than men (median: 74.7% versus 70.5%, respectively) reported having their blood cholesterol checked in the past 5 years. Among racial or ethnic groups, white non-Hispanics (median: 75.3%) were most likely to report having their cholesterol checked in the past 5 years; Hispanics (64.2%) were least likely (Table 33). Prevalence of having blood cholesterol checked in the past 5 years increased with age, ranging from a median of 43.1% for persons aged 18--24 years, to 90.4% for persons aged 65--74 years (Table 34). The Healthy People 2010 target for having blood cholesterol checked in the past 5 years is 80%. BRFSS data indicated two states and the District of Columbia had already met that target in 2001. Colorectal Cancer Respondents aged >50 years were asked if they had ever had a sigmoidoscopy or colonoscopy exam. In 2001, the percentages having one of these exams varied from 62% in Minnesota to 30.5% in the Virgin Islands (median: 46.3%) (Table 35). BRFSS data for 1991 were available for seven states and indicated a range from 48.6% in California to 37.8% in New Hampshire (median: 45%). In 2001, men were almost equally as likely as women to report ever having one of these screening exams (median: 47.3% versus 46.5%, respectively). White non-Hispanics (median: 48%) were more likely than other racial or ethnic groups to report having an exam; those classified as other race were least likely (31.6%) (Table 36). Prevalence of persons having a sigmoidoscopy or colonoscopy exam increased with age, from a median of 31.5% for persons aged 50--54 years, to 53% for persons aged >75 years (Table 37). The Healthy People 2010 target for persons aged >50 years who have ever had a sigmoidoscopy is 50%. In 2001, 15 states either met or exceeded that target. Respondents aged >50 years were also asked if they had a sigmoidoscopy or colonoscopy exam in the past 5 years. In 2001, the percentages varied from 53.6% in Delaware to 24.4% in the Virgin Islands (median: 37.4%) (Table 38). Of the seven states with data from 1991, the range was from 35.9% in California to 25.9% in New Hampshire (median: 31.1%). In 2001, men were more likely than women to report having this screening in the past 5 years (median: 38.4% versus 35.9%, respectively). White non-Hispanics (median: 39.1%) were more likely than other racial or ethnic groups; those classified as other race were least likely (26.6%) (Table 39). Prevalence of persons having had a sigmoidoscopy or colonoscopy exam in the past 5 years increased with age, from a median of 26.3% for persons aged 50--54 years, to 45.4% for persons aged 65--74 years (Table 40). Another type of colorectal cancer screening is the home-administered FOBT. Respondents aged >50 years were asked if they had used a home kit to test for blood in their stool in the past 2 years. In 2001, data ranged from 43.2% in Vermont to 0.1% in Puerto Rico (median: 31.3%) (Table 41). For the seven states that collected these data in 1991, all reported higher prevalences in 1991 than in 2001. In 2001, men were slightly more likely than women to report using this test in the past 2 years (median: 31.5% versus 30.6%, respectively). White non-Hispanics (median: 33.1%) were more likely than other racial or ethnic groups to report using this test; those classified as other races (19.8%) were least likely (Table 42). Use of FOBT varied by age, ranging from a median of 22.7% for persons aged 50--54 years to 36.6% for persons aged 65--74 years (Table 43). The Healthy People 2010 target for persons aged >50 years using an FOBT in the past 2 years is 50%. The 2001 data indicated no state had met that target. VaccinationsInfluenza Vaccination The percentage of respondents aged >65 years who reported having an influenza vaccination in the previous year ranged from 79% in Hawaii to 36.8% in Puerto Rico (median: 66.2%) (Table 44). Men were slightly more likely than women to have received an influenza vaccination (median: 68.6% versus 65.6%, respectively). Receipt of influenza vaccinations varied by race or ethnicity, ranging from a median of 74.1% for those classified as other race to 48.9% for Hispanics (Table 45). Persons aged >75 years were more likely to have been vaccinated than those aged 65--74 years (median: 71.5% versus 63.6%, respectively) (Table 46). The Healthy People 2010 target for annual influenza vaccination for those aged >65 years is 90%. In 2001, no state had met that target. Pneumococcal Vaccination In 2001, the percentage of respondents aged >65 years who reported ever having a pneumococcal vaccination ranged from 70.9% in Oregon to 24.1% in Puerto Rico (median: 61.3%) (Table 47). Women were slightly more likely than men to have received pneumococcal vaccination (62.5% versus 60%, respectively). Receipt of pneumococcal vaccinations varied substantially by race or ethnicity, ranging from 65.2% for those classified as other race to 37.7% for black non-Hispanics (Table 48). Persons aged >75 years were more likely to have been vaccinated than those aged 65--74 years (median: 66.6% versus 55.1%, respectively) (Table 49). The Healthy People 2010 target for ever having a pneumococcal vaccination for those aged >65 years is 90%. In 2001, no state had met that target. Women's Health ScreeningsData using a questionnaire module on women's health were collected by 13 states and two U.S. territories in 2001. Summaries of those results follow. Cervical Cancer In 2001, the percentage of women aged >18 years with an intact cervix who reported ever having a Pap test was >90% in all 13 states (median: 94.5%) and approximately 90% in Guam (89.4%) and the Virgin Islands (89.5%) (Table 50). In 1991, the overall percentage of women aged >18 years ever having a Pap test was slightly higher (median: 95.4%), ranging from 97.3% in Georgia to 93.9% in Mississippi. Pap test history varied by race or ethnicity, ranging from 95.8% for white non-Hispanics to 88.4% for those classified as other races (Table 51). Women aged 18--24 years (median: 83.8%) were least likely to have had a Pap test; women aged 45--54 years were most likely (98.1%) (Table 52). The Healthy People 2010 target for women aged >18 years who have ever received a Pap test is 97%. No state had reached that target in 2001. In 2001, the percentage of women aged >18 years with an intact cervix who had a Pap test in the past 3 years ranged from 89.6% in Wisconsin to 79.8% in the Virgin Islands (median: 87.1%) (Table 53). Again, the 1991 prevalences were slightly higher (median 89.4%), ranging from 94.9% in Wisconsin to 86.4% in Mississippi. In 2001, history of having a Pap test in the past 3 years varied by race or ethnicity, ranging from a median of 87.5% for black non-Hispanic women to 80.6% for those classified as other races (Table 54). Women aged >75 years were least likely to have had a Pap test in the past 3 years (median: 63.8%); women aged 25--34 were most likely (91.9%) (Table 55). The Healthy People 2010 target for women aged >18 years receiving a Pap test in the past 3 years is 90%. In 2001, no state had achieved that mark. Breast Cancer In 2001, the percentage of women >40 years of age who ever had a mammogram ranged from 93% in Rhode Island to 71.9% in the Virgin Islands (median: 86.7%) (Table 56). Comparing 1991 data with 2001, all 13 states indicated an increase in prevalence of mammograms. Percentages from 1991 ranged from 79.5% in Rhode Island to 61.1% in Mississippi (median: 70.5%). In 2001, mammogram history varied by race or ethnicity, ranging from 87.3% for white non-Hispanics to 81.1% for Hispanics (Table 57). Women aged 40--44 years were least likely (median: 75.3%) to report ever having had a mammogram; women aged 65--74 years were most likely (90.1%) (Table 58). In 2001, the percentage of women aged >40 years who reported having a mammogram in the past 2 years ranged from 85.1% in Rhode Island to 57.2% in the Virgin Islands (median: 76.3%) (Table 59). Comparing 1991 data with 2001 indicated an increase in women having had a mammogram in the past 2 years. Variations were also indicated by race or ethnicity, ranging from a median of 76.8% for women classified as multiracial, to 68.2% for Hispanics (Table 60). Women in the youngest group, aged 40--44 years, were least likely (median: 65.8%) to have reported receiving a mammogram in the past 2 years; women aged 55--64 years were most likely (81%) (Table 61). The Healthy People 2010 target for women aged >40 years having a mammogram in the past 2 years is 70%. Of the 13 states that collected this information, 11 had already reached that target in 2001. DiscussionBRFSS has tracked the state-to-state prevalence of key health-risk behaviors for approximately 20 years, and BRFSS data are valued for measuring progress toward national and state health objectives and targeting prevention efforts. In this report, BRFSS data indicate state-to-state variations in prevalence of multiple chronic-disease--related behaviors and use of preventive practices. State-to-state variations can reflect differences in the composition of state populations, socioeconomic factors (e.g., distribution of wealth, unemployment rate, or level of urbanization), state laws, and preventive practices (e.g., bans on smoking in public places or reimbursements for health screenings). BRFSS is unique in providing data that enable state health policymakers to assess their own states' needs, and determine progress toward their own states' goals. This report focuses on major high-risk behaviors and use of preventive health practices that affect chronic diseases associated with morbidity and mortality in the United States. Obesity and overweight increase the risks associated with morbidity from various diseases and conditions (e.g., hypertension, diabetes, coronary heart disease [CHD], stroke, arthritis, and various types of cancers) (5). The substantial increases in overweight and obesity from 1991--2001 underscore the need to develop and implement intervention programs at the state level. Similarly, BRFSS data serve as key indicators for assessing the effectiveness of state and local programs to increase physical activity (4). Comparing 1991 BRFSS data with 2001 indicates limited improvement in leisure-time physical activity. Cigarette smoking is a major cause of morbidity and mortality in the United States (2). Despite a slight decrease in cigarette smoking from 1991 to 2001, prevalence of cigarette smoking continues to be much greater in certain states than others, and continued smoking cessation efforts are necessary (18). Research suggests certain comprehensive state programs are effective in decreasing tobacco consumption, and health officials in each state should develop strategies to address their populations (18). Excessive alcohol use is known to be associated with motor vehicle and other accidents, and certain health conditions (e.g., liver diseases, hypertension, heart disease, and stroke) (3). In 2001, more persons reported binge drinking (median: 14.8%) than heavy drinking (5.2%); men and persons in younger age groups were more likely to engage in both behaviors. Hispanics reported greater prevalence of binge drinking than other racial and ethnic groups, whereas white non-Hispanics were more likely to engage in heavy drinking. Such BRFSS data indicate a need to develop special targeted interventions that address the problems associated with alcohol abuse at community as well as state levels (3). BRFSS data also provide insight into awareness of medical conditions. Comparing 1991 with 2001 data, the majority of states indicated an increase in the percentages of persons ever told by a health professional they had diabetes, high blood pressure, or high blood cholesterol. Greater proportions of black non-Hispanics than other racial or ethnic groups reported being told they had diabetes or high blood pressure. Greater proportions of white non-Hispanics than other racial or ethnic groups reported being told they had high blood cholesterol. Another key area covered by BRFSS data in this report is screening for chronic diseases and cancer. High blood cholesterol is a major modifiable risk factor for CHD, and changes in personal and family lifestyles can reduce cholesterol levels (19). The 2001 data indicated gaps in cholesterol testing among various racial and ethnic groups, pointing to a need for continued health education efforts aimed at encouraging screening. Colorectal cancer is a leading cause of cancer-related death in the United States, resulting in an estimated 135,000 cases and 56,000 deaths in 2001. Early detection of colon cancer can result in early initiation of treatment, increasing the likelihood of success (20,21). Tests administered to screen for colorectal cancer are sigmoidoscopy, colonoscopy, and the home-administered FOBT. From 1991 to 2001, data indicate an increase in the use of sigmoidoscopy or colonoscopy tests, but a decrease in FOBT screening. Men were slightly more likely than women to have had these screening tests, and variations were observed among age and racial/ethnic groups. Pneumonia and influenza are major causes of morbidity and mortality among older persons. In 2001, among persons aged >65 years, a median of 61.3% reported ever receiving a pneumococcal vaccination, and 66.2% reported receiving an influenza vaccination in the past year. Those aged >75 years were more likely to have received both vaccinations compared with those aged 65–74 years. In 2001, no state had met the Healthy People 2010 target to vaccinate 90% of persons aged >65 years against these illnesses. Multiple screening practices addressing women’s health are assessed using BRFSS data in this report. Pap tests and mammograms are routinely performed to screen women for cervical and breast cancers. The American Cancer Society estimated that among women in 2001, approximately 12,900 cases and 4,400 deaths resulted from cervical cancer and 193,700 cases and 40,200 deaths resulted from breast cancer (20). Early detection and subsequent early treatment can lead to reductions in morbidity and mortality from these two diseases. BRFSS data indicate that in 2001, high proportions of women aged >18 years reported ever having Pap test (median: 94.5%) and having a Pap test in the past 3 years (87.1%). Also, breast cancer screening for women aged >40 years increased from 1991 to 2001. Of the 13 states that collected these data, 11 had already met the Healthy People 2010 target of 70% for women aged >40 years who had a mammogram in the past 2 years. Review of BRFSS state data regarding risk factors and preventive behaviors suggests certain programs aimed at smoking cessation and cancer screening have been successful. Conversely, more state-based programs are needed to increase leisure-time physical activity, reduce overweight and obesity, and close gaps (i.e., by state, sex, age group, and race or ethnicity) in use of screening and preventive services. LimitationsBRFSS prevalence estimates can differ from those of other national surveys (e.g., National Health Interview Survey or National Health and Nutrition Examination Survey) because of differences in methodology, wording of questions, or survey time frame. The reliability and validity of BRFSS measures have been tested extensively (12). However, despite strict standards, challenges exist. These challenges include 1) meeting the needs of multiple programs that use BRFSS data, 2) adopting new methods of data collection in the face of changing telecommunication technology, and 3) producing locallevel data that can be used to evaluate health-promotion programs. To meet these and other challenges, the BRFSS team has sought input from leading authorities regarding survey methodology and developed a strategy to guide future activities (13). Certain limitations to BRFSS data also exist because the survey might not collect information from persons without telephones or who use only cell phones. Finally, certain prevalence estimates might require cautious interpretation because of changes in the questions or formats (22), or because data are self-reported (23) and certain behaviors might be underreported. Conclusion BRFSS remains a unique system for collecting state-specific data to monitor high-risk health behaviors, awareness of medical conditions, and use of preventive practices. Despite certain limitations, BRFSS data are useful for assessing changes over time in chronic-disease–related health behaviors and for planning targeted prevention efforts. Progress toward achieving Healthy People 2010 and state health objectives can be measured from ongoing BRFSS data. BRFSS data underscore the continued need for innovative programs that leverage the expertise of CDC, state and local health departments, and private partners to address risk factors and reduce the burden from chronic disease in the United States. References
2001 Behavioral Risk Factor Surveillance System State and Territory Project Coordinators Alabama, Sondra Reese, M.P.H.; Alaska, Patricia Owens; Arizona, Brian Bender, M.B.A.; Arkansas, John Senner, Ph.D.; California, Bonnie Davis, Ph.D.; Colorado, Becky Rosenblatt; Connecticut, Mary Adams, M.P.H.; Delaware, Fred Breukelman District of Columbia; John Davies-Cole, Ph.D.; Florida, Shino Oba, M.S.P.H.; Georgia, Linda Martin, M.S.; Guam, Cynthia Naval, M.S. Hawaii, Florentina Reyes-Salvail, M.S.; Idaho, Kathy Simplot; Illinois, Bruce Steiner, M.S.; Indiana, Linda Stemnock; Iowa, Donald Shepherd, Ph.D.; Kansas, Mona Arnold; Kentucky, Tracey Sparks; Louisiana, Buddy Bates, M.S.P.H.; Maine, Judith Graber, M.S.; Maryland, Helio Lopez; Massachusetts, Zi Zhang, M.P.H.; Michigan, Harry McGee, M.P.H.; Minnesota, Nagi Salem, Ph.D.; Mississippi, Dick Johnson, M.S.; Missouri, Jeannette Jackson-Thompson, Ph.D.; Montana, Joanne Oreskovich, Ph.D.; Nebraska, Larry Andelt, Ph.D.; Nevada, Emil DeJan, M.P.H.; New Hampshire, Josephine Porter, M.P.H.; New Jersey, Kenneth O'Dowd, Ph.D.; New Mexico, Wayne Honey, M.P.H.; New York, Colleen Baker; North Carolina, Ziya Gizlice, Ph.D.; North Dakota, Larry Shireley, M.P.H.; Ohio, Patricia (Pullen) Coss; Oklahoma, Kelly Baker, M.P.H.; Oregon, Kathryn Pickle, M.P.H.; Pennsylvania, Linda Mann; Puerto Rico, Yvette Cintron, M.P.H.; Rhode Island, Jana Hesser, Ph.D.; South Carolina, Beili Dong, M.D.; South Dakota, Mark Gildemaster; Tennessee, David Ridings; Texas, Jimmy Blanton, M.P.A.; Utah, Kathy Marti; Vermont, Rodney McCormick, Ph.D.; Virgin Islands, Julia Sheen, M.P.H.; Virginia, Gerges Seifen, M.D.; Washington, Katrina Wynkoop Simmons, Ph.D.; West Virginia, Fred King; Wisconsin, Karl Pearson; Wyoming, Menlo Futa, M.A. CDC Behavioral Risk Factor Surveillance System Team Indu Ahluwalia, Ph.D.; Lina Balluz, Sc.D.; William P. Bartoli; Julie Brown; Gloria J. Colclough; Clark H. Denny, Ph.D.; Kathy A. Douglas, Ph.D.; Evelyn Dunn; William S. Garvin, III; David Gilbertz, M.S.; Jane Grimsley; Ronald N. Goodson, M.S.W.; Kenneth J. Laliberte, M.P.A.; Karin A. Mack, Ph.D.; Kathleen Y. McDuffie, Ph.D.; Ali Mokdad, Ph.D.; Wilmon Murphy; Catherine Okoro, M.S.; James Ribble; Yolanda Rowe; Bill Scott; Ajay Sharma; Carol A. Stanwyck, Ph.D.; Horace V. Thompson; and Machell Town, M.Sc., Division of Adult and Community Health, National Center for Chronic Disease Prevention and Health Promotion. Table 1 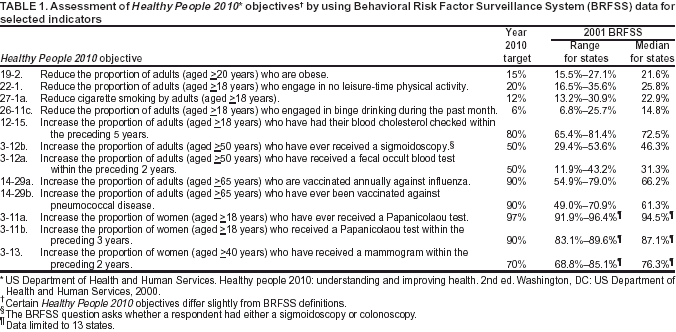 Return to top. Figure 1 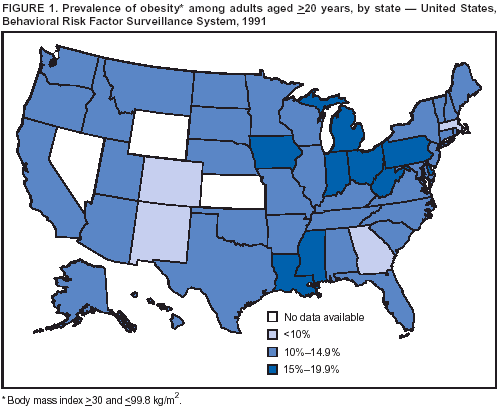 Return to top. Table 2 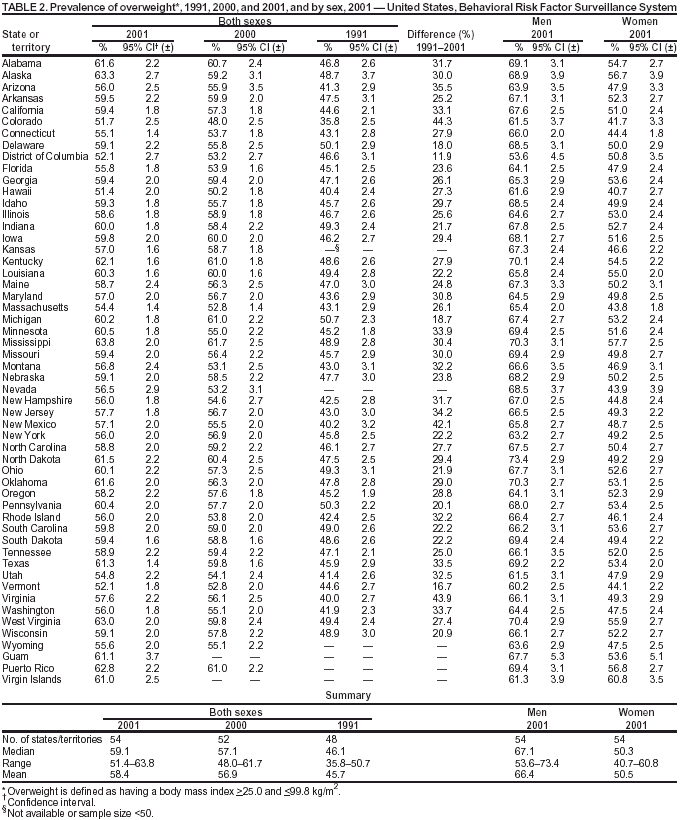 Return to top. Figure 2 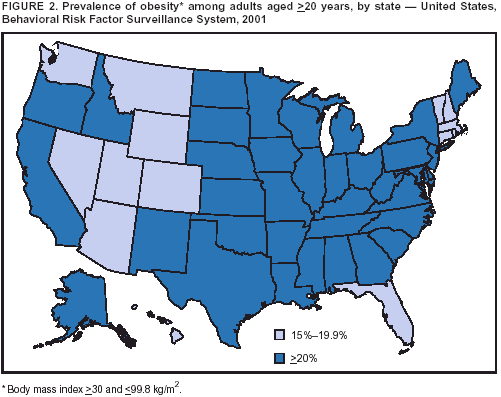 Return to top. Table 3 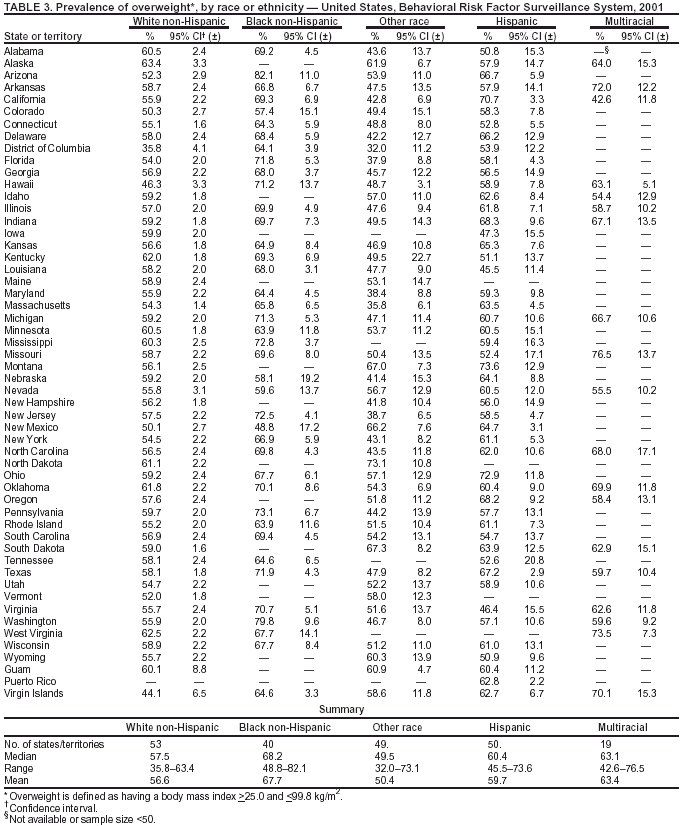 Return to top. Figure 3 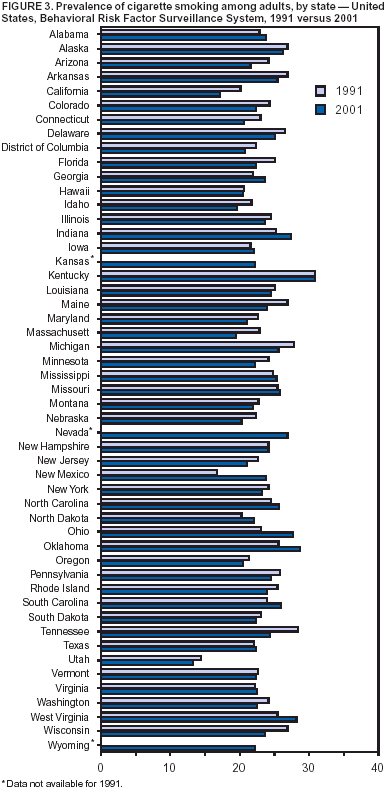 Return to top. Table 4 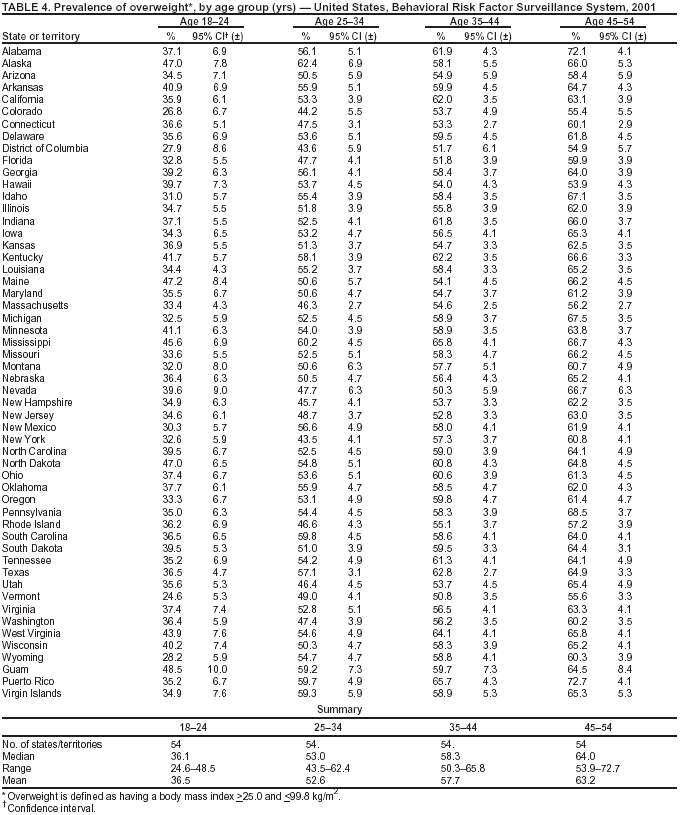 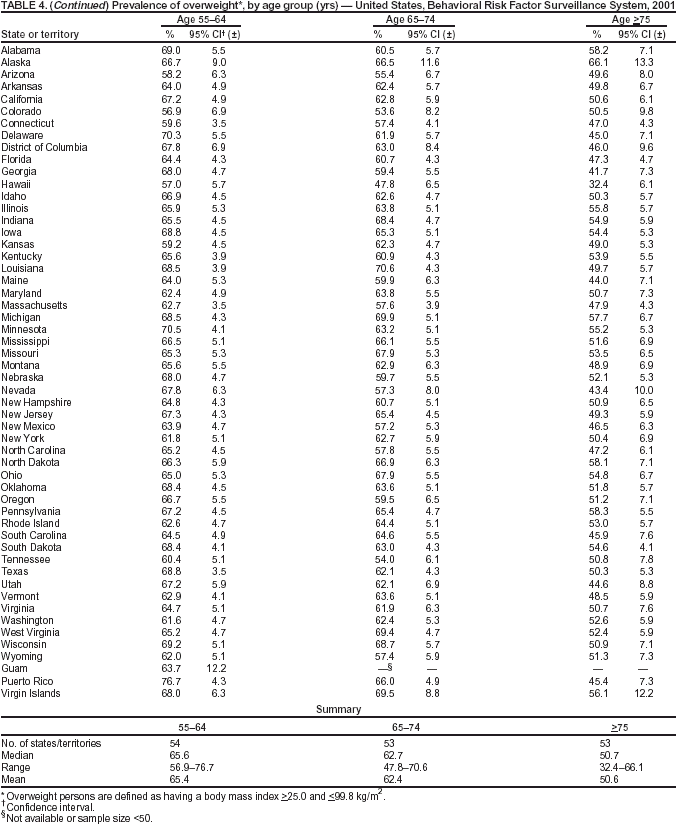 Return to top. Table 5 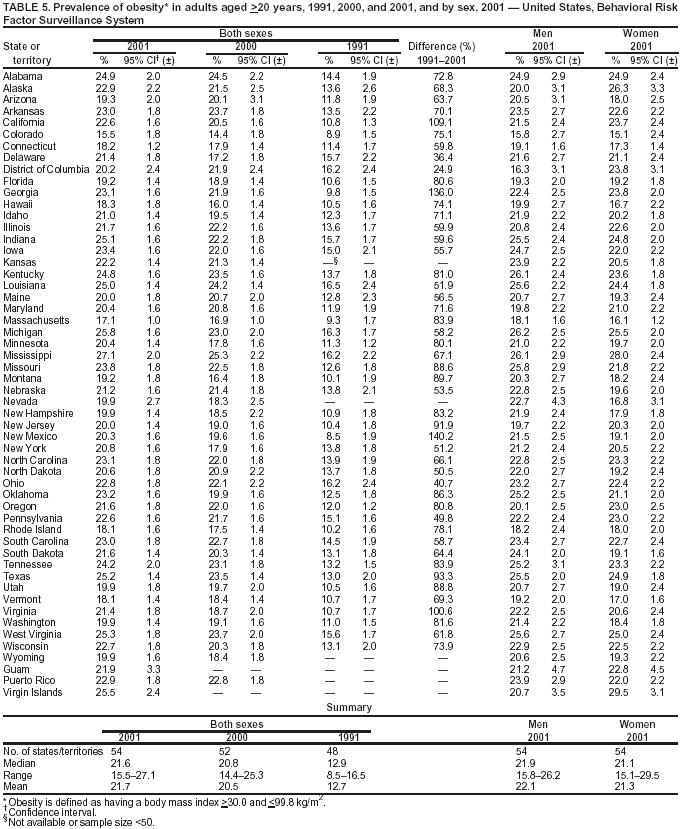 Return to top. Table 6 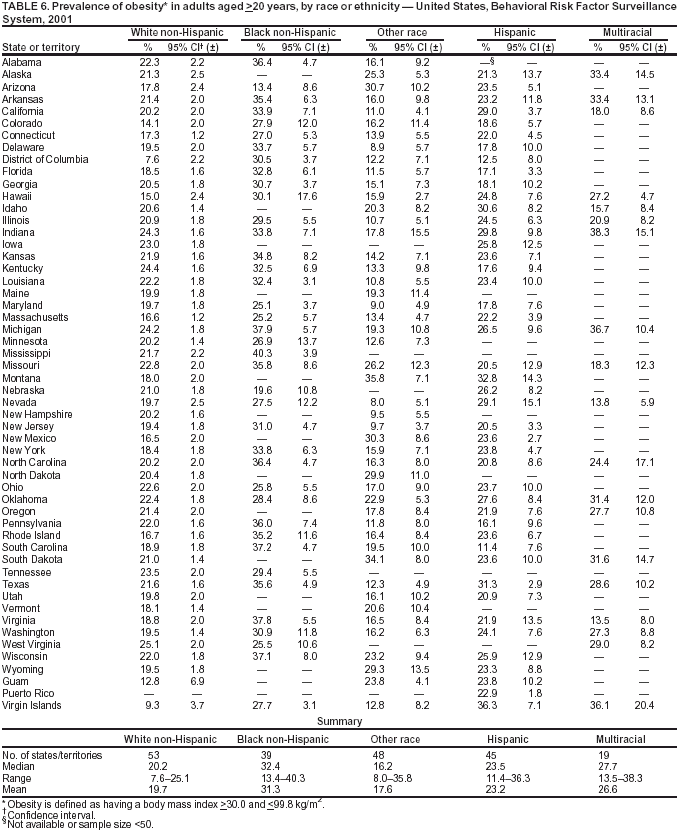 Return to top. Figure 6 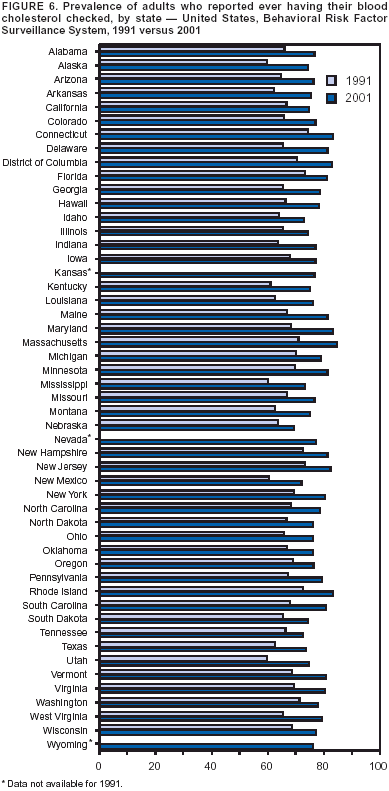 Return to top. Table 7 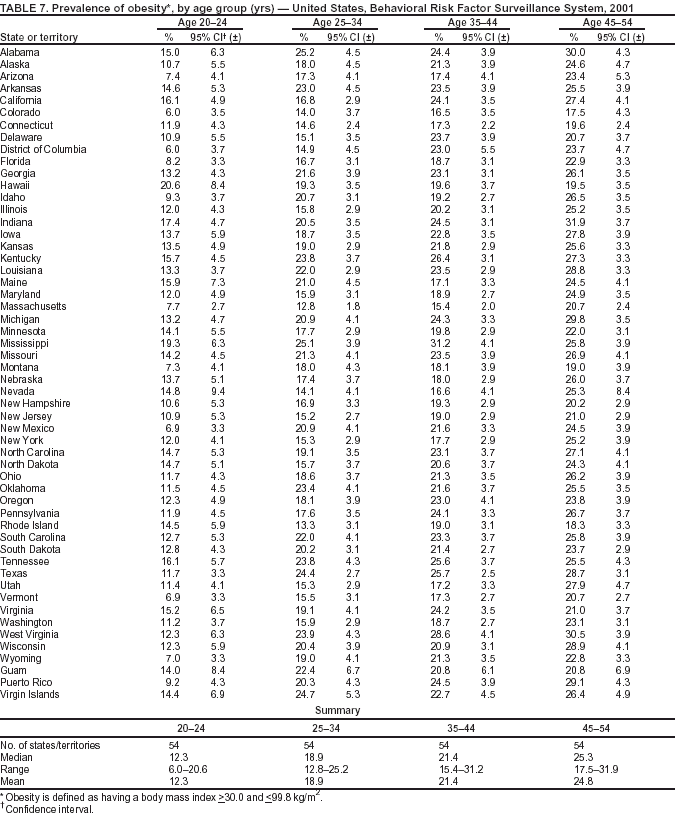 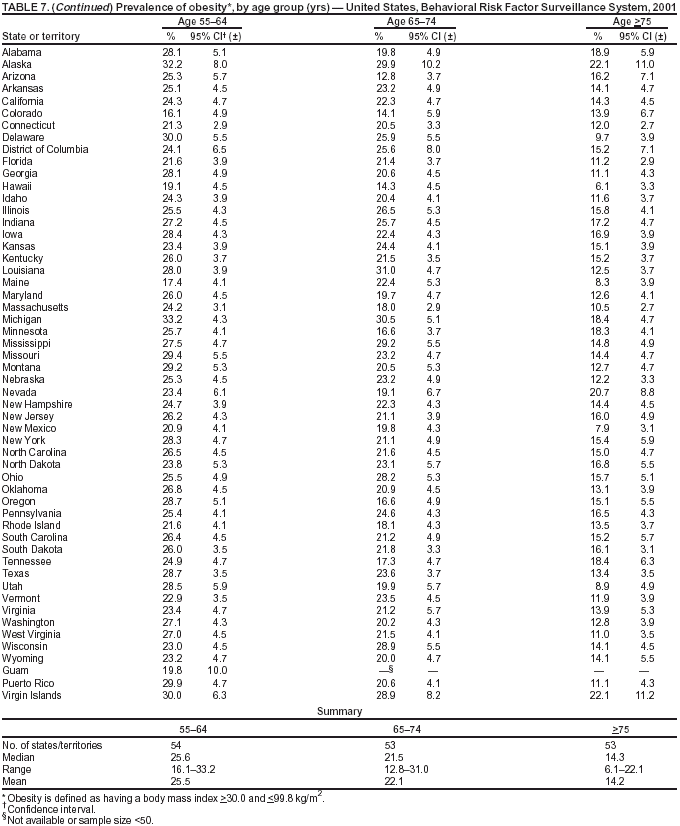
Table 8  Return to top. Table 9 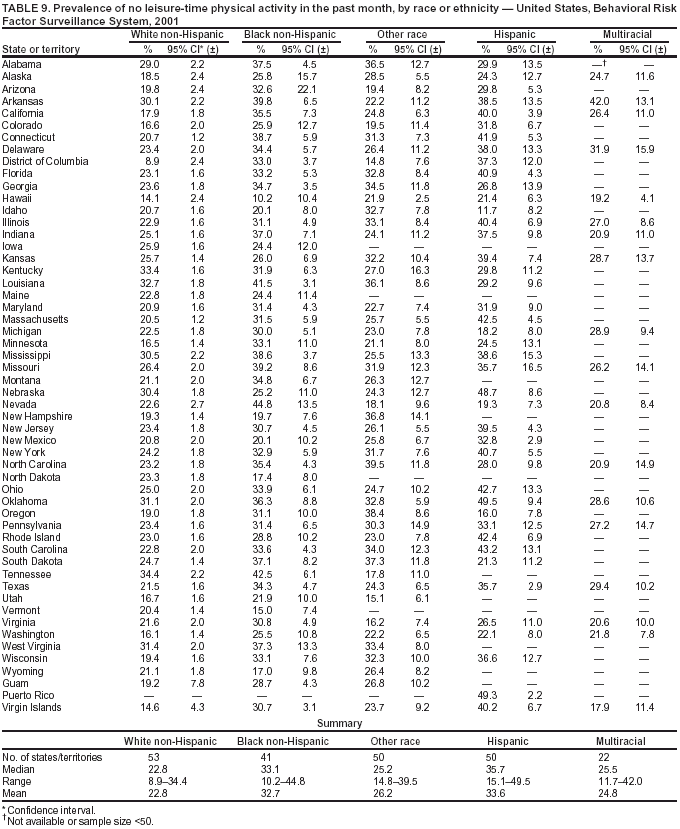 Return to top. Table 10 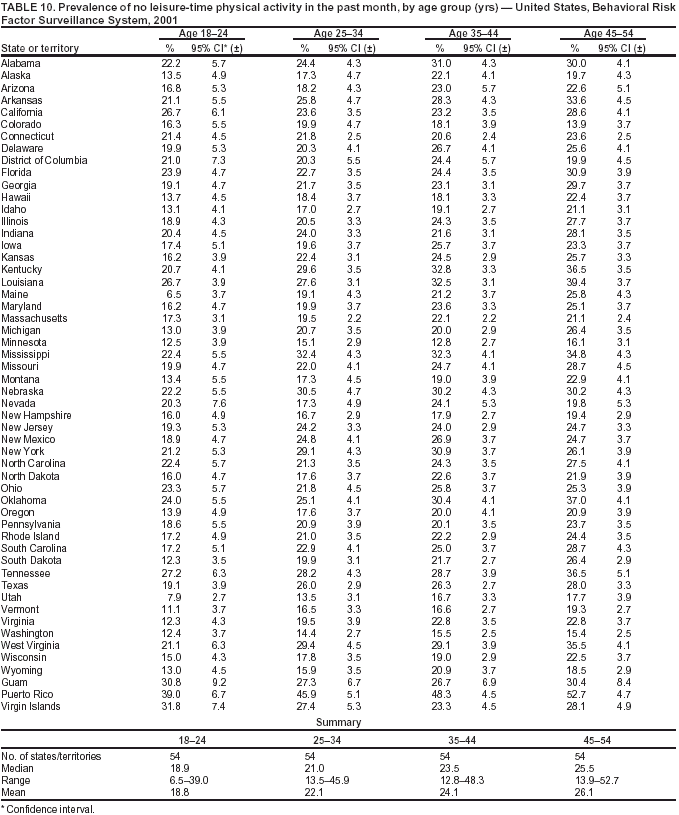 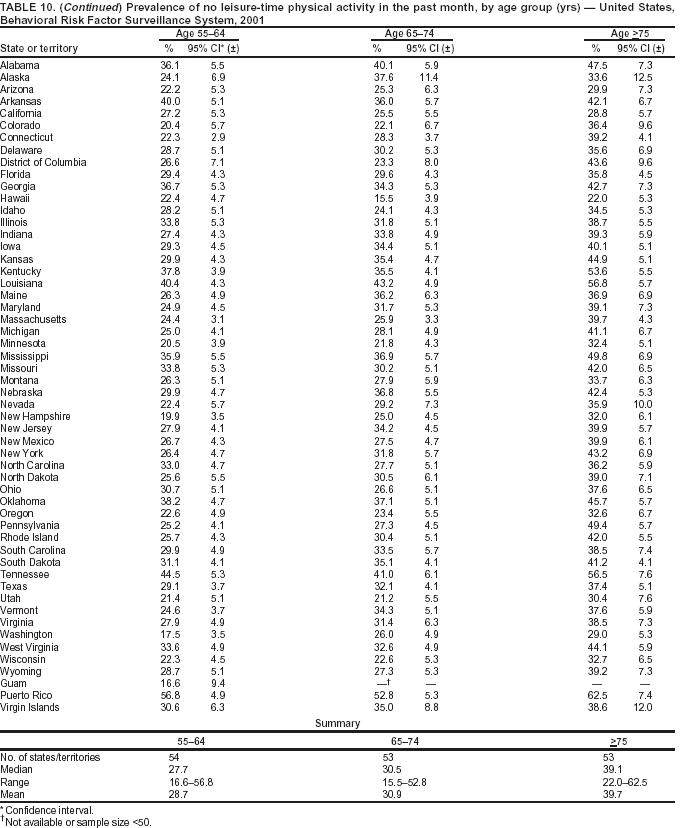 Return to top. Table 11 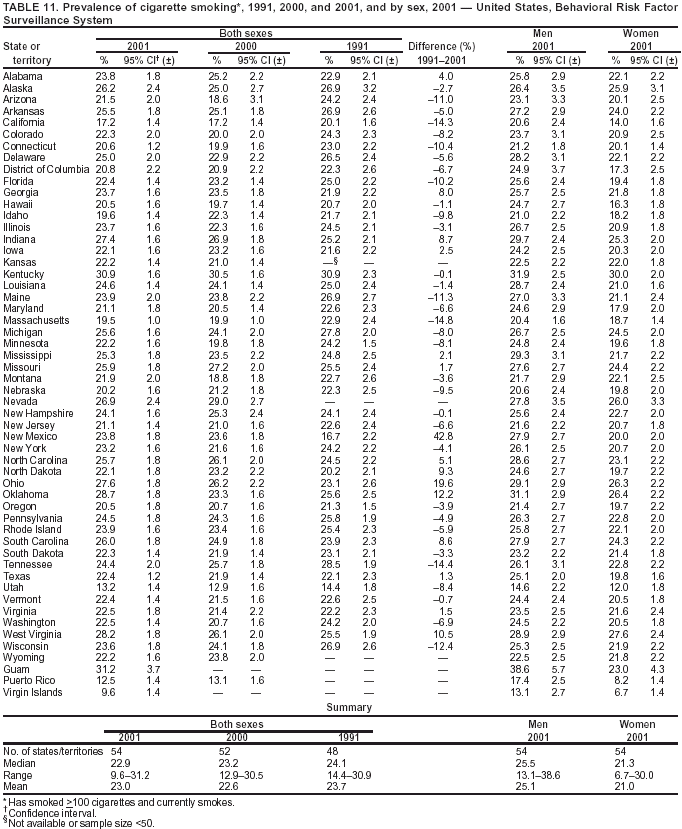 Return to top. Table 12 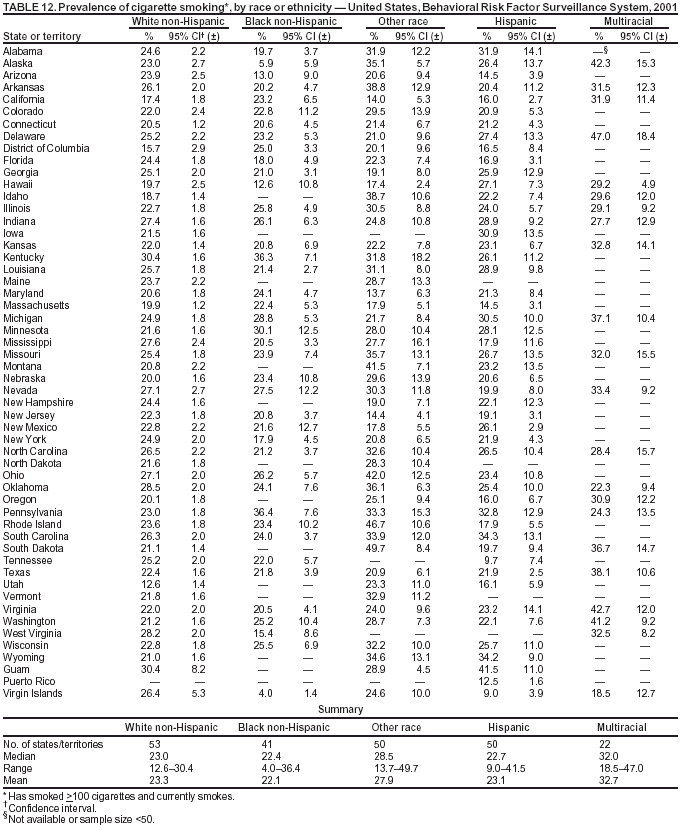 Return to top. Table 13 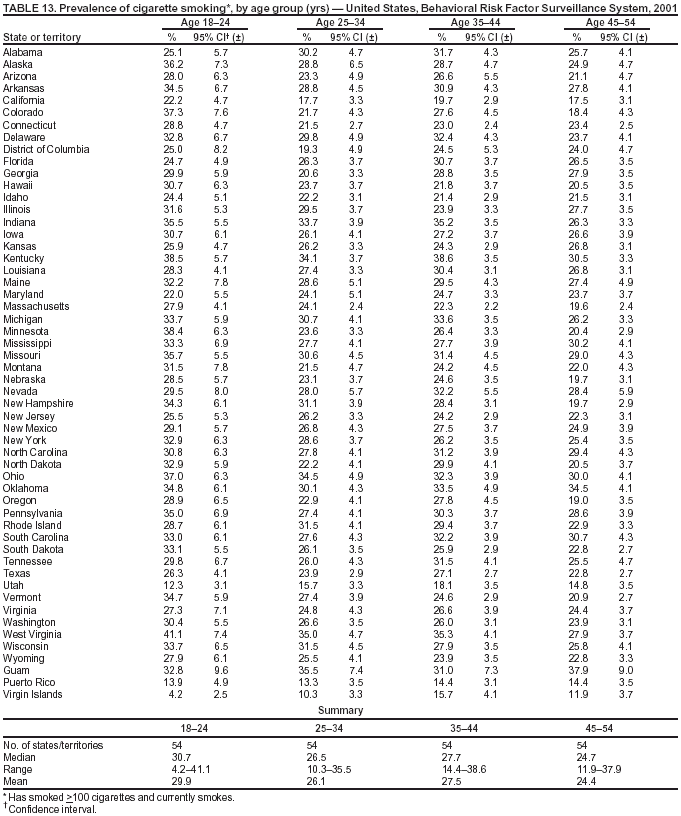 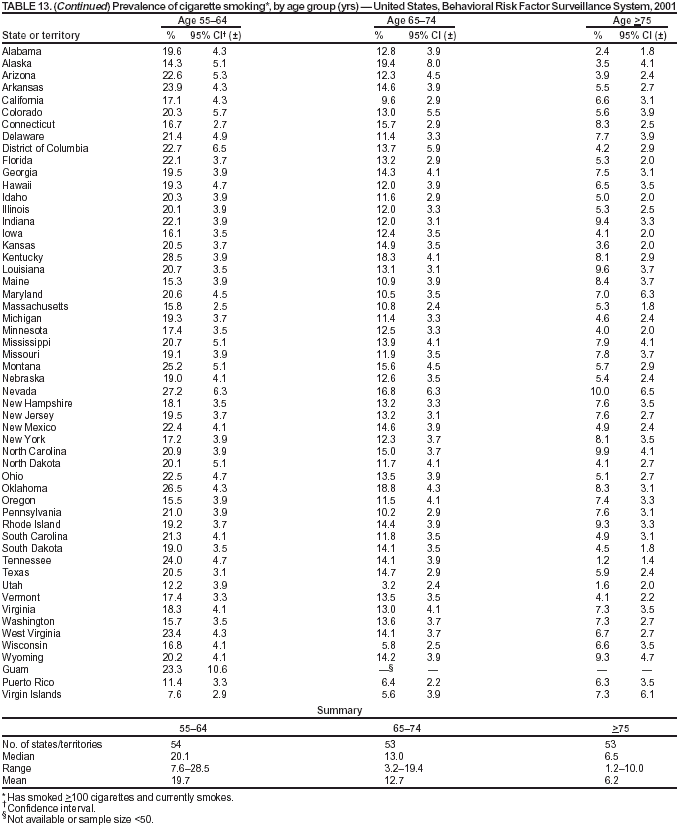
Table 14 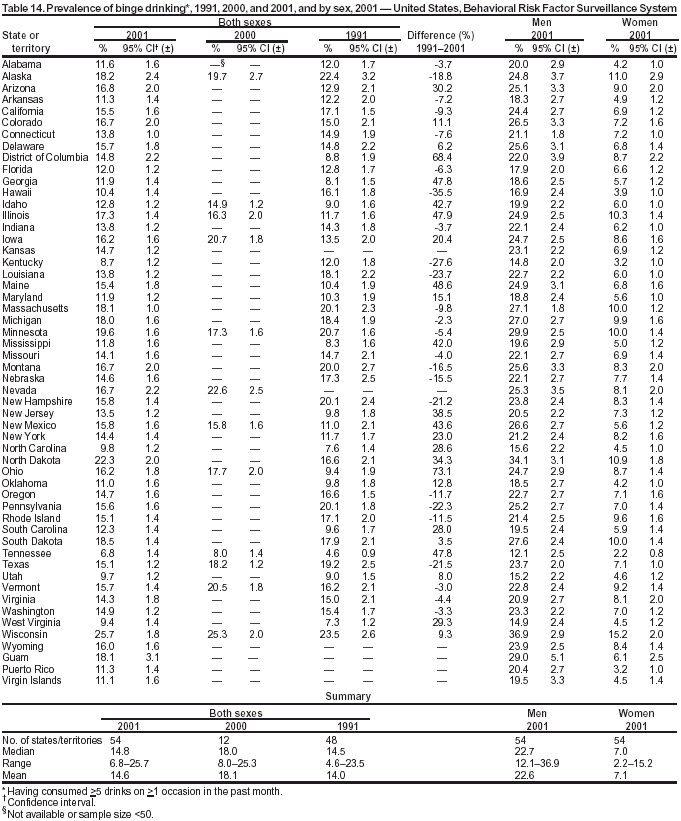 Return to top. Table 15  Return to top. Table 16 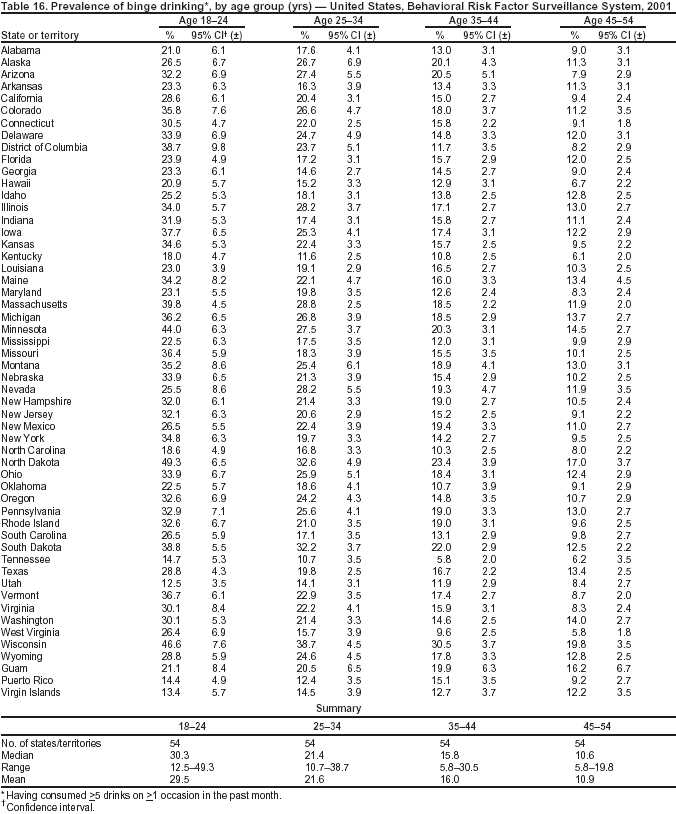 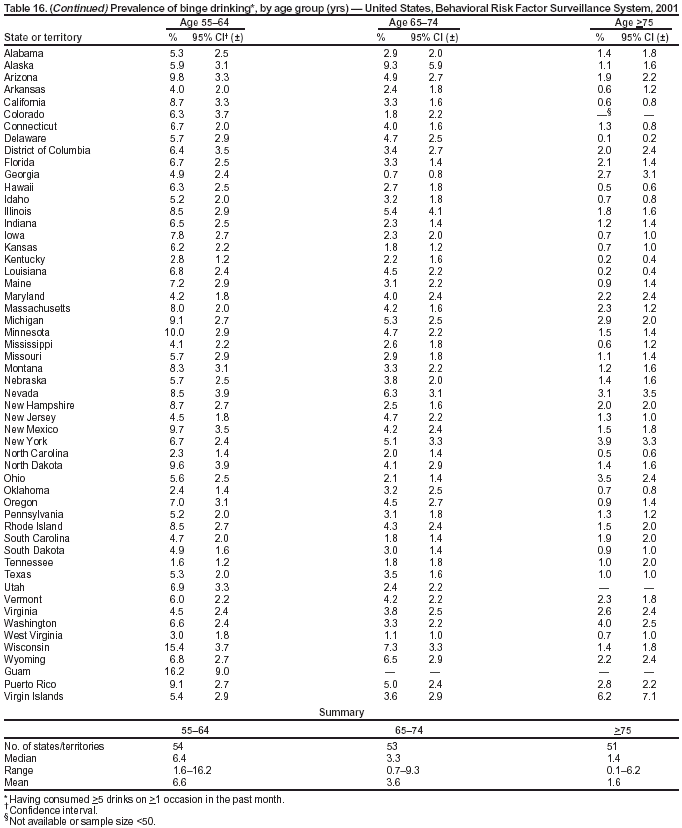 Table 17 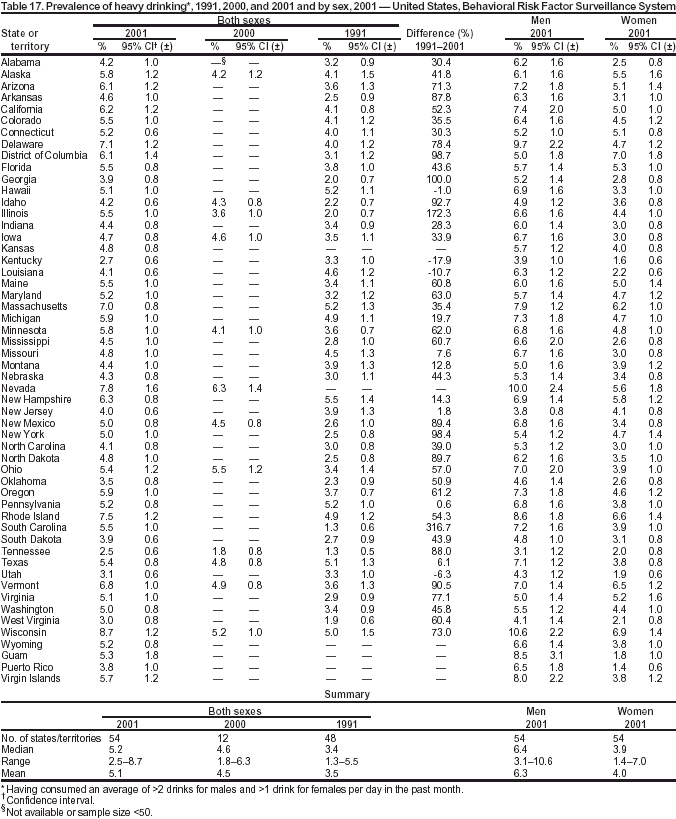 Return to top. Table 18 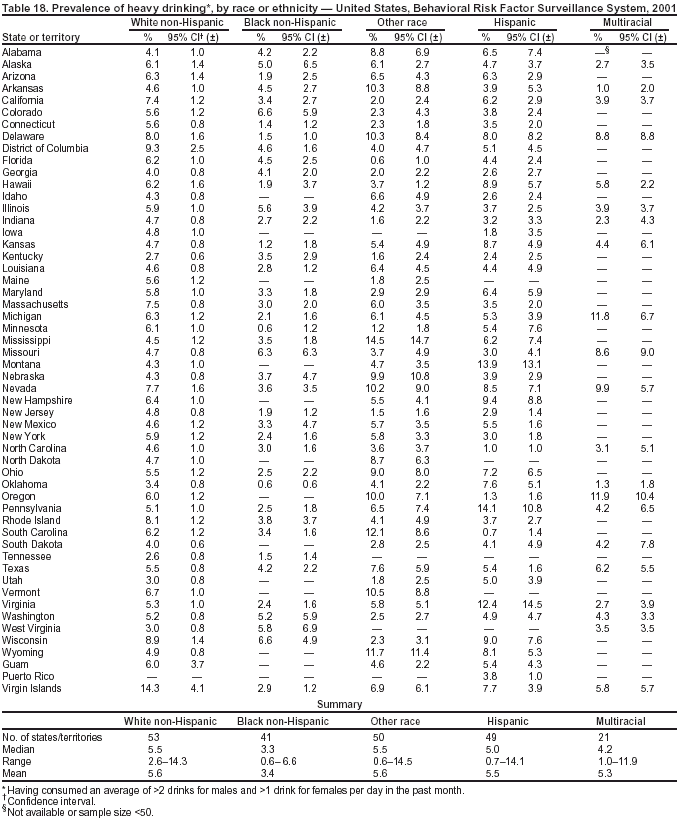 Return to top. Table 19 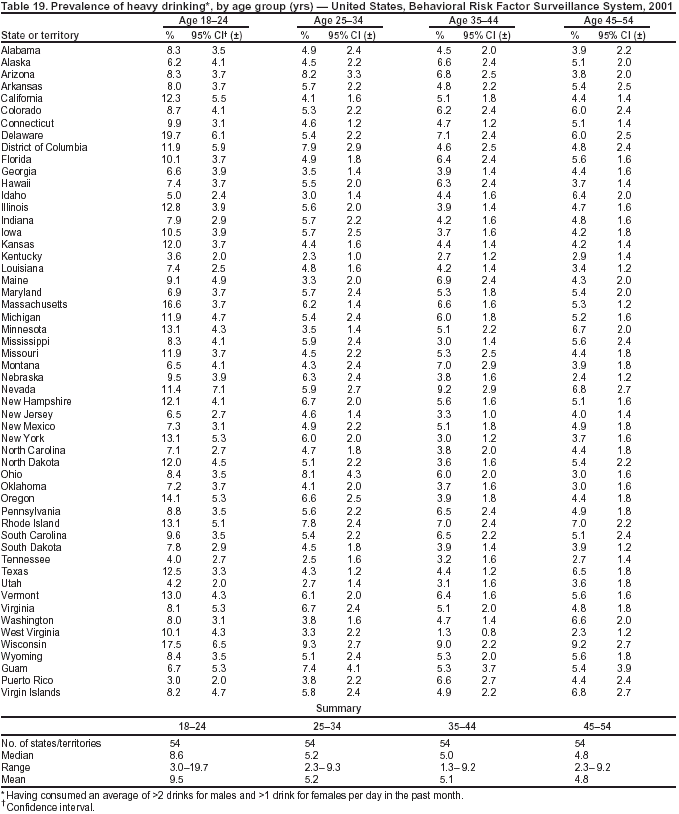 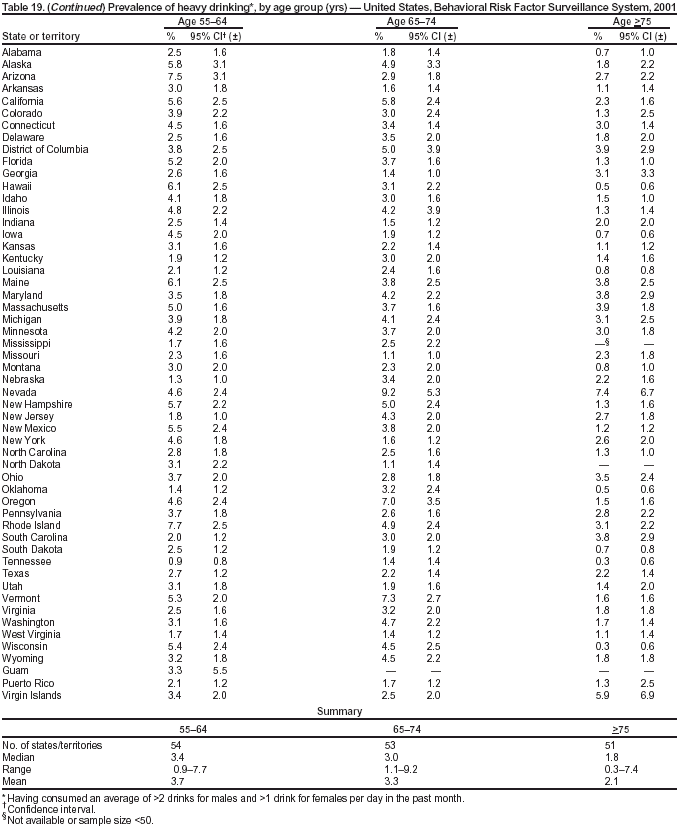 Table 20 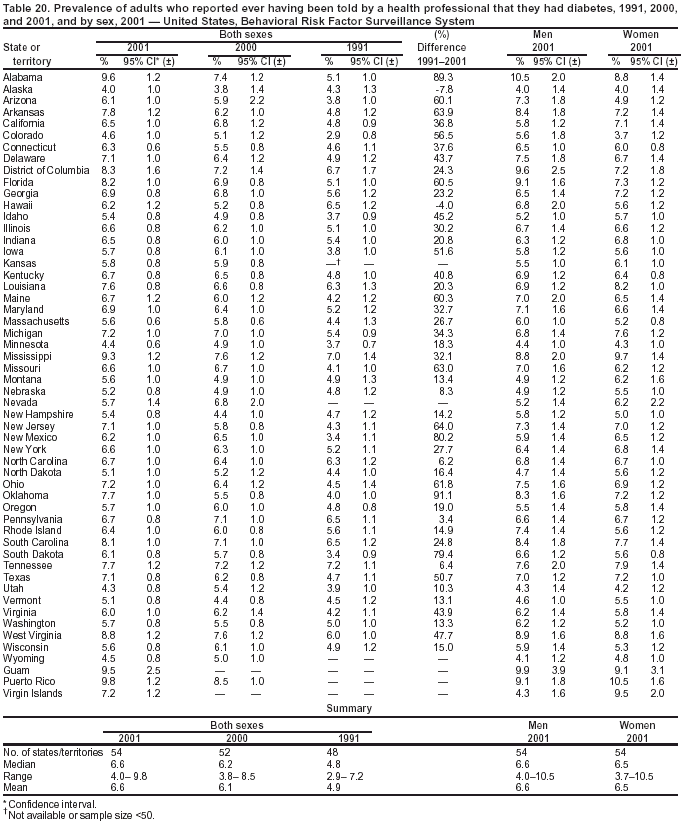 Return to top. Table 21 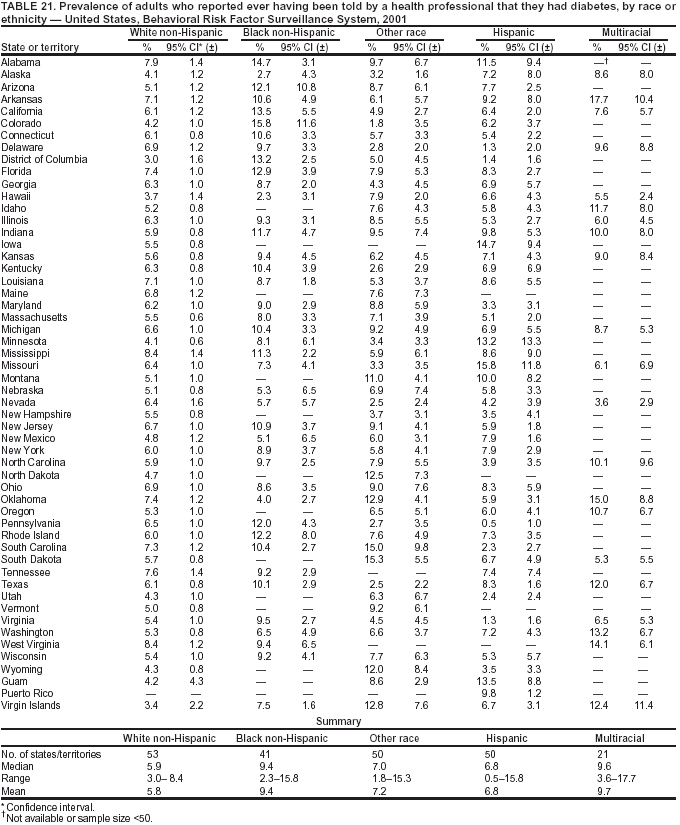 Return to top. Table 22 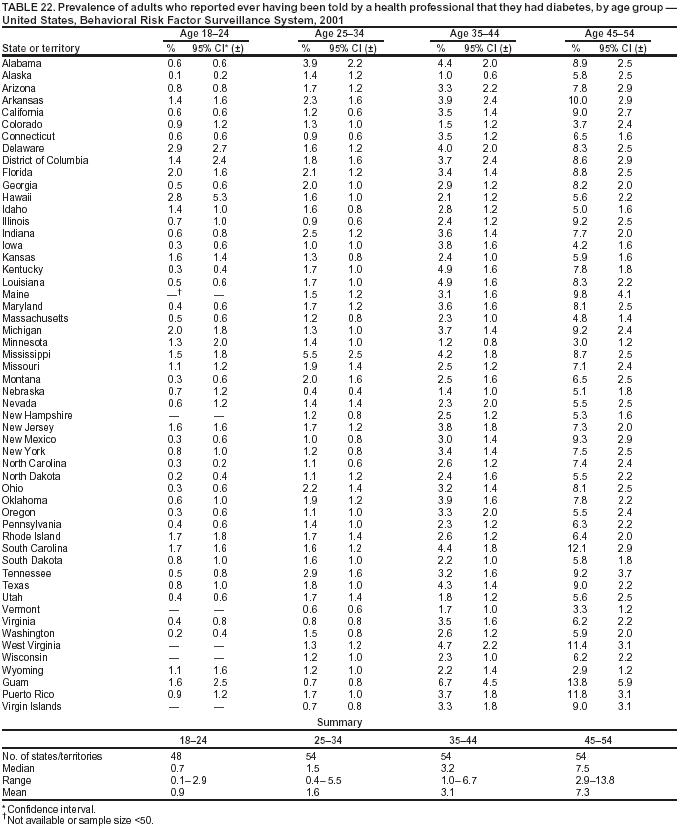 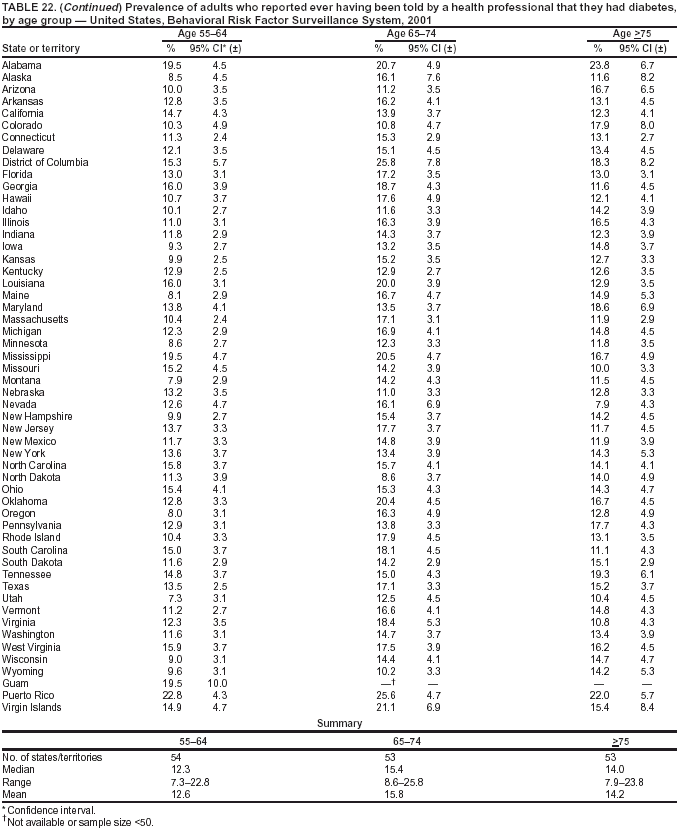 Table 23 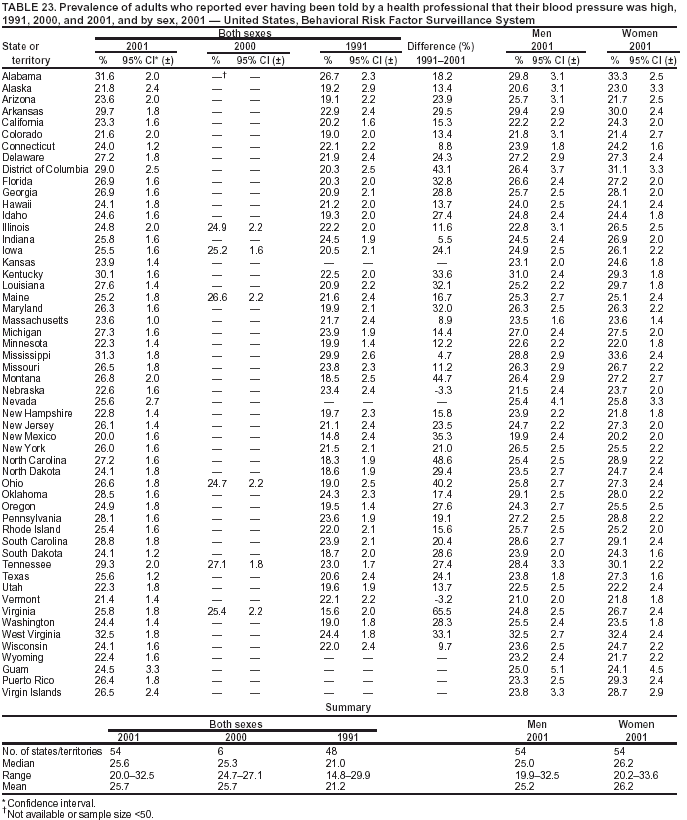 Return to top. Table 24 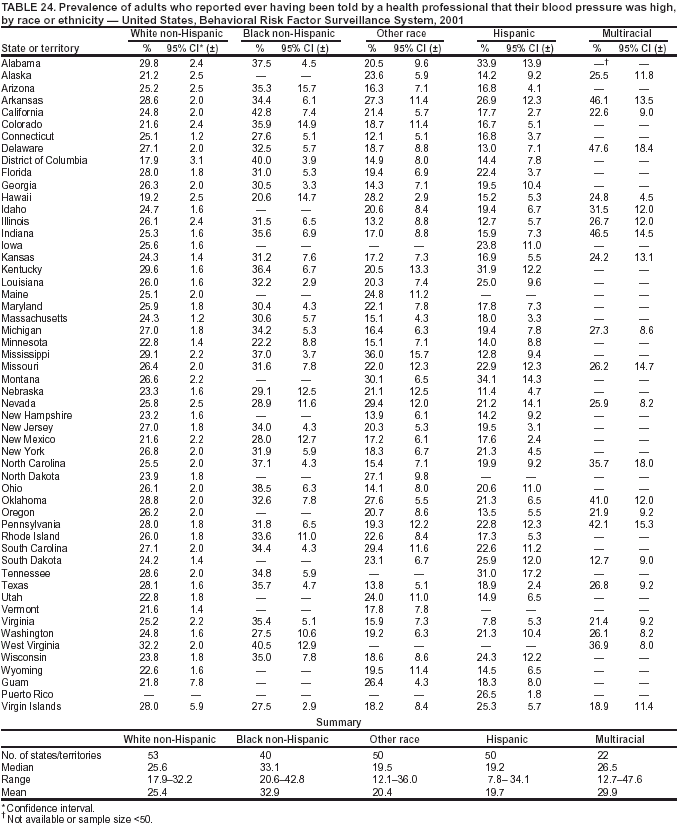 Return to top. Table 25 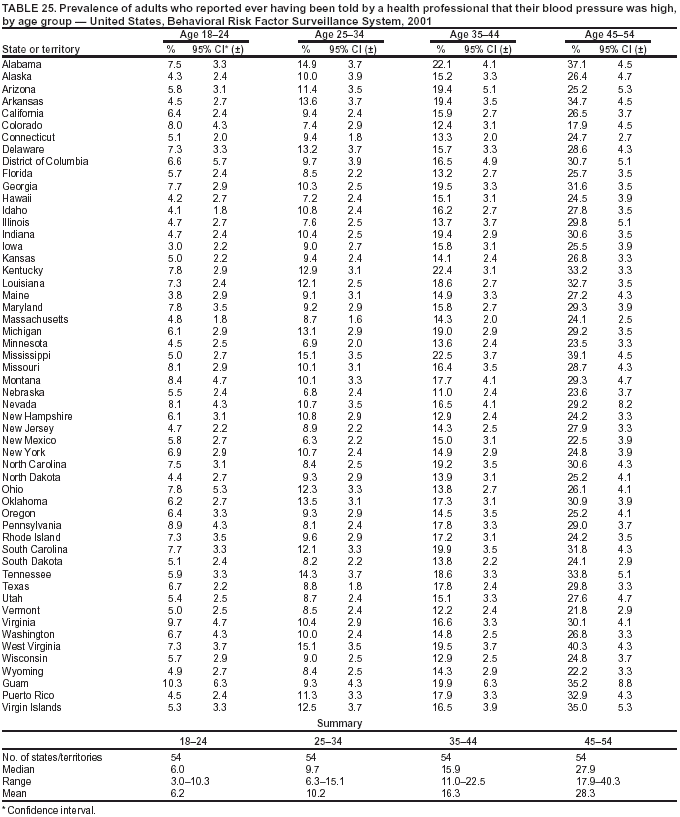 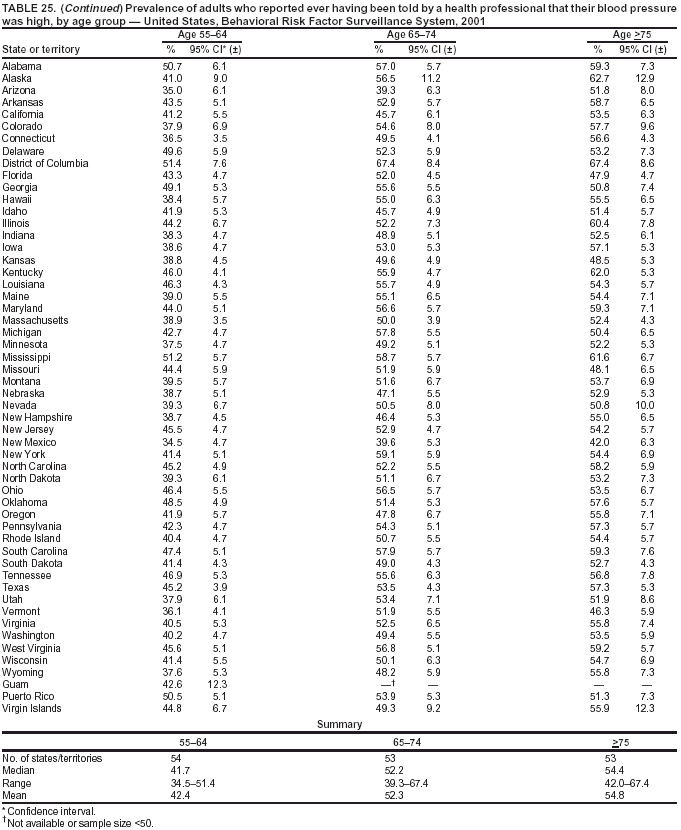 Table 26 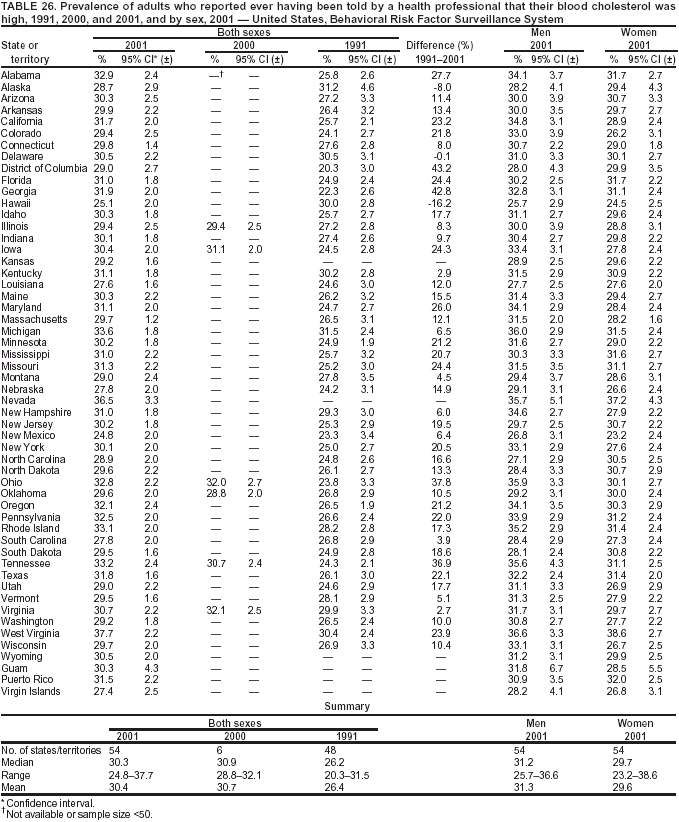 Return to top. Table 27 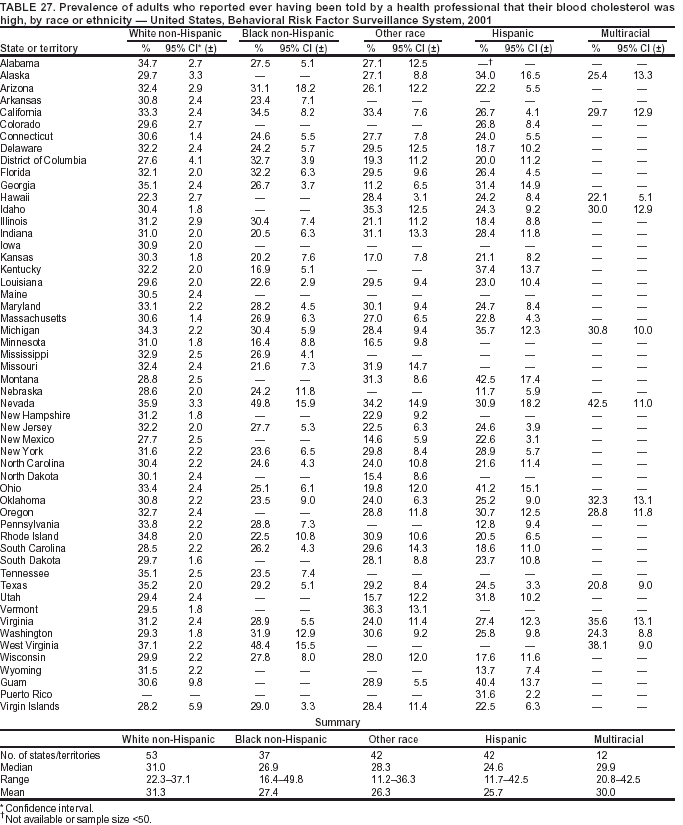 Return to top. Table 28 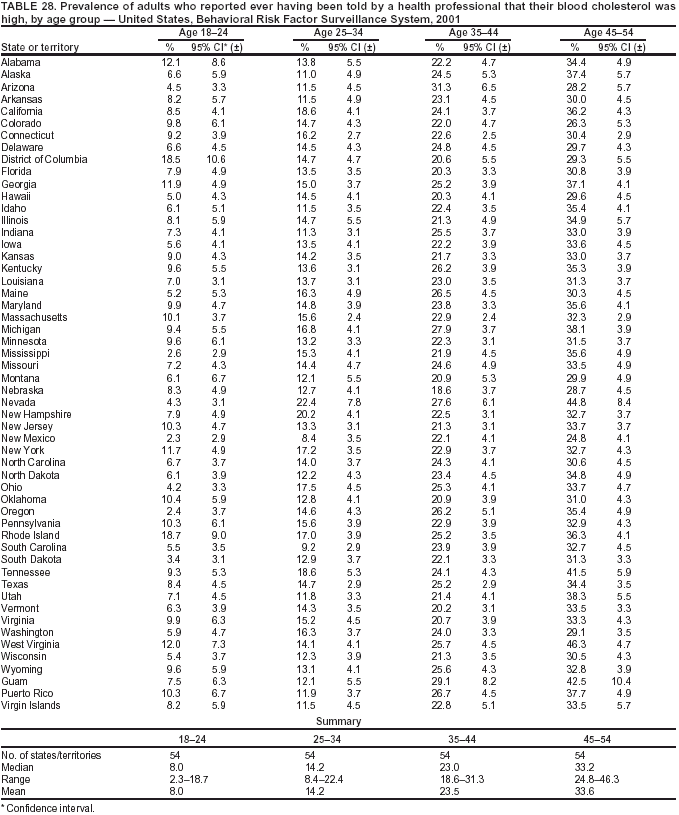 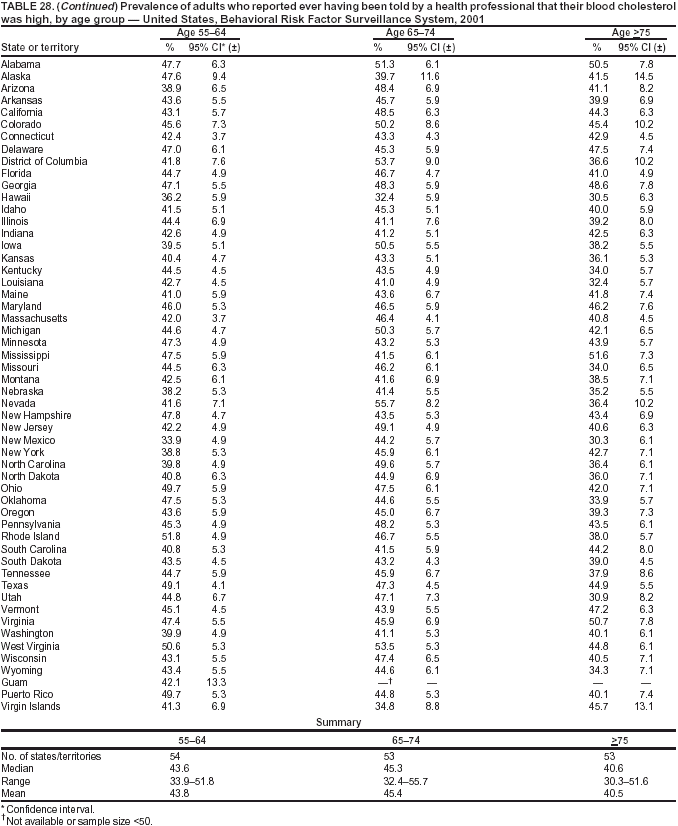 Table 29 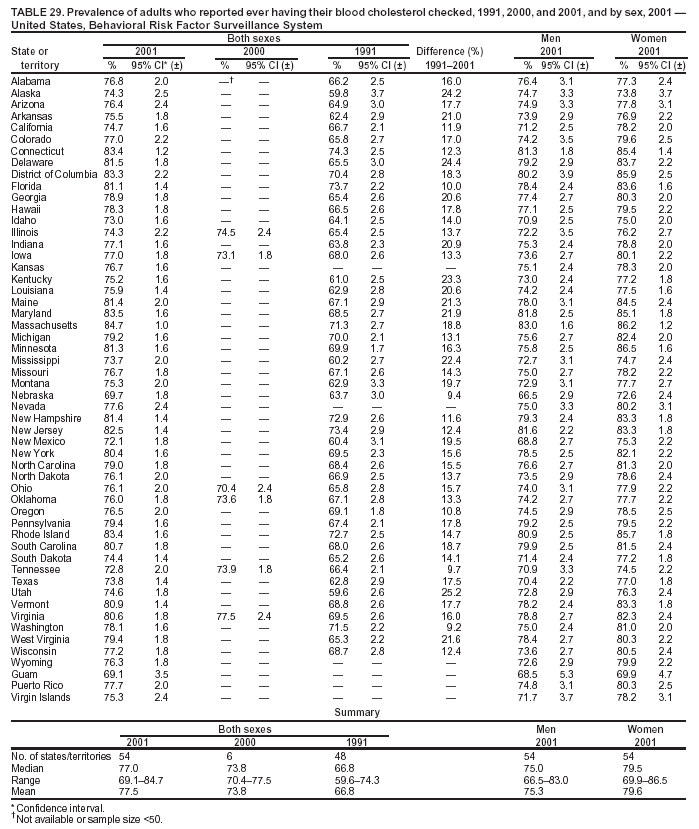 Return to top. Table 30 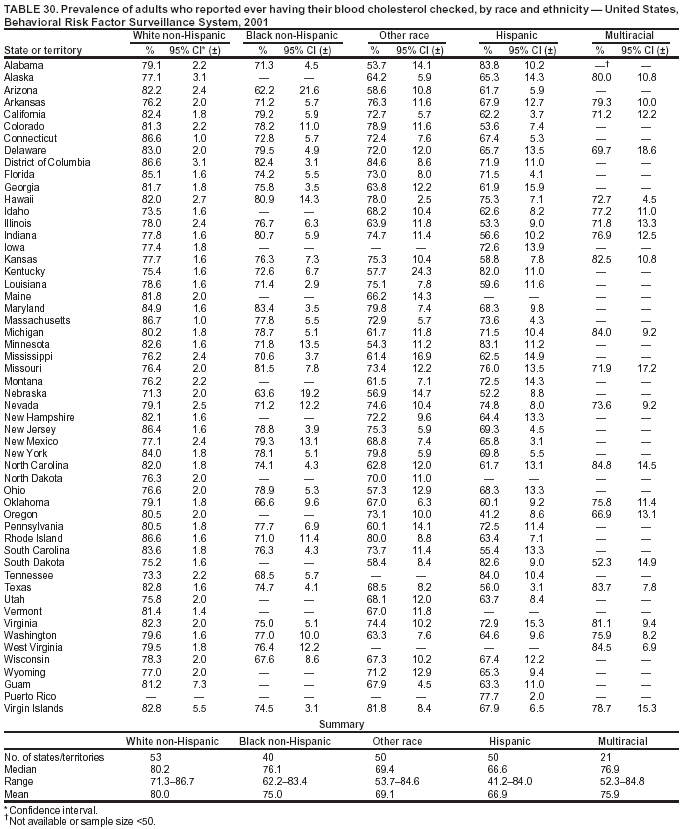 Return to top. Table 31 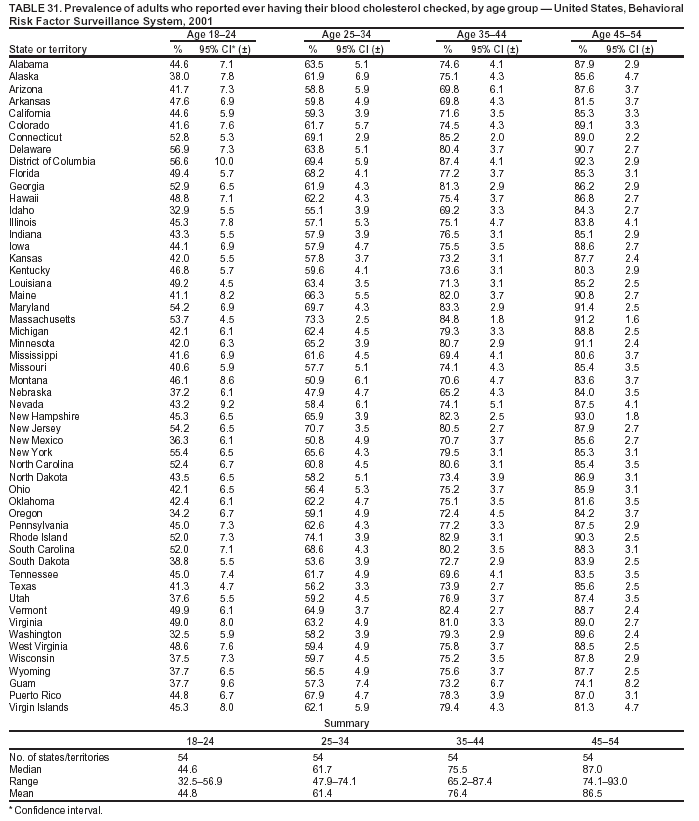 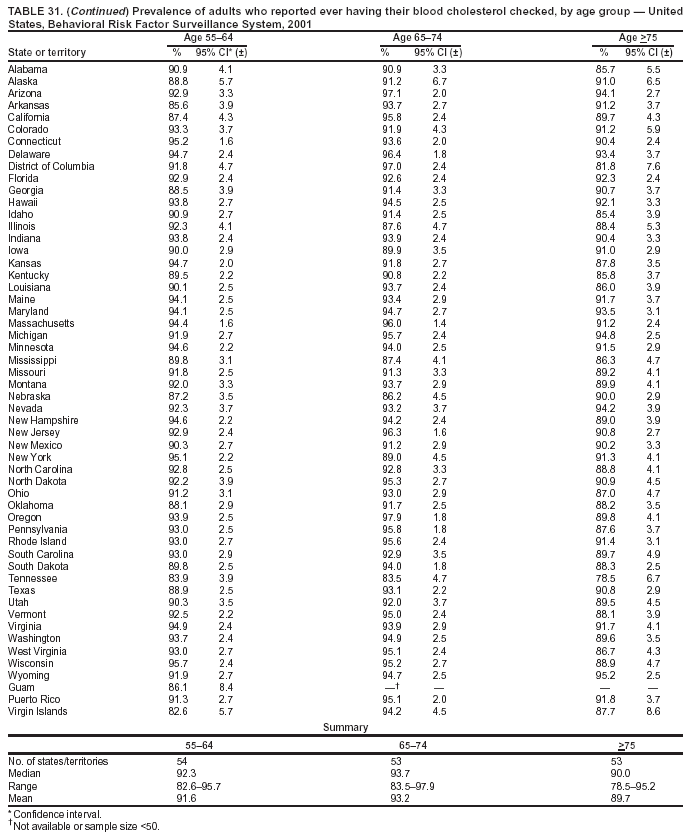 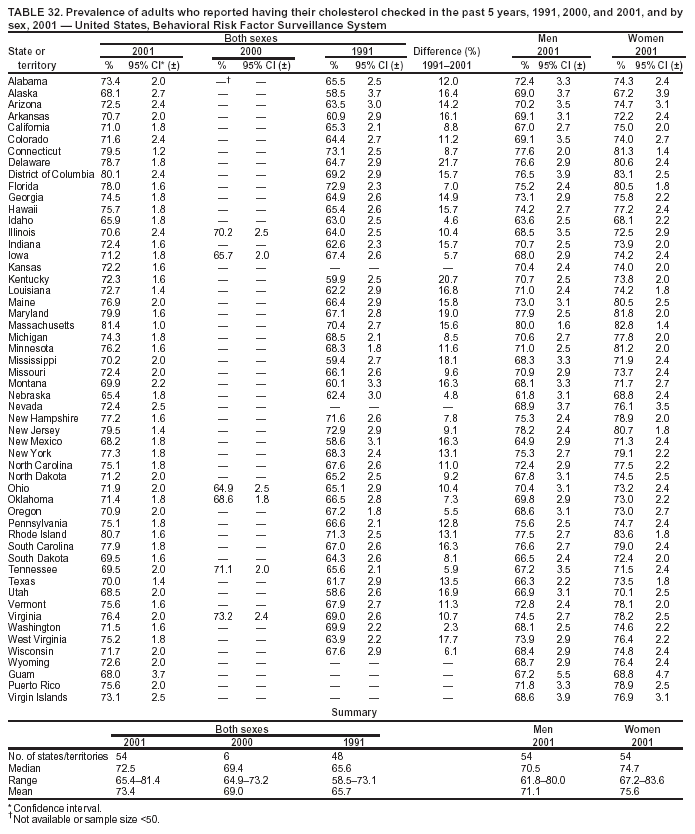 Return to top. Table 33 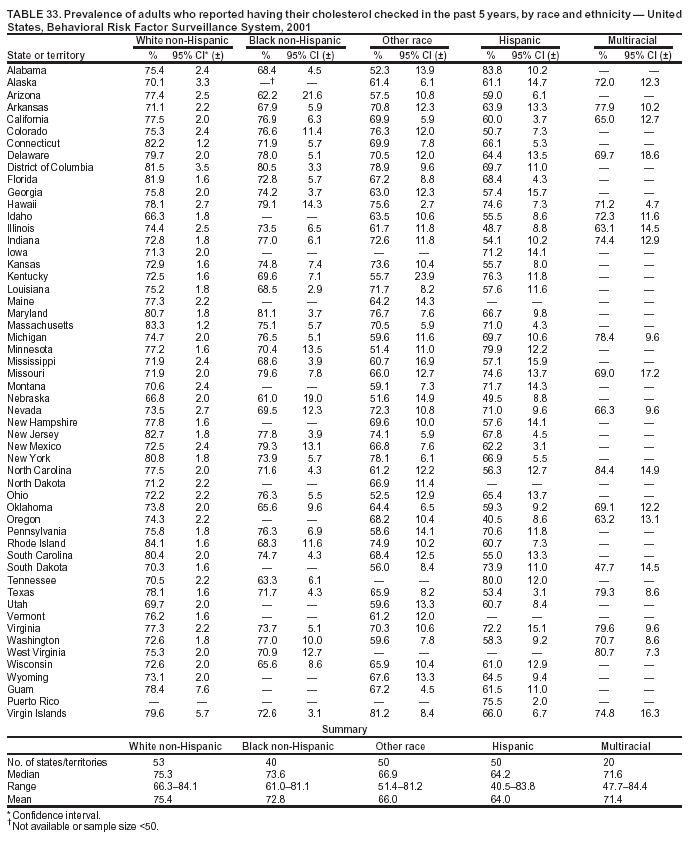 Return to top. Table 34 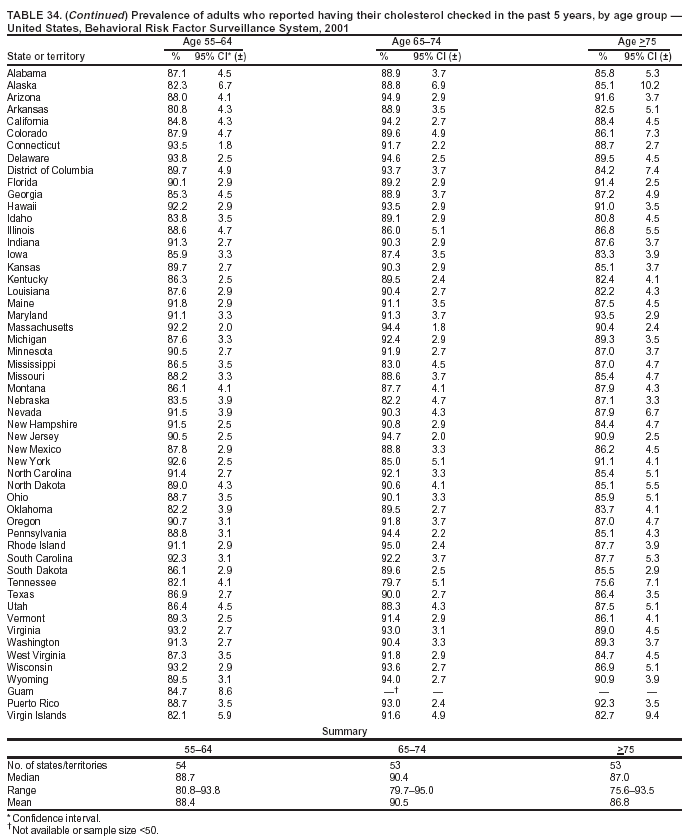 Table 35 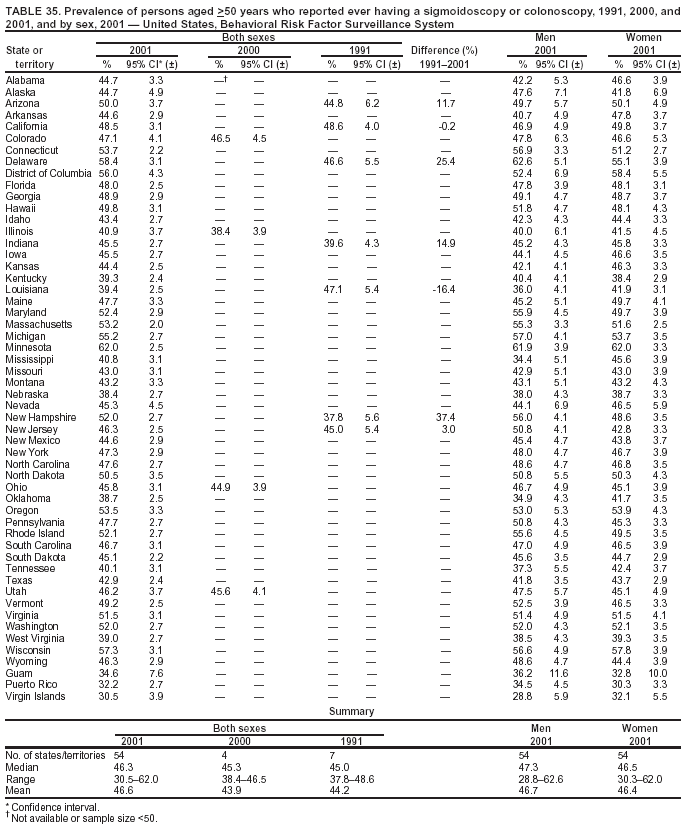 Return to top. Table 36 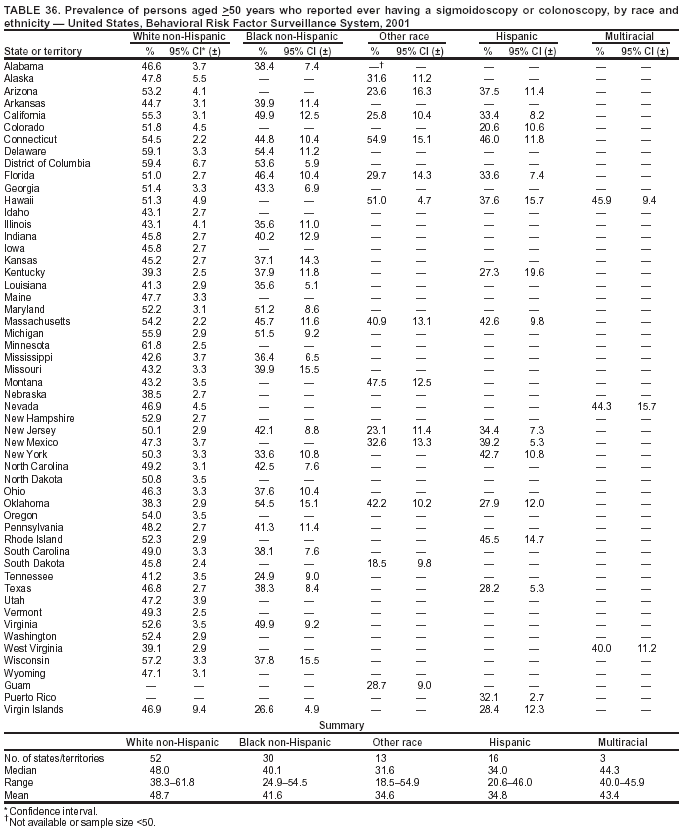 Return to top. Table 37 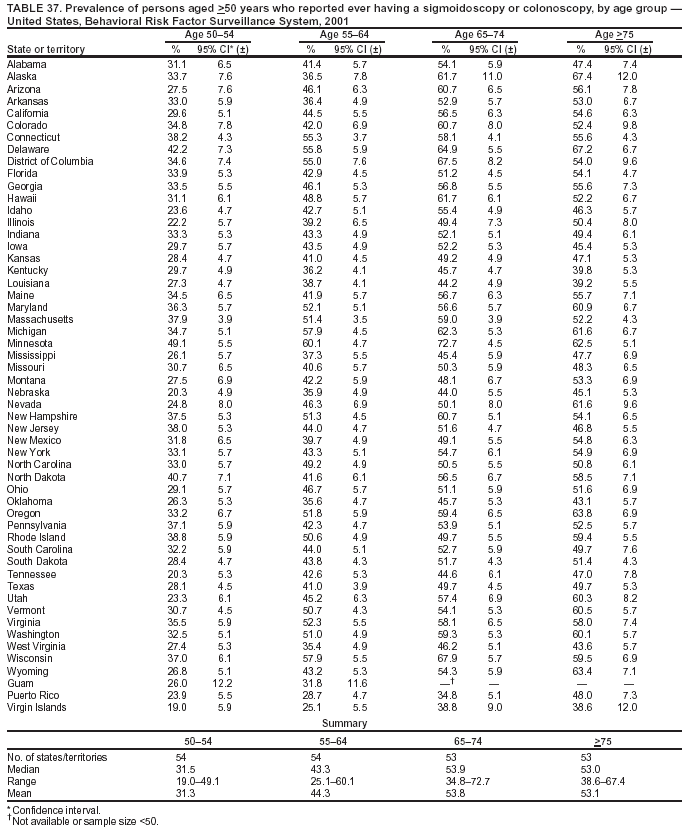 Return to top. Table 38 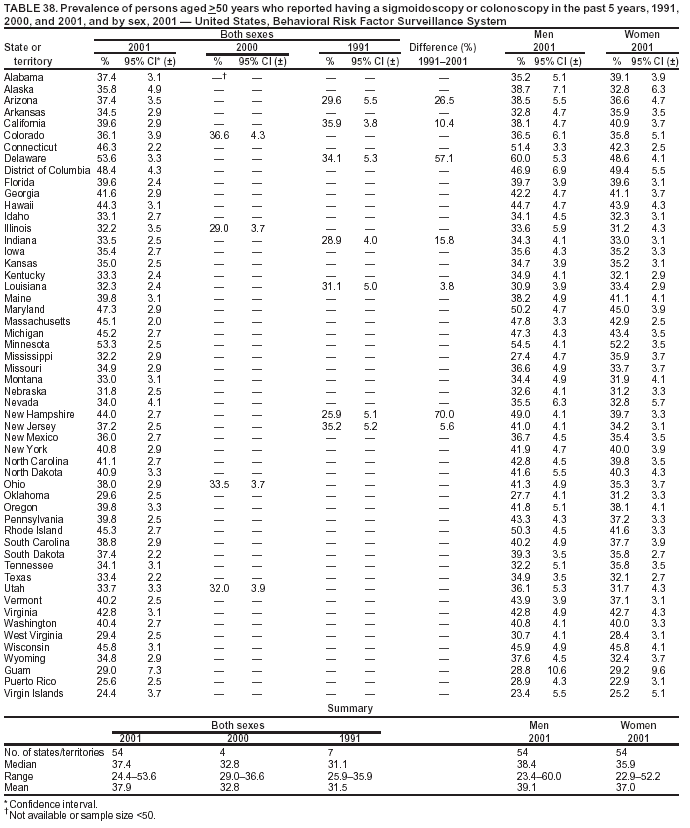 Return to top. Table 39  Return to top. Table 40 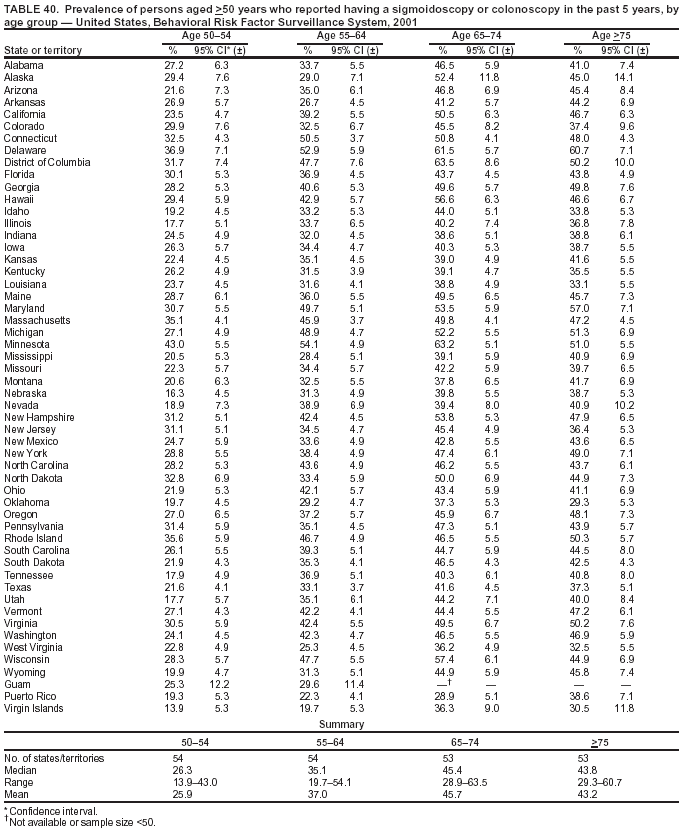 Return to top. Table 41 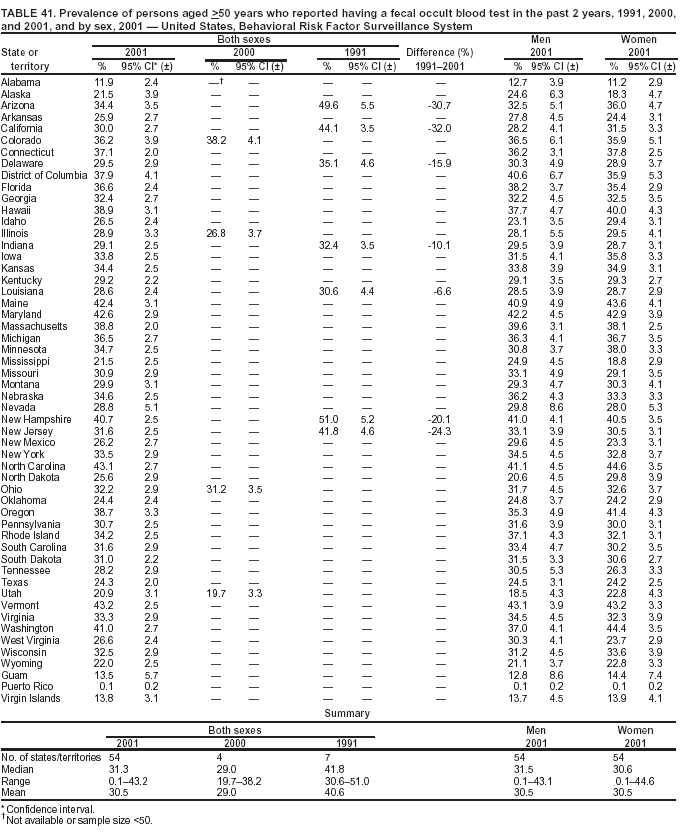 Return to top. Table 42 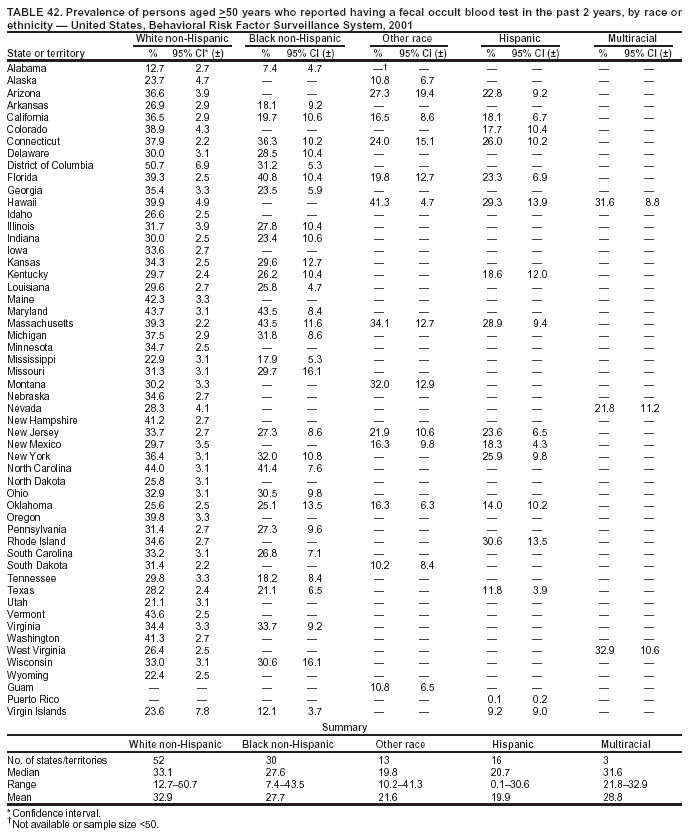 Return to top. Table 43 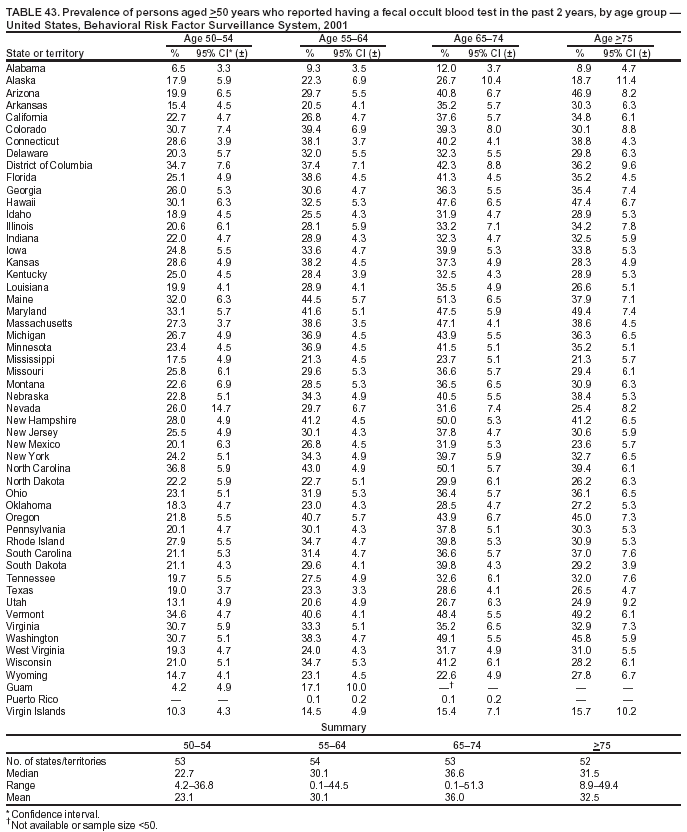 Return to top. Table 44 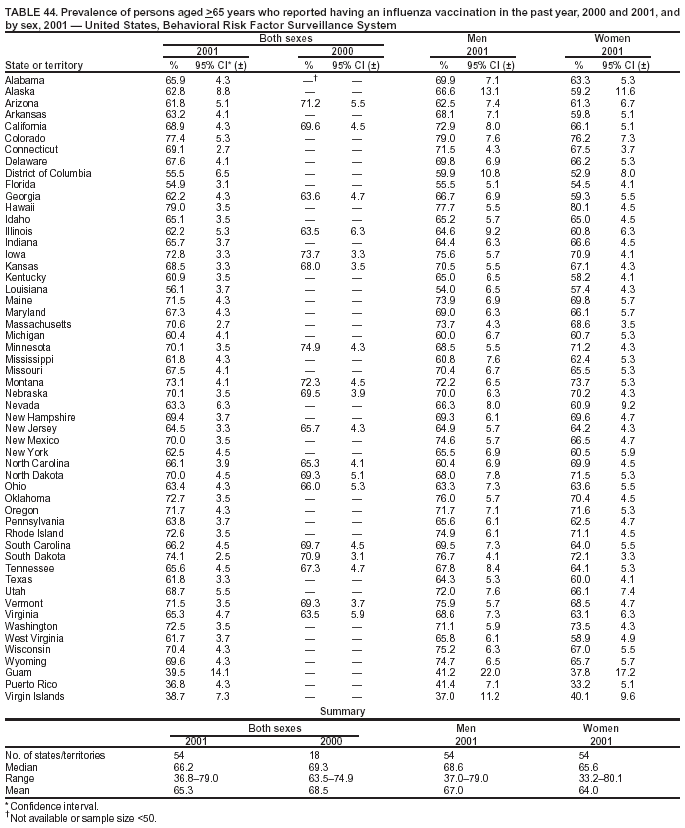 Return to top. Table 45 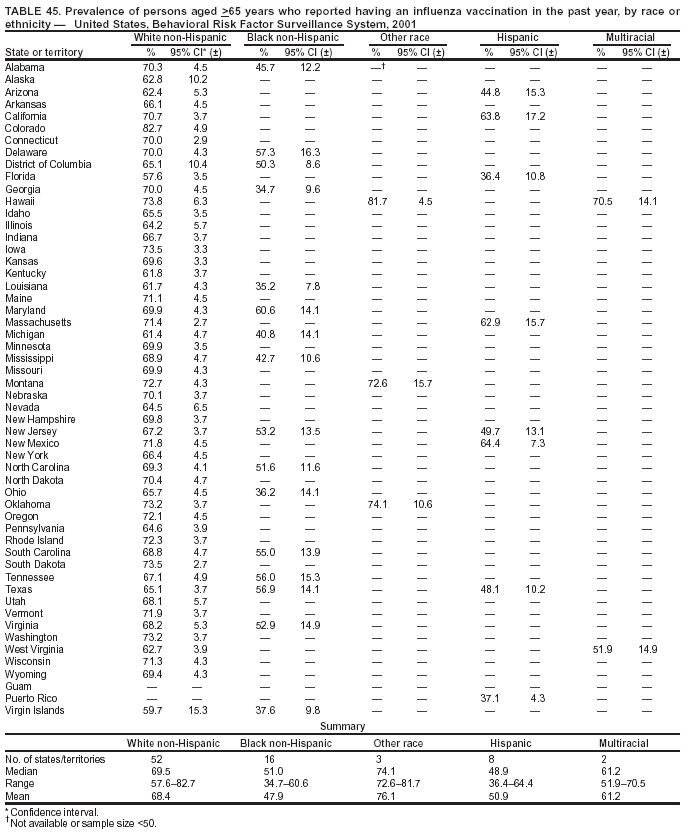 Return to top. Table 46 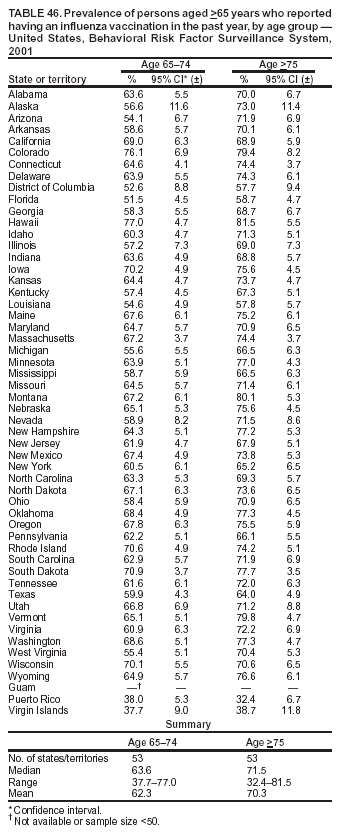 Return to top. Table 47 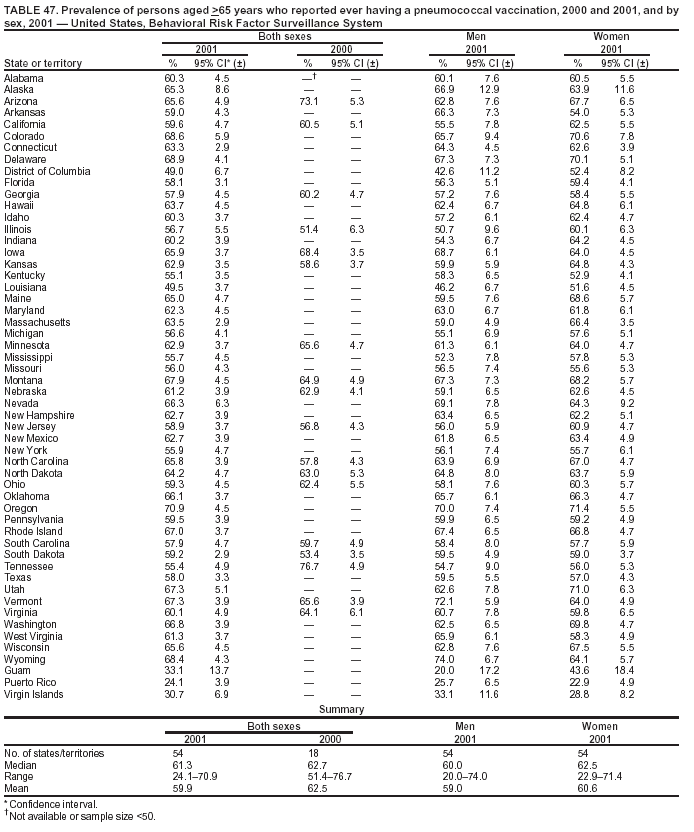 Return to top. Table 48 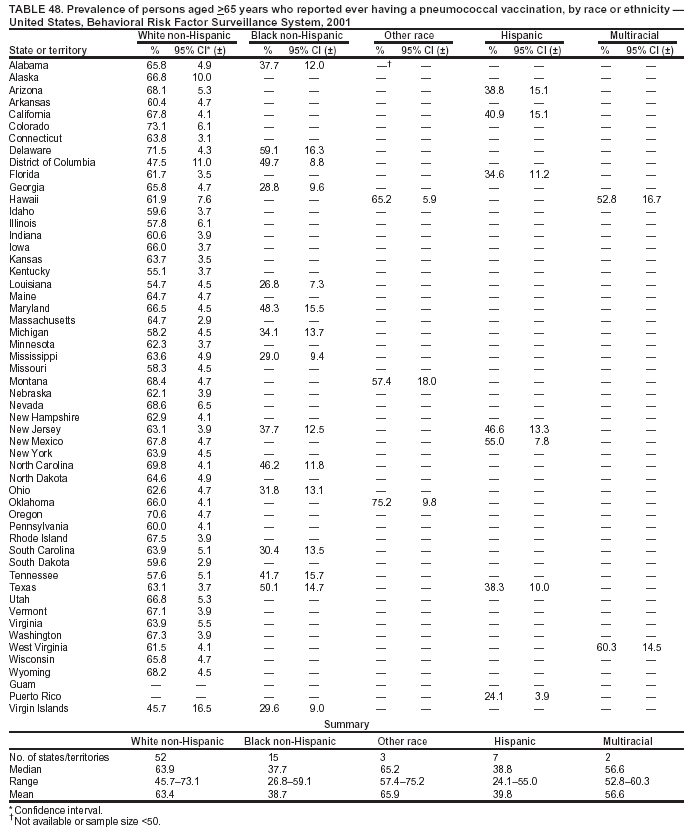 Return to top. Table 49 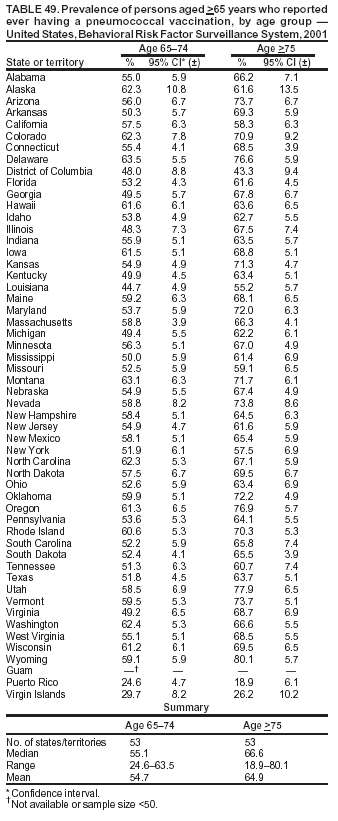 Return to top. Table 50 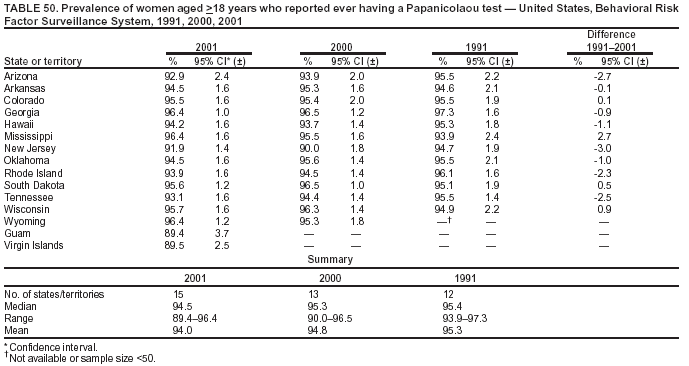 Return to top. Table 51  Return to top. Table 52 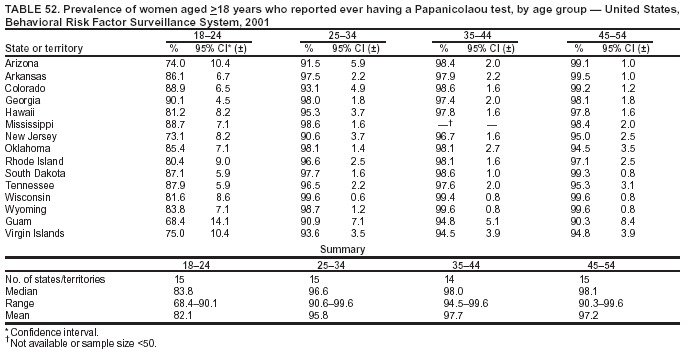 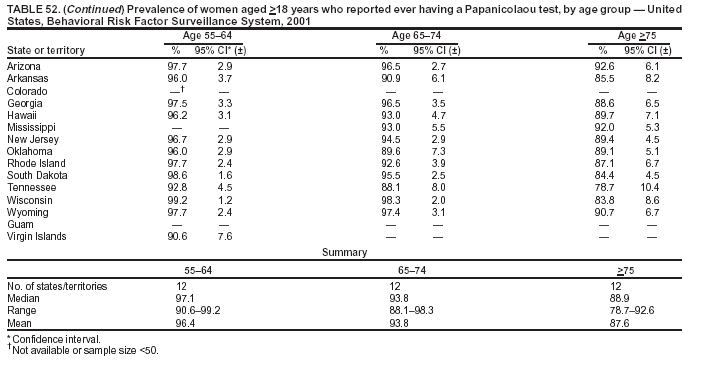 Table 53 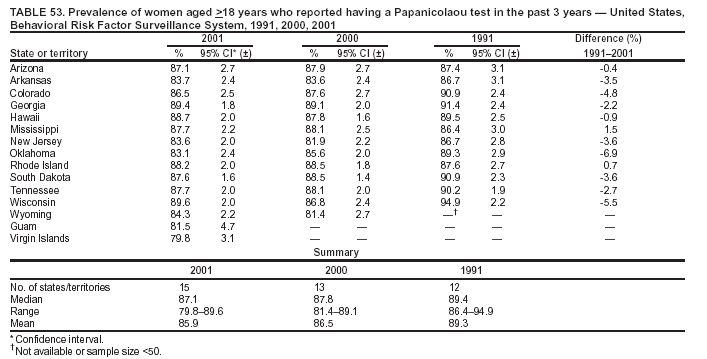 Return to top. Table 54 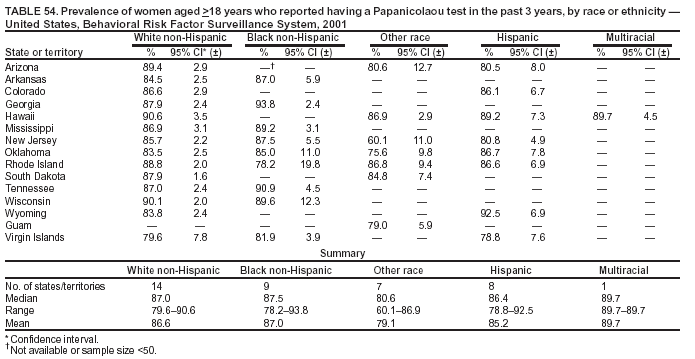 Return to top. Table 55 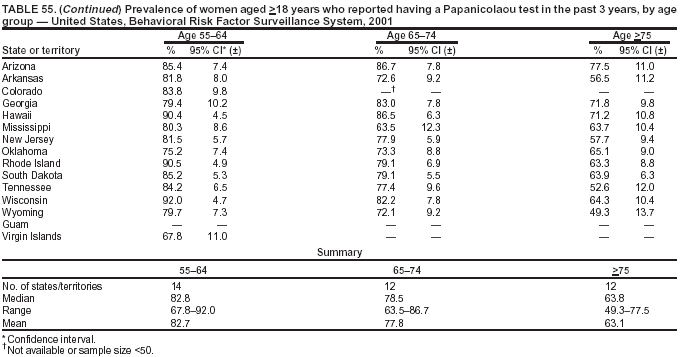 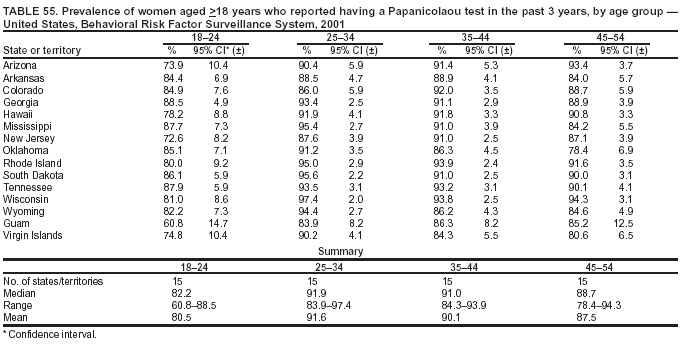 Table 56 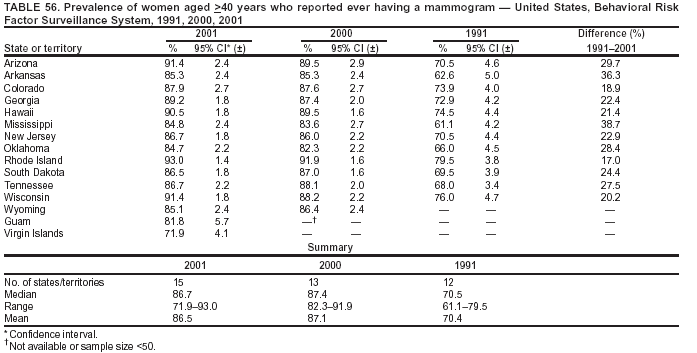 Return to top. Table 57 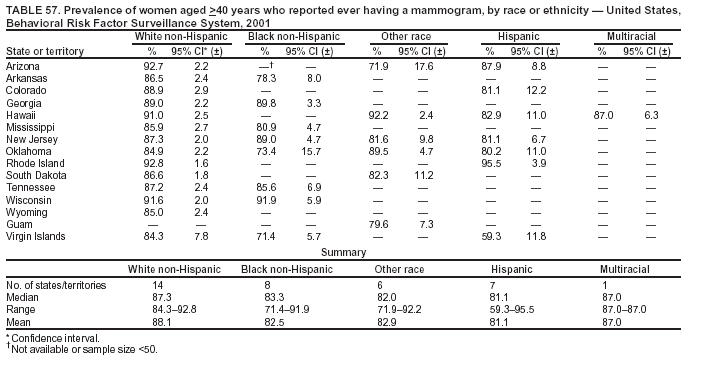 Return to top. Table 58 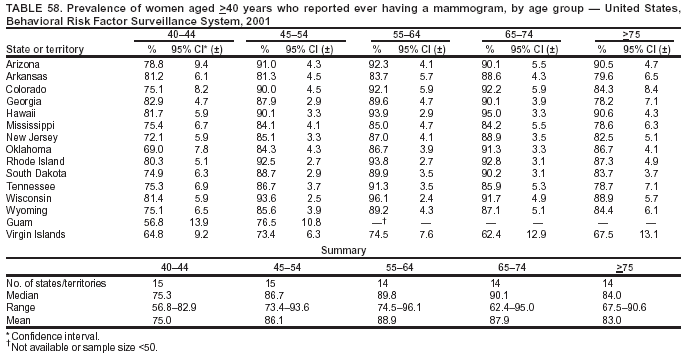 Return to top. Table 59 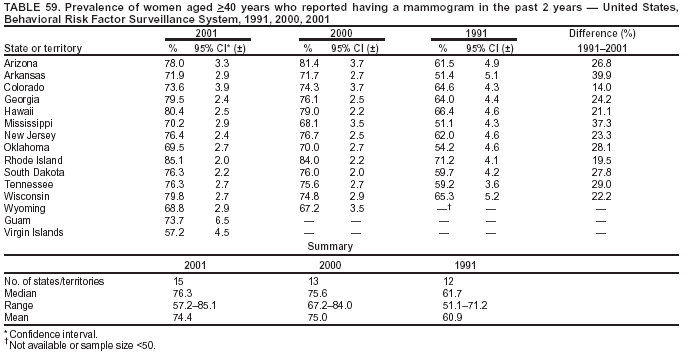 Return to top. Table 60 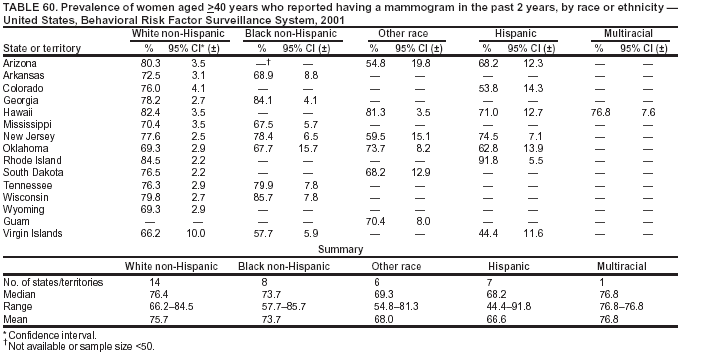 Return to top. Table 61 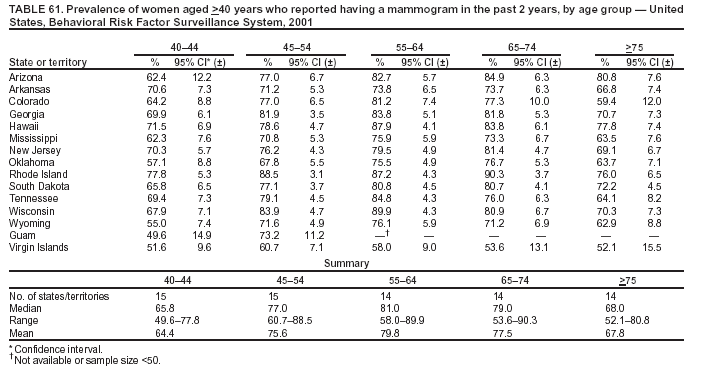 Return to top.
All MMWR HTML versions of articles are electronic conversions from ASCII text into HTML. This conversion may have resulted in character translation or format errors in the HTML version. Users should not rely on this HTML document, but are referred to the electronic PDF version and/or the original MMWR paper copy for the official text, figures, and tables. An original paper copy of this issue can be obtained from the Superintendent of Documents, U.S. Government Printing Office (GPO), Washington, DC 20402-9371; telephone: (202) 512-1800. Contact GPO for current prices. **Questions or messages regarding errors in formatting should be addressed to mmwrq@cdc.gov.Page converted: 8/13/2003 |
|||||||||
This page last reviewed 8/13/2003
|