 |
|
|
|
|
|
|
| ||||||||||
|
|
|
|
|
|
|
||||
| ||||||||||
|
|
|
|
|
Persons using assistive technology might not be able to fully access information in this file. For assistance, please send e-mail to: mmwrq@cdc.gov. Type 508 Accommodation and the title of the report in the subject line of e-mail. State-and Sex-Specific Prevalence of Selected Characteristics -- Behavioral Risk Factor Surveillance System, 1994 and 1995Eve Powell-Griner, Ph.D. John E. Anderson, Ph.D. Wilmon Murphy Coordinators for the Behavioral Risk Factor Surveillance System (Appendix A) Behavioral Surveillance Branch Division of Adult and Community Health National Center for Chronic Disease Prevention and Health Promotion Abstract Problem/Condition: High-risk behaviors (e.g., cigarette smoking, excessive alcohol consumption, and physical inactivity) and lack of preventive health care (e.g., screening for cancer) are associated with chronic disease- and injury-related morbidity and mortality. States use the Behavioral Risk Factor Surveillance System (BRFSS) to collect data about these modifiable health behaviors and to monitor trends and changes in the prevalence of behavioral risk factors in state populations. BRFSS data also are used to monitor progress toward the year 2000 national health objectives. Reporting Period: 1994 and 1995. Description of System: The BRFSS is a state-based telephone survey of the civilian, noninstitutionalized, adult (persons greater than or equal to 18 years of age) population. In 1994, 49 states and the District of Columbia participated in the BRFSS; in 1995, 50 states participated. Results: As in previous years, there were state-specific variations in the prevalences of high-risk behaviors, awareness of certain medical conditions, use of preventive health services, and health-care coverage. Selected findings for 1995 were that 22.4% of adults reported being current cigarette smokers (range: 13.2%-27.8%); the percentage of adults who reported driving after drinking too much alcohol ranged from 0.6% to 5.2% (median: 2.3%); and among adults aged greater than or equal to 65 years, 36.8% (range: 11.4%-46.6%) reported ever having had a pneumococcal vaccination and 59.2% (range: 44.2%-70.0%) reported having had an influenza vaccination within the past 1 year. Interpretation: State-specific variations in prevalence may reflect differences in population composition, socioeconomic factors, state laws enacted to discourage high-risk behaviors, levels of effort to screen for certain diseases and physiological conditions, and other factors. Action Taken: States continue to use the BRFSS to monitor risk factors associated with chronic disease- and injury-related morbidity and mortality and to develop public health programs and policies to address these problems. BRFSS data continue to be important in assessing progress toward national year 2000 and state health objectives. INTRODUCTION Behaviors such as cigarette smoking, excessive alcohol consumption, and physical inactivity are major contributors to chronic disease- and injury-related morbidity and mortality in the United States. Preventive health practices such as cholesterol screening, mammography, and proctoscopy can help identify early stages of chronic diseases (e.g., heart disease, breast cancer, and colorectal cancer), thereby reducing death rates from these leading causes of death among the U.S. adult population. Increasing the use of screening for chronic diseases and reducing high-risk behaviors are among the year 2000 national health objectives (1). The Behavioral Risk Factor Surveillance System (BRFSS) is a continuous, state-based surveillance system that collects information about modifiable risk factors for chronic diseases and other leading causes of death. This system is used to measure achievement toward both the national health objectives (1) and specific state objectives. This report, the latest in a series that summarizes yearly BRFSS data, presents state- and sex-specific data for 1994 and 1995 concerning a) risk factors for chronic diseases; b) risk factors for injury; c) awareness of certain medical conditions associated with increased risk for developing chronic diseases; d) screening practices related to cardiovascular diseases and cancer of the cervix, breast, and colon; e) vaccinations; and f) lack of health-care coverage (which is often a prerequisite for access to clinical preventive health services). The use, history, and rationale of the BRFSS have been previously described (2,3). In 1994, all states * except Rhode Island participated in the BRFSS, and in 1995, the District of Columbia did not participate (Appendix B). The data collected in 1994 and 1995 are presented separately; statistical comparisons between the 2 years of data were not made. METHODS Sampling Each state health department used random digit dialing to select samples of adults in households with telephones. The samples represented each state's civilian, non-institutionalized, adult (persons greater than or equal to 18 years of age) population. Most states used three-stage cluster sampling based on the Waksberg method (4); other states used simple random, stratified random, or other sampling designs. Questionnaire The 1994 and 1995 BRFSS questionnaires consisted of a) a core set of questions asked in all participating states, b) optional questions on selected topics developed by CDC and asked at the discretion of each state, c) questions developed and asked in a particular state to meet a specific need for information, d) a rotating set of core questions asked every other year, and e) questions addressing emerging health-care issues and requiring timely data collection. The rotating core question on leisure-time physical activity was asked by all participating states in 1994 but not in 1995. Rotating core questions asked in 1995 but not in 1994 were about alcohol use, safety belt use, drinking and driving, awareness of high blood pressure and high blood cholesterol, testing for blood cholesterol, colorectal cancer screening, and two kinds of vaccinations. From 1993 to 1994, the question on mammography was changed from "A mammogram is an X-ray of the breast to look for cancer. Have you ever had a mammogram?" to "A mammogram is an X-ray of each breast to look for breast cancer. Have you ever had a mammogram?" In California, modification of survey questions on chronic drinking and cancer screening resulted in data that are not comparable. Thus, in this report, the data from California are excluded from the tables on chronic drinking and cancer screening. Data Collection and Processing In each state, during the interview period in each month, BRFSS data were collected from randomly selected adults. The data were sent to CDC after the monthly interviewing cycle ended. CDC edited the data and checked the reliability of the data collected. A computer-assisted telephone interviewing (CATI) system, which permits direct entry of data into a computer file during an interview, was used in 44 states in 1994 and 47 states in 1995. CATI helps reduce errors in data collection by facilitating data coding, data entry, and the monitoring of interviewers. Data Weighting and Analysis CDC aggregated the edited monthly data files to create a yearly sample for each state. Each state's yearly data file was weighted to both the respondent's probability of selection and the age- and sex-specific or the race-, age-, and sex-specific population from the most current census data (or intercensal estimates) for each state (2,5). CDC used these weighted data to estimate the prevalence of risk factors for each state's population. SUDAAN, a software package for analyzing complex survey data, was used to calculate the standard errors and the 95% confidence intervals for the prevalence estimates (6). In 1994, the number of interviews completed in each state ranged from 1,259 to 4,439 (men: 499-1,844; women: 691-2,595). In 1995, the number of interviews completed ranged from 1,251 to 5,107 (men: 500-2,078; women: 693-3,029). State response rates for completed interviews ranged from 61.9% to 95.4% in 1994 and from 60.5% to 95.0% in 1995. RESULTS Risk Factors for Chronic Diseases Overweight A body mass index of greater than or equal to 27.8 kg/m2 for men and greater than or equal to 27.3 kg/m2 for women is considered overweight. These values approximate the sex-specific 85th percentile of body mass index estimated from the second National Health and Nutrition Examination Survey (NHANES II) for persons 20-29 years of age in the United States. In 1994, the prevalence of adults who reported being overweight ranged from 19.7% in Hawaii to 31.9% in Mississippi (median: 26.7%) (Table_1). In 1995, the prevalence of overweight adults ranged from 21.8% in Hawaii to 34.6% in Indiana (median: 28.6%). In both years, men were slightly more likely than women to report being overweight (1994: 28.4% vs. 25.1%; 1995: 30.6% vs. 26.4%). No Leisure-Time Physical Activity In 1994, the percentage of adults who did not engage in any leisure-time physical activity (i.e., no exercise, recreation, or physical activities {other than regular job duties} during the previous month) varied by states nearly threefold, from 17.2% Colorado to 48.6% in the District of Columbia (median: 28.8%) (Table_2). The median percentage of adults who reported no leisure-time physical activity was slightly lower for men (26.5%) than for women (30.6%). Alcohol Consumption Drinking Pattern I. In 1995, the percentage of adults who reported binge drinking (i.e., consumption of five or more alcoholic beverages on at least one occasion during the previous month {drinking pattern I}) varied more than fourfold among states (Table_3). This percentage ranged from 5.2% in Tennessee to 22.9% in Wisconsin (median: 13.9%). Approximately three times as many men as women reported binge drinking (21.3% vs. 6.9%). Drinking Pattern II. In 1995, the percentage of adults who reported chronic drinking (i.e., consumption of 60 or more alcoholic beverages during the previous month {drinking pattern II}) ranged from 1.2% in Oklahoma to 5.6% in Nevada (median: 2.8%) (Table_4). Men were almost seven times as likely as women to report chronic drinking (4.8% vs. 0.7%). Cigarette Smoking Smoking Among Adults. The prevalence of adults who reported being current cigarette smokers and having ever smoked at least 100 cigarettes varied twofold among states (Table_5). In 1994, the prevalence ranged from 15.0% in the District of Columbia to 29.1% in Nevada (median: 22.6%), and in 1995, it ranged from 13.2% in Utah to 27.8% in Kentucky (median: 22.4%). The median prevalence of smoking was slightly higher for men than for women in 1994 (23.8% vs. 21.6%) and in 1995 (24.7% vs. 20.9%). Smoking Among Young Adults. CDC's Office of Smoking and Health has used smoking prevalence among persons 20-24 years of age as an indicator of smoking initiation in the general U.S. population. Because sample sizes for this narrow age group were likely to be small at the state level, however, the age span of 18-29 years was used for this question in the BRFSS. In addition, data from states that participated in the BRFSS in both 1994 and 1995 were aggregated to compensate for the small sample sizes and large confidence intervals that could occur from 1 year of state data. The percentage of young adults who reported being current cigarette smokers and having ever smoked at least 100 cigarettes ranged from 15.2% in Utah to 32.7% in Ohio (median: 24.1%) (Table_6). The smoking rate was slightly higher for young men (25.1%) than for young women (23.3%). In 73% of states, the smoking rate for young adults was higher than that for all adults. Risk Factors for Personal Injury Safety Belt Use In 1995, the percentage of adults who reported that they always wore a safety belt while driving or riding in a car varied more than twofold among states (Table_7). The percentage ranged from 41.4% in North Dakota to 86.9% in Hawaii (median: 66.0%). The median prevalence was more than 15 percentage points lower for men than for women (58.2% vs. 73.5%). Drinking and Driving In 1995, the percentage of adults who reported operating a motor vehicle at least once in the previous month after drinking too much alcohol ranged from 0.6% in Kentucky to 5.2% in South Dakota (median: 2.3%) (Table_8). More than four times as many men as women reported this behavior (3.7% vs. 0.9%). Awareness of Certain Medical Conditions Hypertension In 1995, the percentage of adults who reported ever having been told by a health professional that they had high blood pressure varied from 18.5% in Minnesota to 29.8% in Mississippi (median: 22.0%) (Table_9). Slightly fewer men than women reported hypertension awareness (21.5% vs. 22.7%). Diabetes In 1994, the percentage of adults who reported ever having been told by a health professional that they had diabetes ranged from 2.5% in Montana to 5.9% in Missouri (median: 4.2%) (Table_10). In 1995, the percentage of diabetes awareness ranged from 2.7% in Alaska to 6.4% in Mississippi (median: 4.4%). In both years, men were slightly less likely than women to report diabetes awareness (1994: 4.0% vs. 4.4%; 1995: 4.1% vs. 4.7%). High Blood Cholesterol In 1995, the percentage of adults who reported ever having been told by a health professional that they had high blood cholesterol ranged from 15.0% in Utah to 27.2% in Illinois (median: 19.4%) (Table_11). Fewer men than women reported awareness of high blood cholesterol (18.1% vs. 20.4). Screening Cholesterol In 1995, the percentage of adults who reported ever having had their blood cholesterol tested ranged from 59.8% in Mississippi to 76.2% in Massachusetts (median: 68.9%) (Table_12). The median was lower for men than for women (66.9% vs. 72.0%). The percentage of adults who reported that they had had their blood cholesterol tested within the past 5 years varied from 55.1% in Mississippi to 72.9% in Massachusetts (median: 65.3%) in 1995 (Table_12). The median was lower for men than for women (62.5% vs. 68.2%). Cervical Cancer In 1994 and 1995, the percentage of women who had ever had a Papanicolaou (Pap) smear was greater than 86% in all states (Table_13). The percentage varied from 86.5% to 96.6% (median: 94.1%) in 1994 and from 88.5% to 97.4% (median: 93.6%) in 1995. In both years, the percentage of women who reported having had a Pap smear in the past 3 years was greater than 77% (Table_13). The percentage ranged from 77.6% to 90.7% (median: 84.9%) in 1994 and from 79.0% to 90.9% (median: 83.6%) in 1995. Breast Cancer Mammogram. In 1994, the percentage of women greater than or equal to 40 years of age who reported ever having had a mammogram varied from 69.7% to 86.7% (median: 79.6%) (Table_14). In 1995, the percentage varied from 72.4% to 90.4% (median: 81.8%). In 1994, 67.5% of women greater than or equal to 50 years of age reported that they had had a mammogram in the past 2 years (range: 54.2%-81.3%) (Table_14). In 1995, this value was 69.2% (range: 53.9%-81.3%). Clinical Breast Examination. In both 1994 and 1995, greater than 82% of women greater than or equal to 40 years of age reported ever having had a clinical breast examination (Table_15). In 1994, this percentage ranged from 82.5% to 94.8% (median: 89.7%); in 1995, the percentage varied from 82.1% to 95.5% (median: 89.9%). In 1994 and 1995, greater than 61% of women greater than or equal to 50 years of age reported that they had had a clinical breast examination in the past 2 years (Table_15). In 1994, the percentage ranged from 63.8% to 83.6% (median: 73.6%); in 1995, it ranged from 61.2% to 83.8% (median: 73.8%). Mammogram and Clinical Breast Examination. In 1994, the percentage of women greater than or equal to 40 years of age who had ever had both a mammogram and a clinical breast examination ranged from 63.7% to 82.9% (median: 75.1%) (Table_16). In 1995, this percentage ranged from 66.4% to 86.5% (median: 77.2%). In 1994, the combined use of mammography and clinical breast examination in the previous 2 years among women greater than or equal to 50 years of age varied from 48.4% to 76.0% (median: 62.1%) (Table_16). In 1995, this percentage ranged from 47.5% to 75.7% (median: 61.5%). Colorectal Cancer In 1995, the percentage of adults greater than or equal to 50 years of age who reported that they had ever had a proctoscopic examination ranged from 21.5% in Oklahoma to 50.7% in Minnesota (median: 37.1%) (Table_17). The rate was higher for men (41.9%) than for women (32.9%). Vaccination Pneumococcal Vaccination In 1995, the percentage of adults greater than or equal to 65 years of age who reported that they had ever had a pneumococcal vaccination ranged from 11.4% in New Jersey to 46.6% in Arizona (median: 36.8%) (Table_18). The percentage was slightly lower for men (35.3%) than for women (37.7%). Influenza Vaccination In 1995, the percentage of adults greater than or equal to 65 years of age who reported that they had had an influenza vaccination in the previous year ranged from 44.2% in Alabama to 70.0% in Utah (median: 59.2%) (Table_18). The value was about the same for men (59.6%) and women (59.2%). Lack of Health-Care Coverage In both 1994 and 1995, the percentage of adults 18-64 years of age who reported that they did not have any health-care coverage varied more than threefold (Figure_1) and (Figure_2). In 1994, the percentage varied from 7.0% to 24.7% (median: 14.8%), and in 1995, the percentage ranged from 6.8% to 24.4% (median: 13.9%). For both years, the greatest prevalence of uninsured persons 18-64 years of age was in the southern and western states. Men were slightly more likely than women to have no health insurance in 1994 (15.2% vs. 13.6%) and in 1995 (15.8% vs. 12.8%). DISCUSSION BRFSS data for 1984-1993 (7-13) and for this report have documented state-to-state variation in the prevalences of many health risk behaviors. State-specific variations may reflect differences in population composition (e.g., age, race or ethnicity, and sex), socioeconomic factors (e.g., per capita income, median number of years of education, and unemployment level), state laws enacted to discourage risky behaviors (e.g., driving under the influence of alcohol), levels of effort to screen for certain diseases and physiological conditions, and other factors. These variations illustrate the need for policy makers to use state-specific data when addressing health problems in each state. Estimates from the BRFSS may differ from those derived from the National Health Interview Survey (NHIS), NHANES, or other surveys because of differences in methodology or wording of questions. For example, the percentage of men and women who reported being overweight for the 1994 and 1995 BRFSS (approximately 27%) was lower than the estimated 34% obtained by direct measurements of height and weight from NHANES III, which was conducted between 1988 and 1991 (14). This difference may reflect at least two factors: first, overweight adults underreport their weight more often than do adults who are not overweight (15), and second, underreporting of weight is more common among women than among men (15). In the BRFSS, women were less likely than men to have reported being overweight, whereas in NHANES III, more women than men were overweight (35% and 32%, respectively) (14). Because BRFSS data are self-reported, they may underestimate the true prevalence of overweight adults in the United States. Measuring the prevalence of physical activity historically has been limited by the lack of data about work-related physical activity. Examination of leisure-time physical activity only and exclusion of work and household activity may underestimate total physical activity (16). Thus, the BRFSS data about lack of leisure-time physical activity probably underestimate total physical activity among adults in the United States. In 1994 and 1995, the percentage of adults reporting binge or chronic drinking varied by both state and sex. Other studies also have demonstrated region- and sex-specific variations in the prevalences of these drinking patterns (17,18). The BRFSS data correspond closely with results from a study on per capita alcohol consumption estimated from alcohol sales data (19). Adults living in states with the highest rates of alcohol consumption were most likely to drive after drinking too much alcohol. The 1995 BRFSS median prevalence of adults who currently smoke cigarettes (22.4%) correlate closely with the 1993 NHIS estimate of 25% (20). The 1991 NHIS estimate that 22.9% of young adults 20-24 years of age were current smokers (21) also was similar to the BRFSS 1994-1995 aggregate estimate that 24.1% of young adults 18-29 years of age were current smokers. The highest prevalence of safety belt use was reported in states having safety-belt-use laws that permit primary enforcement. Primary enforcement allows a police officer to stop a driver for an observed violation of a safety-belt-use law only. Secondary enforcement requires a police officer to first stop the driver for another violation. Primary enforcement laws are associated with more frequent safety belt use than are secondary enforcement laws (22). Data about self-reported awareness of certain medical conditions (e.g., hypertension, diabetes, and high blood cholesterol) provide health-care providers and educators estimates of the number of adults who know about their medical condition. However, awareness does not indicate that these conditions are being treated or controlled, nor does it reflect the prevalence of risk factors for these conditions. These self-reported BRFSS estimates are likely lower than the true prevalence of these medical conditions, because many persons may be unaware that they have such medical problems (23). The BRFSS estimates of the percentage of uninsured adults 18-64 years of age were slightly lower than those reported from the March 1993 Current Population Survey (24). The Current Population Survey includes persons in households without telephones. Persons without telephones in the household tend to be poorer and less educated than persons in households with telephones (25). These persons also may be less likely to have health insurance (25). Thus, that BRFSS data are collected only from persons in households with telephones may be reflected by the lower percentage of uninsured adults in the BRFSS than in the Current Population Survey. States can use BRFSS data about health insurance coverage to identify the sociodemographic characteristics of persons who do not have coverage and to compare the prevalence of health risk behaviors and the use of preventive health services among the insured and uninsured (25). For example, lack of mammography use is associated with lack of health insurance (25). This information also can be used by managed-care organizations in determining the best options for state populations and by policy makers in evaluating health-care reforms at the state level. Interpretation of the differences in self-reported behaviors and use of medical ser-vices in 1994 and 1995 are subject to the constraint that they are based only on 2 years of state data. The apparent decreases or increases may reflect changes in the true prevalence of the population sampled. However, these changes could be artifactual because of several factors, including wording changes in the questions on mammography, shifts in the demographic composition of the sample population between 1994 and 1995, differences resulting from under- or overreporting of certain factors, and sampling and nonresponse errors. The extent of these possible effects is probably limited, but the effects can be assessed only after data from subsequent years are collected and analyzed. The BRFSS can provide the basis for developing or evaluating public health programs or policies designed to reduce the prevalence of health risk factors. For example, BRFSS data for Oregon have been published to help the state government and county and regional organizations set health program and budget priorities (26), and the Alaska Department of Health and Social Services has used state BRFSS data to formulate intervention strategies, justify resources supporting these strategies, and propose new policies or legislation (27). BRFSS data also can assist in evaluating progress toward national year 2000 and state health objectives. Table_1 Note: To print large tables and graphs users may have to change their printer settings to landscape and use a small font size.
TABLE 1. Percentage of adults who reported being overweight,* by sex -- Behavioral Risk Factor Surveillance System, 1994 and 1995
================================================================================================================================================================
                                                     1994                                                               1995
                        -----------------------------------------------------------------  ---------------------------------------------------------------------
                               Men                  Women                  Total                  Men                  Women                  Total
                        -------------------   --------------------   --------------------  -------------------   ------------------   --------------------------
State                      %   (+/-95% CI +)      %   (+/-95% CI)        %   (+/-95% CI)      %    (+/-95% CI)       %   (+/-95% CI)        %   (+/-95% CI)
----------------------------------------------------------------------------------------------------------------------------------------------------------------
Alabama                 30.3          (4.0)    29.9         (2.9)     30.1         (2.4)   34.3          (3.9)    29.7         (3.0)     31.8         (2.3)
Alaska                  29.7          (4.9)    26.4         (4.4)     28.2         (3.3)   31.1          (5.0)    31.6         (4.6)     31.3         (3.4)
Arizona                 27.3          (4.7)    19.2         (2.9)     23.2         (2.9)   26.5          (4.4)    22.6         (3.4)     24.5         (2.7)
Arkansas                33.3          (4.2)    26.4         (2.9)     29.6         (2.5)   33.3          (4.0)    27.3         (2.9)     30.1         (2.4)
California              27.4          (2.4)    22.7         (1.9)     25.1         (1.5)   29.3          (3.4)    23.6         (2.3)     26.4         (2.1)
Colorado                22.4          (3.4)    17.5         (2.5)     19.9         (2.1)   22.1          (3.3)    21.7         (2.7)     21.9         (2.1)
Connecticut             29.2          (3.8)    19.2         (2.5)     23.9         (2.3)   27.8          (3.7)    21.9         (2.8)     24.7         (2.3)
Delaware                28.1          (3.3)    25.6         (2.6)     26.8         (2.1)   29.1          (3.4)    29.8         (2.8)     29.5         (2.2)
District of Columbia    18.3          (3.5)    30.3         (3.7)     24.8         (2.6)
Florida                 25.8          (2.4)    22.9         (2.1)     24.3         (1.6)   31.8          (2.7)    28.0         (2.3)     29.8         (1.8)
Georgia                 25.1          (3.2)    26.9         (2.7)     26.0         (2.1)   33.7          (3.3)    23.2         (2.5)     28.2         (2.1)
Hawaii                  22.5          (3.2)    16.9         (2.6)     19.7         (2.1)   24.2          (3.3)    19.5         (2.8)     21.8         (2.1)
Idaho                   28.4          (3.7)    28.7         (3.2)     28.5         (2.4)   28.6          (2.9)    25.8         (2.4)     27.2         (1.8)
Illinois                29.9          (3.6)    26.1         (2.6)     27.9         (2.2)   32.1          (3.0)    28.3         (2.4)     30.1         (1.9)
Indiana                 30.0          (3.1)    29.1         (2.6)     29.6         (1.9)   36.0          (3.0)    33.4         (2.7)     34.6         (1.9)
Iowa                    29.8          (2.9)    27.1         (2.6)     28.4         (1.9)   32.5          (2.6)    30.7         (2.1)     31.6         (1.7)
Kansas                  28.0          (4.0)    18.0         (2.8)     22.8         (2.4)   31.0          (3.3)    24.9         (2.7)     27.8         (2.1)
Kentucky                30.0          (3.4)    28.1         (2.5)     29.0         (2.1)   31.3          (3.4)    26.5         (2.5)     28.8         (2.1)
Louisiana               26.5          (4.0)    30.2         (3.2)     28.4         (2.6)   31.1          (4.1)    30.4         (3.0)     30.7         (2.5)
Maine                   29.4          (4.1)    25.5         (3.6)     27.4         (2.7)   29.1          (4.4)    25.0         (3.5)     26.9         (2.8)
Maryland                28.4          (2.2)    25.9         (1.9)     27.1         (1.5)   29.2          (2.1)    29.0         (1.9)     29.1         (1.4)
Massachusetts           27.4          (3.7)    19.5         (2.7)     23.2         (2.3)   24.2          (3.4)    19.9         (2.8)     21.9         (2.1)
Michigan                32.4          (3.4)    29.8         (2.6)     31.0         (2.1)   32.8          (3.2)    30.6         (2.5)     31.6         (1.9)
Minnesota               29.2          (2.3)    24.0         (1.9)     26.5         (1.5)   31.4          (2.4)    25.5         (2.0)     28.3         (1.5)
Mississippi             33.5          (4.5)    30.5         (3.2)     31.9         (2.7)   32.2          (4.0)    31.1         (3.3)     31.6         (2.6)
Missouri                32.1          (4.1)    26.7         (3.2)     29.3         (2.6)   34.7          (4.0)    31.2         (3.4)     32.9         (2.5)
Montana                 26.9          (4.1)    24.4         (3.8)     25.6         (2.8)   27.6          (4.3)    22.3         (3.3)     24.9         (2.5)
Nebraska                32.4          (3.7)    24.3         (2.7)     28.2         (2.3)   31.2          (3.7)    27.3         (2.9)     29.2         (2.3)
Nevada                  30.1          (3.8)    23.8         (2.7)     27.0         (2.3)   31.2          (3.8)    22.5         (2.9)     26.9         (2.4)
New Hampshire           27.2          (3.7)    21.8         (2.8)     24.4         (2.3)   29.4          (4.0)    22.6         (3.2)     25.9         (2.5)
New Jersey              27.1          (4.2)    21.6         (3.0)     24.2         (2.6)   28.8          (4.8)    20.4         (3.2)     24.4         (2.8)
New Mexico              23.6          (4.1)    18.1         (3.0)     20.7         (2.6)   22.6          (4.2)    25.1         (3.4)     23.8         (2.8)
New York                28.3          (3.3)    25.0         (2.7)     26.5         (2.2)   30.5          (3.2)    25.4         (2.6)     27.8         (2.0)
North Carolina          31.4          (3.4)    28.1         (3.0)     29.7         (2.3)   30.1          (2.8)    27.8         (2.2)     28.9         (1.7)
North Dakota            30.3          (3.4)    23.2         (2.7)     26.7         (2.3)   33.3          (3.5)    28.1         (3.2)     30.7         (2.3)
Ohio                    29.3          (4.3)    25.1         (3.3)     27.1         (2.7)   35.1          (4.7)    28.4         (3.6)     31.5         (2.9)
Oklahoma                24.5          (3.3)    25.2         (3.0)     24.9         (2.3)   26.1          (3.7)    22.4         (2.9)     24.1         (2.4)
Oregon                  25.7          (2.7)    25.1         (2.3)     25.4         (1.8)   29.0          (2.8)    28.6         (2.4)     28.7         (1.8)
Pennsylvania            29.9          (2.5)    28.4         (2.1)     29.1         (1.6)   30.8          (2.7)    29.4         (2.6)     30.1         (1.9)
Rhode Island                                                                               28.6          (3.7)    21.6         (2.8)     24.9         (2.3)
South Carolina          27.9          (3.4)    29.2         (3.0)     28.6         (2.3)   28.3          (3.4)    29.0         (3.0)     28.6         (2.3)
South Dakota            27.7          (3.4)    25.4         (3.0)     26.5         (2.3)   34.6          (3.5)    23.0         (2.8)     28.6         (2.3)
Tennessee               26.3          (2.7)    27.0         (2.3)     26.6         (1.7)   33.0          (3.4)    29.1         (2.9)     30.9         (2.2)
Texas                   33.1          (4.3)    24.3         (3.3)     28.6         (2.7)   30.7          (4.0)    26.6         (3.1)     28.6         (2.5)
Utah                    21.3          (3.2)    24.7         (2.9)     23.0         (2.1)   25.0          (3.1)    25.1         (2.9)     25.0         (2.1)
Vermont                 25.9          (2.9)    23.4         (2.4)     24.6         (1.9)   28.1          (3.1)    22.8         (2.4)     25.4         (1.9)
Virginia                30.4          (3.6)    22.4         (2.7)     26.3         (2.3)   29.8          (3.7)    28.7         (3.0)     29.2         (2.4)
Washington              26.7          (2.4)    23.8         (2.1)     25.2         (1.6)   27.6          (2.5)    23.4         (2.2)     25.4         (1.7)
West Virginia           32.3          (3.2)    30.2         (2.5)     31.2         (2.0)   33.7          (3.4)    30.4         (2.6)     31.9         (2.1)
Wisconsin               34.5          (4.3)    26.4         (3.4)     30.3         (2.8)   34.3          (3.8)    26.3         (3.1)     30.1         (2.4)
Wyoming                 30.9          (4.7)    22.9         (3.7)     26.9         (3.1)   29.1          (3.0)    25.4         (2.6)     27.3         (1.9)

Median                  28.4                   25.1                   26.7                 30.6                   26.4                   28.6
Low                     18.3                   16.9                   19.7                 22.0                   19.5                   21.8
High                    34.5                   30.5                   31.9                 36.0                   33.4                   34.6
----------------------------------------------------------------------------------------------------------------------------------------------------------------
* Body mass index >=27.8 kg/m^2 for men and >=27.3 kg.m^2 for women.
+ Confidence interval.
================================================================================================================================================================
Return to top. Table_2 Note: To print large tables and graphs users may have to change their printer settings to landscape and use a small font size.
TABLE 2. Percentage of adults who reported no leisure-time physical activity, * by sex --
Behavioral Risk Factor Surveillance System, 1994
===============================================================================================
                                 Men                    Women                  Total
                         -------------------     -------------------    -----------------------
State                       %   (+/-95% CI+)         %   (+/-95% CI)        %    (+/-95% CI)
-----------------------------------------------------------------------------------------------
Alabama                  42.2          (4.2)      49.0         (3.3)     45.8          (2.7)
Alaska                   21.8          (4.1)      24.0         (4.4)     22.8          (3.0)
Arizona                  23.7          (4.3)      23.6         (3.3)     23.7          (2.6)
Arkansas                 32.7          (4.0)      37.3         (3.4)     35.1          (2.6)
California               18.8          (2.1)      24.6         (2.1)     21.8          (1.5)
Colorado                 15.0          (2.8)      19.3         (2.9)     17.2          (2.1)
Connecticut              17.0          (3.0)      26.4         (2.8)     21.9          (2.1)
Delaware                 32.1          (3.5)      40.2         (3.1)     36.4          (2.4)
District of Columbia     47.1          (5.1)      49.9         (4.1)     48.6          (3.3)
Florida                  24.6          (2.4)      31.0         (2.3)     27.9          (1.7)
Georgia                  29.3          (3.3)      36.1         (3.0)     32.9          (2.3)
Hawaii                   17.1          (2.9)      24.2         (3.0)     20.7          (2.1)
Idaho                    21.4          (3.3)      22.3         (2.9)     21.8          (2.2)
Illinois                 30.8          (3.6)      35.9         (3.0)     33.5          (2.4)
Indiana                  25.4          (2.8)      33.5         (2.8)     29.6          (2.0)
Iowa                     35.4          (3.2)      31.3         (2.6)     33.3          (2.0)
Kansas                   33.6          (4.1)      35.2         (3.5)     34.4          (2.7)
Kentucky                 44.9          (3.6)      46.7         (2.9)     45.9          (2.3)
Louisiana                30.2          (4.1)      36.3         (3.4)     33.4          (2.7)
Maine                    42.6          (4.1)      39.0         (3.9)     40.7          (2.9)
Maryland                 27.2          (2.3)      32.9         (2.1)     30.2          (1.6)
Massachusetts            22.4          (3.5)      25.5         (3.0)     24.0          (2.3)
Michigan                 19.6          (2.6)      26.2         (2.6)     23.0          (1.9)
Minnesota                21.6          (2.0)      21.9         (1.8)     21.7          (1.4)
Mississippi              36.4          (4.7)      40.2         (3.3)     38.4          (2.8)
Missouri                 28.5          (4.3)      34.9         (3.3)     31.8          (2.7)
Montana                  21.4          (3.7)      20.6         (3.3)     21.0          (2.4)
Nebraska                 26.6          (3.4)      22.1         (2.6)     24.2          (2.1)
Nevada                   18.6          (3.2)      24.7         (2.8)     21.6          (2.1)
New Hampshire            23.0          (3.5)      28.1         (3.4)     25.6          (2.5)
New Jersey               26.4          (4.1)      35.0         (3.5)     30.9          (2.7)
New Mexico               15.7          (3.4)      22.8         (3.2)     19.4          (2.4)
New York                 34.8          (3.5)      39.2         (2.9)     37.1          (2.3)
North Carolina           40.8          (3.7)      44.6         (3.2)     42.8          (2.5)
North Dakota             33.8          (3.6)      30.2         (3.1)     32.0          (2.4)
Ohio                     39.5          (4.6)      36.6         (3.8)     38.0          (3.0)
Oklahoma                 28.8          (3.6)      31.9         (3.1)     30.4          (2.4)
Oregon                   20.1          (2.4)      21.3         (2.1)     20.8          (1.6)
Pennsylvania             22.3          (2.4)      30.2         (2.2)     26.5          (1.6)
South Carolina           28.8          (3.4)      33.7         (3.0)     31.4          (2.3)
South Dakota             28.7          (3.4)      32.6         (3.2)     30.7          (2.4)
Tennessee                38.4          (3.1)      40.8         (2.5)     39.7          (2.0)
Texas                    25.9          (4.0)      29.6         (3.5)     27.8          (2.7)
Utah                     18.6          (3.0)      23.1         (2.9)     20.9          (2.1)
Vermont                  23.3          (2.8)      23.2         (2.4)     23.2          (1.8)
Virginia                 20.4          (3.4)      25.3         (3.0)     22.9          (2.3)
Washington               16.5          (2.0)      19.7         (1.9)     18.2          (1.4)
West Virginia            43.2          (3.4)      47.1         (2.8)     45.3          (2.2)
Wisconsin                27.7          (4.2)      24.2         (3.3)     25.9          (2.7)
Wyoming                  21.7          (4.0)      20.2         (3.3)     21.0          (2.5)

Median                   26.5                     30.6                   28.8
Low                      14.9                     19.3                   17.2
High                     47.1                     49.9                   48.6
-----------------------------------------------------------------------------------------------
* No exercise, recreation, or physical activities (other than regular job duties) during the
  previous month.
+ Confidence interval.
===============================================================================================
Return to top. Table_3 Note: To print large tables and graphs users may have to change their printer settings to landscape and use a small font size.
TABLE 3. Percentage of adults who reported binge drinking,* by sex -- Behavioral Risk
Factor Surveillance System, 1995
==========================================================================================
                           Men                    Women                    Total
                  ----------------------   ---------------------   -----------------------
State                 %   (+/-95% CI +)        %   (+/-95% CI)          %   (+/-95% CI)
------------------------------------------------------------------------------------------
Alabama            21.8          (3.5)       6.4         (1.6)       13.6         (1.8)
Alaska             26.5          (4.9)      11.0         (3.0)       19.2         (3.0)
Arizona            20.5          (4.0)       6.8         (1.8)       13.5         (2.2)
Arkansas           14.0          (2.6)       4.1         (1.3)        8.8         (1.4)
California         24.0          (3.0)       6.8         (1.9)       15.3         (1.8)
Colorado           25.2          (3.5)       7.8         (2.0)       16.3         (2.1)
Connecticut        23.0          (3.4)       6.6         (1.7)       14.4         (1.9)
Delaware           14.0          (2.9)       3.7         (1.3)        8.6         (1.6)
Florida            20.2          (2.3)       6.7         (1.2)       13.1         (1.3)
Georgia            19.7          (2.9)       5.0         (1.4)       12.0         (1.6)
Hawaii             20.9          (3.3)       3.9         (1.3)       12.4         (1.8)
Idaho              18.9          (2.5)       7.2         (1.4)       12.9         (1.5)
Illinois           19.5          (3.7)       7.9         (2.0)       13.6         (2.2)
Indiana            20.9          (2.6)       5.4         (1.4)       12.8         (1.6)
Iowa               26.7          (2.5)      10.0         (1.5)       18.0         (1.5)
Kansas             21.9          (3.1)       6.4         (1.5)       13.9         (1.7)
Kentucky           17.0          (2.8)       3.1         (1.1)        9.7         (1.5)
Louisiana          22.5          (3.4)       6.5         (1.6)       14.0         (1.8)
Maine              16.2          (3.6)       7.1         (2.2)       11.5         (2.1)
Maryland           13.4          (1.7)       3.5         (0.7)        8.2         (0.9)
Massachusetts      27.3          (3.6)       9.3         (2.4)       17.8         (2.1)
Michigan           26.4          (2.9)      10.9         (1.8)       18.3         (1.7)
Minnesota          26.8          (2.4)       9.8         (1.4)       18.0         (1.4)
Mississippi        14.4          (3.3)       3.6         (1.4)        8.7         (1.7)
Missouri           23.6          (3.8)       5.6         (1.7)       14.1         (2.1)
Montana            20.0          (3.8)       8.9         (2.2)       14.3         (2.2)
Nebraska           25.1          (3.5)       7.4         (1.8)       15.8         (2.0)
Nevada             26.3          (3.6)      11.4         (2.1)       19.0         (2.2)
New Hampshire      26.0          (3.9)       7.8         (2.0)       16.6         (2.2)
New Jersey         21.7          (4.6)       7.0         (2.0)       14.0         (2.5)
New Mexico         21.7          (4.3)       6.9         (2.0)       14.1         (2.4)
New York           18.5          (2.8)       7.0         (2.2)       12.4         (1.8)
North Carolina      9.6          (1.7)       2.3         (0.8)        5.8         (0.9)
North Dakota       26.7          (3.4)       7.5         (1.9)       17.0         (1.9)
Ohio               15.9          (3.6)       4.5         (1.5)        9.9         (1.9)
Oklahoma            8.8          (2.4)       4.7         (1.8)        6.7         (1.5)
Oregon             19.7          (2.4)       8.4         (1.5)       13.9         (1.4)
Pennsylvania       30.5          (2.9)       9.5         (2.1)       19.4         (1.8)
Rhode Island       29.4          (3.8)       9.2         (2.3)       18.7         (2.3)
South Carolina     13.5          (2.6)       5.3         (1.4)        9.2         (1.5)
South Dakota       20.3          (3.1)       8.8         (2.0)       14.4         (1.8)
Tennessee           9.0          (2.0)       1.9         (0.8)        5.2         (1.1)
Texas              22.3          (3.6)       8.6         (1.9)       15.3         (2.1)
Utah               15.2          (2.6)       4.9         (1.5)        9.9         (1.5)
Vermont            24.0          (3.1)       8.4         (1.8)       16.0         (1.8)
Virginia           22.6          (3.4)       6.8         (1.6)       14.5         (1.9)
Washington         19.3          (2.2)       7.8         (1.3)       13.4         (1.3)
West Virginia       9.6          (2.1)       2.7         (0.9)        5.9         (1.1)
Wisconsin          35.0          (4.0)      11.6         (2.2)       22.9         (2.4)
Wyoming            23.4          (2.8)       7.9         (1.6)       15.6         (1.7)

Median             21.3                      6.9                     13.9
Low                 8.8                      1.9                      5.2
High               34.9                     11.6                     22.9
------------------------------------------------------------------------------------------
* Consumption of five or more alcoholic beverages on at least one occasion (i.e. drinking
  pattern I) during the previous month.
+ Confidence interval.
==========================================================================================
Return to top. Table_4 Note: To print large tables and graphs users may have to change their printer settings to landscape and use a small font size.
TABLE 4. Percentage of adults who reported chronic drinking, * by sex -- Behavioral Risk
Factor Surveillance System, 1995
============================================================================================
                            Men                    Women                   Total
                  ----------------------   --------------------    -------------------------
State                 %   (+/-95% CI +)        %   (+/-95% CI)         %   (+/-95% CI)
--------------------------------------------------------------------------------------------
Alabama             4.5          (1.6)       0.7         (0.5)       2.5         (0.8)
Alaska              4.6          (2.2)       1.1         (0.8)       2.9         (1.2)
Arizona             4.3          (1.7)       0.6         (0.4)       2.4         (0.9)
Arkansas            4.0          (1.5)       0.3         (0.3)       2.0         (0.7)
Colorado            8.8          (2.3)       0.9         (0.6)       4.8         (1.2)
Connecticut         7.4          (1.9)       1.8         (0.7)       4.4         (1.0)
Delaware            4.8          (1.8)       0.4         (0.4)       2.5         (0.9)
Florida             7.4          (1.4)       1.4         (0.6)       4.3         (0.7)
Georgia             5.1          (1.5)       0.6         (0.4)       2.8         (0.7)
Hawaii              4.7          (1.4)       1.0         (0.7)       2.8         (0.8)
Idaho               4.7          (1.4)       0.9         (0.5)       2.8         (0.7)
Illinois            5.0          (2.2)       0.8         (0.6)       2.8         (1.1)
Indiana             6.7          (1.6)       0.9         (0.5)       3.6         (0.8)
Iowa                6.7          (1.4)       1.1         (0.6)       3.8         (0.7)
Kansas              6.7          (1.9)       0.4         (0.4)       3.4         (1.0)
Kentucky            5.0          (1.6)       0.5         (0.3)       2.7         (0.8)
Louisiana           4.8          (1.7)       1.0         (0.6)       2.8         (0.9)
Maine               2.4          (1.2)       0.8         (0.7)       1.5         (0.7)
Maryland            4.0          (0.9)       0.8         (0.4)       2.3         (0.5)
Massachusetts       5.7          (1.9)       1.1         (0.8)       3.3         (1.0)
Michigan            5.3          (1.5)       0.7         (0.4)       2.9         (0.8)
Minnesota           8.1          (1.5)       1.3         (0.5)       4.6         (0.8)
Mississippi         4.9          (1.9)       0.7         (0.6)       2.7         (0.9)
Missouri            5.8          (2.2)       0.7         (0.5)       3.1         (1.1)
Montana             3.4          (1.5)       0.5         (0.5)       1.9         (0.8)
Nebraska            4.4          (1.5)       0.3         (0.4)       2.3         (0.8)
Nevada              8.3          (2.1)       2.8         (1.2)       5.6         (1.2)
New Hampshire       6.1          (2.0)       0.4         (0.4)       3.2         (1.0)
New Jersey          4.9          (2.5)       0.5         (0.5)       2.6         (1.2)
New Mexico          4.5          (2.1)       1.3         (0.9)       2.9         (1.1)
New York            4.5          (1.5)       0.4         (0.4)       2.3         (0.7)
North Carolina      3.6          (1.1)       0.5         (0.4)       2.0         (0.6)
North Dakota        4.1          (1.4)       0.7         (0.6)       2.4         (0.8)
Ohio                2.8          (1.6)       0.7         (0.7)       1.7         (0.8)
Oklahoma            1.6          (1.2)       0.9         (0.9)       1.2         (0.7)
Oregon              6.2          (1.5)       1.4         (0.6)       3.8         (0.8)
Pennsylvania        7.8          (1.7)       1.0         (0.5)       4.2         (0.9)
Rhode Island        9.9          (2.8)       1.2         (0.8)       5.3         (1.5)
South Carolina      2.7          (1.1)       1.6         (0.8)       2.2         (0.7)
South Dakota        3.9          (1.5)       0.2         (0.3)       2.0         (0.8)
Tennessee           2.9          (1.2)       0.2         (0.3)       1.5         (0.6)
Texas               7.1          (2.1)       0.8         (0.5)       3.8         (1.1)
Utah                2.7          (1.2)       0.3         (0.2)       1.5         (0.6)
Vermont             8.1          (1.8)       1.3         (0.6)       4.6         (0.9)
Virginia            5.9          (1.9)       0.8         (0.6)       3.3         (1.0)
Washington          5.1          (1.2)       0.5         (0.4)       2.8         (0.6)
West Virginia       2.6          (1.1)       0.6         (0.4)       1.5         (0.6)
Wisconsin           8.3          (2.3)       0.7         (0.5)       4.4         (1.1)
Wyoming             4.1          (1.3)       0.7         (0.6)       2.4         (0.7)

Median              4.8                      0.7                     2.8
Low                 1.6                      0.2                     1.2
High                9.9                      2.8                     5.6
--------------------------------------------------------------------------------------------
* Consumption of 60 or more alcoholic beverages (i.e. drinking pattern II) during the
  previous month.
+ Confidence interval.
============================================================================================
Return to top. Table_5 Note: To print large tables and graphs users may have to change their printer settings to landscape and use a small font size.
TABLE 5. Percentage of adults who reported cigarette smoking,* by sex -- Behavioral Risk Factor Surveillance System, 1994 and 1995
=================================================================================================================================================================
                                                     1994                                                                1995
                       -------------------------------------------------------------------- ---------------------------------------------------------------------
                                Men                  Women                   Total                  Men                  Women                 Total
                       ----------------------  --------------------  ---------------------- ---------------------- --------------------  ------------------------
State                      %   (+/-95% CI +)      %   (+/-95% CI)         %   (+/-95% CI)      %   (+/-95% CI)        %   (+/-95% CI)       %    (+/-95% CI)
-----------------------------------------------------------------------------------------------------------------------------------------------------------------
Alabama                 25.5          (3.8)    18.2         (2.4)      21.6         (2.2)   30.0         (3.9)     19.7         (2.6)    24.5          (2.3)
Alaska                  31.8          (5.0)    25.7         (4.4)      28.9         (3.4)   26.5         (4.7)     23.3         (4.0)    25.0          (3.1)
Arizona                 21.2          (4.1)    24.7         (3.6)      23.0         (2.7)   26.8         (4.5)     19.1         (3.1)    22.9          (2.6)
Arkansas                30.2          (4.0)    23.3         (2.8)      26.5         (2.5)   26.8         (3.6)     23.8         (2.7)    25.2          (2.2)
California              20.5          (2.2)    15.9         (1.7)      18.2         (1.4)   17.5         (2.3)     13.6         (2.3)    15.5          (1.6)
Colorado                25.6          (3.4)    22.6         (2.8)      24.1         (2.3)   22.2         (3.2)     21.4         (2.7)    21.8          (2.1)
Connecticut             20.5          (3.3)    19.1         (2.6)      19.8         (2.1)   21.0         (3.3)     20.6         (2.7)    20.8          (2.1)
Delaware                27.3          (3.3)    24.2         (2.7)      25.6         (2.2)   27.5         (3.3)     23.6         (2.7)    25.5          (2.1)
District of Columbia    17.0          (3.7)    13.4         (2.9)      15.0         (2.3)
Florida                 25.8          (2.4)    21.8         (2.0)      23.7         (1.6)   24.9         (2.5)     21.6         (2.0)    23.1          (1.6)
Georgia                 24.8          (3.1)    20.9         (2.5)      22.7         (2.0)   24.3         (3.0)     16.9         (2.3)    20.5          (1.9)
Hawaii                  22.8          (3.2)    18.1         (2.8)      20.4         (2.2)   18.8         (3.0)     16.8         (2.6)    17.8          (2.0)
Idaho                   19.0          (3.3)    20.2         (2.8)      19.6         (2.1)   20.4         (2.5)     19.2         (2.1)    19.8          (1.6)
Illinois                26.6          (3.5)    22.9         (2.6)      24.6         (2.2)   26.6         (2.9)     19.9         (2.1)    23.1          (1.8)
Indiana                 27.8          (3.1)    22.9         (2.5)      25.3         (2.0)   28.5         (2.8)     26.0         (2.6)    27.2          (1.9)
Iowa                    22.2          (2.7)    19.9         (2.3)      21.0         (1.7)   24.8         (2.4)     21.7         (1.9)    23.2          (1.5)
Kansas                  23.4          (3.6)    20.1         (3.0)      21.7         (2.4)   24.0         (3.0)     20.2         (2.5)    22.0          (2.0)
Kentucky                30.5          (3.4)    27.2         (2.5)      28.8         (2.1)   28.8         (3.2)     26.9         (2.5)    27.8          (2.0)
Louisiana               29.9          (4.0)    21.6         (2.7)      25.5         (2.4)   26.3         (3.8)     24.3         (3.0)    25.2          (2.5)
Maine                   25.0          (3.8)    22.3         (3.4)      23.6         (2.5)   26.9         (4.1)     23.2         (3.5)    25.0          (2.6)
Maryland                21.3          (2.1)    19.0         (1.7)      20.1         (1.4)   22.4         (2.0)     20.1         (1.6)    21.2          (1.3)
Massachusetts           22.9          (3.4)    19.5         (2.7)      21.1         (2.2)   22.5         (3.3)     21.0         (2.8)    21.7          (2.2)
Michigan                24.4          (3.0)    25.5         (2.5)      25.0         (2.0)   26.3         (2.9)     25.2         (2.4)    25.7          (1.9)
Minnesota               21.8          (2.1)    21.3         (1.8)      21.6         (1.4)   22.5         (2.2)     18.6         (1.7)    20.5          (1.4)
Mississippi             27.0          (4.0)    17.9         (2.6)      22.1         (2.3)   27.7         (4.0)     20.9         (2.9)    24.0          (2.5)
Missouri                27.7          (4.1)    22.7         (3.0)      25.0         (2.4)   28.0         (4.0)     20.9         (2.8)    24.3          (2.5)
Montana                 22.0          (4.0)    21.2         (3.6)      21.6         (2.7)   22.5         (3.8)     19.8         (3.1)    21.1          (2.5)
Nebraska                20.6          (3.2)    18.1         (2.5)      19.3         (2.0)   24.8         (3.4)     19.3         (2.5)    21.9          (2.1)
Nevada                  31.7          (4.0)    26.5         (2.8)      29.1         (2.5)   24.8         (3.6)     27.8         (3.2)    26.3          (2.4)
New Hampshire           23.9          (3.5)    21.0         (3.0)      22.4         (2.2)   22.0         (3.8)     21.0         (3.0)    21.5          (2.4)
New Jersey              22.1          (3.9)    23.2         (3.0)      22.7         (2.5)   21.6         (4.5)     17.0         (2.8)    19.2          (2.6)
New Mexico              19.9          (4.1)    23.3         (3.3)      21.7         (2.7)   22.7         (4.4)     19.7         (3.2)    21.2          (2.7)
New York                22.6          (3.0)    19.7         (2.4)      21.1         (1.9)   23.6         (3.1)     19.6         (2.3)    21.5          (1.9)
North Carolina          31.0          (3.4)    24.6         (2.7)      27.7         (2.2)   30.2         (2.8)     21.8         (2.1)    25.8          (1.7)
North Dakota            20.4          (3.0)    19.8         (2.7)      20.1         (2.0)   24.9         (3.2)     20.5         (2.9)    22.7          (2.1)
Ohio                    27.7          (4.5)    24.9         (3.5)      26.2         (2.8)   31.6         (4.7)     21.0         (3.2)    26.0          (2.8)
Oklahoma                23.9          (3.4)    24.0         (3.0)      24.0         (2.2)   21.6         (3.3)     21.7         (3.0)    21.7          (2.2)
Oregon                  21.4          (2.6)    21.1         (2.2)      21.2         (1.7)   22.9         (2.6)     20.8         (2.3)    21.8          (1.8)
Pennsylvania            24.5          (2.4)    23.6         (2.0)      24.0         (1.5)   26.0         (2.7)     22.5         (2.5)    24.2          (1.8)
Rhode Island                                                                                24.0         (3.4)     25.4         (3.1)    24.7          (2.3)
South Carolina          27.9          (3.3)    20.0         (2.6)      23.8         (2.1)   24.6         (3.2)     23.0         (2.8)    23.7          (2.1)
South Dakota            21.1          (3.1)    20.7         (2.7)      20.9         (2.1)   22.8         (3.0)     20.9         (2.8)    21.8          (2.1)
Tennessee               28.0          (2.8)    25.1         (2.2)      26.5         (1.8)   27.9         (3.4)     25.2         (2.6)    26.5          (2.1)
Texas                   23.0          (3.9)    19.6         (3.1)      21.3         (2.5)   27.1         (3.9)     20.4         (2.8)    23.7          (2.4)
Utah                    17.0          (2.9)    14.4         (2.3)      15.7         (1.8)   16.4         (2.9)     10.1         (1.8)    13.2          (1.7)
Vermont                 23.5          (2.9)    21.6         (2.4)      22.5         (1.9)   24.9         (3.0)     19.5         (2.5)    22.1          (1.9)
Virginia                27.8          (3.5)    22.8         (2.8)      25.2         (2.3)   23.7         (3.5)     20.5         (2.7)    22.0          (2.3)
Washington              24.3          (2.4)    19.5         (1.9)      21.8         (1.5)   20.1         (2.3)     20.3         (2.0)    20.2          (1.5)
West Virginia           27.3          (3.2)    26.6         (2.6)      26.9         (2.0)   24.8         (3.0)     26.5         (2.5)    25.7          (2.0)
Wisconsin               23.6          (3.7)    22.0         (3.3)      22.7         (2.5)   24.5         (3.5)     19.3         (2.6)    21.8          (2.2)
Wyoming                 21.2          (4.0)    21.6         (3.8)      21.4         (2.7)   22.1         (2.8)     21.9         (2.3)    22.0          (1.8)

Median                  23.8                   21.6                    22.6                 24.7                   20.9                  22.4
Low                     16.9                   13.4                    15.0                 16.4                   10.0                  13.2
High                    31.8                   27.2                    29.1                 31.6                   27.8                  27.8
-----------------------------------------------------------------------------------------------------------------------------------------------------------------
* Ever smoked at least 100 cigarettes and currently smoke.
+ Confidence interval.
=================================================================================================================================================================
Return to top. Table_6 Note: To print large tables and graphs users may have to change their printer settings to landscape and use a small font size.
TABLE 6. Percentage of young adults (persons 18-29 years of age) who reported
cigarette smoking, * by sex -- Behavioral Risk Factor Surveillance System, 1994 and
1995 aggregate data
======================================================================================
                          Men                   Women                  Total
                 ----------------------   ------------------    ----------------------
State                %   (+/-95% CI +)       %   (+/-95% CI)        %   (+/-95% CI)
--------------------------------------------------------------------------------------
Alabama           29.5          (6.0)     19.4         (3.8)     24.4         (3.6)
Alaska            33.2          (7.5)     25.3         (6.6)     29.7         (5.1)
Arizona           26.9          (7.2)     24.9         (5.8)     25.9         (4.8)
Arkansas          24.2          (5.7)     22.9         (4.7)     23.6         (3.6)
California        19.1          (3.4)     12.7         (2.4)     16.0         (2.1)
Colorado          25.4          (5.4)     30.3         (5.3)     27.6         (3.8)
Connecticut       23.6          (5.5)     21.3         (5.0)     22.5         (3.7)
Delaware          28.2          (5.3)     29.1         (4.9)     28.7         (3.5)
Florida           29.5          (4.5)     25.3         (3.9)     27.3         (3.0)
Georgia           24.6          (5.0)     17.8         (3.7)     21.1         (3.2)
Hawaii            23.1          (4.7)     18.7         (4.1)     21.1         (3.2)
Idaho             20.1          (4.8)     23.3         (4.3)     21.7         (3.2)
Illinois          29.2          (5.4)     21.0         (3.8)     25.2         (3.4)
Indiana           31.2          (4.9)     27.5         (4.5)     29.3         (3.3)
Iowa              22.8          (4.1)     23.4         (3.8)     23.1         (2.8)
Kansas            26.1          (5.6)     19.0         (4.7)     22.6         (3.7)
Kentucky          26.7          (5.2)     30.4         (4.1)     28.5         (3.5)
Louisiana         29.1          (5.6)     21.7         (4.4)     25.4         (3.6)
Maine             33.5          (7.6)     31.3         (6.9)     32.4         (5.3)
Maryland          20.4          (3.2)     21.6         (2.8)     21.0         (2.1)
Massachusetts     22.2          (5.0)     24.1         (5.2)     23.1         (3.6)
Michigan          25.1          (4.6)     31.6         (4.4)     28.3         (3.3)
Minnesota         22.4          (3.3)     25.9         (3.2)     24.1         (2.3)
Mississippi       20.8          (5.9)     15.5         (4.0)     18.1         (3.5)
Missouri          29.7          (7.0)     22.9         (5.3)     26.3         (4.5)
Montana           20.9          (6.9)     20.9         (6.0)     20.9         (4.6)
Nebraska          27.5          (6.0)     23.6         (4.8)     25.5         (3.9)
Nevada            24.9          (5.3)     23.2         (4.6)     24.1         (3.5)
New Hampshire     21.5          (6.1)     27.1         (5.7)     24.3         (4.3)
New Jersey        23.0          (6.4)     21.4         (4.8)     22.2         (4.0)
New Mexico        20.4          (6.7)     20.5         (5.4)     20.4         (4.3)
New York          30.1          (5.2)     22.8         (4.1)     26.4         (3.4)
North Carolina    31.1          (4.8)     25.6         (4.1)     28.4         (3.2)
North Dakota      19.6          (4.3)     23.3         (5.1)     21.4         (3.3)
Ohio              39.4          (7.7)     25.8         (5.9)     32.7         (4.9)
Oklahoma          17.8          (5.2)     25.6         (5.6)     21.6         (3.8)
Oregon            23.4          (4.6)     25.5         (4.1)     24.4         (3.1)
Pennsylvania      32.7          (4.7)     27.4         (3.9)     30.0         (3.1)
South Carolina    22.1          (4.6)     20.9         (4.4)     21.6         (3.1)
South Dakota      22.2          (5.0)     23.2         (4.9)     22.7         (3.5)
Tennessee         25.7          (4.8)     22.1         (3.8)     23.9         (3.1)
Texas             23.3          (5.9)     19.8         (4.7)     21.6         (3.8)
Utah              17.9          (4.1)     12.5         (3.1)     15.2         (2.5)
Vermont           27.8          (5.3)     24.8         (4.9)     26.3         (3.6)
Virginia          28.3          (5.6)     24.1         (4.6)     26.2         (3.7)
Washington        25.3          (3.9)     22.1         (3.4)     23.8         (2.6)
West Virginia     27.7          (5.2)     28.9         (4.5)     28.3         (3.5)
Wisconsin         30.3          (6.2)     24.8         (5.1)     27.6         (4.0)
Wyoming           22.0          (6.0)     24.4         (6.8)     23.2         (4.5)

Median            25.1                    23.3                   24.1
Low               17.8                    12.5                   15.2
High              39.4                    31.6                   32.7
--------------------------------------------------------------------------------------
* Ever smoked at least 100 cigarettes and currently smoke.
+ Confidence interval.
======================================================================================
Return to top. Table_7 Note: To print large tables and graphs users may have to change their printer settings to landscape and use a small font size.
TABLE 7. Percentage of adults who reported always wearing a safety belt while driving or
riding in a car, by sex -- Behavioral Risk Factor Surveillance System, 1995
========================================================================================
                          Men                   Women                  Total
                ---------------------    --------------------   ------------------------
State                %   (+/-95% CI*)        %    (+/-95% CI)       %   (+/-95% CI)
----------------------------------------------------------------------------------------
Alabama           58.8          (4.4)     73.9          (3.1)    66.8         (2.7)
Alaska            57.7          (5.3)     73.6          (4.0)    65.2         (3.4)
Arizona           67.5          (4.7)     80.0          (3.3)    73.9         (3.0)
Arkansas          57.0          (3.9)     75.7          (2.8)    66.9         (2.4)
California        81.5          (2.8)     87.7          (2.3)    84.6         (1.8)
Colorado          56.4          (4.0)     71.9          (3.0)    64.3         (2.5)
Connecticut       61.7          (3.9)     75.0          (2.9)    68.7         (2.5)
Delaware          64.8          (3.6)     76.2          (2.6)    70.8         (2.3)
Florida           69.5          (2.7)     80.5          (2.0)    75.2         (1.7)
Georgia           59.2          (3.4)     68.0          (3.0)    63.8         (2.3)
Hawaii            84.1          (2.8)     89.8          (2.0)    86.9         (1.8)
Idaho             48.3          (3.2)     65.9          (2.5)    57.2         (2.1)
Illinois          63.2          (4.6)     74.0          (3.4)    68.7         (2.9)
Indiana           47.3          (3.2)     64.7          (2.9)    56.4         (2.2)
Iowa              53.0          (2.8)     71.6          (2.2)    62.7         (1.8)
Kansas            49.3          (3.5)     64.6          (3.0)    57.2         (2.3)
Kentucky          57.4          (3.5)     71.9          (2.7)    65.0         (2.3)
Louisiana         59.3          (4.3)     73.5          (3.1)    66.8         (2.7)
Maine             43.5          (4.6)     58.2          (4.1)    51.2         (3.1)
Maryland          66.9          (2.3)     80.9          (1.6)    74.2         (1.4)
Massachusetts     52.0          (4.0)     63.0          (3.4)    57.8         (2.6)
Michigan          63.1          (3.2)     76.6          (2.4)    70.1         (2.0)
Minnesota         50.0          (2.6)     65.7          (2.3)    58.1         (1.8)
Mississippi       48.3          (4.3)     66.6          (3.4)    58.1         (2.8)
Missouri          52.5          (4.5)     73.4          (3.2)    63.5         (2.8)
Montana           46.1          (4.8)     66.5          (3.8)    56.5         (3.1)
Nebraska          43.7          (3.8)     61.3          (3.2)    52.9         (2.5)
Nevada            64.9          (3.9)     77.2          (2.9)    71.0         (2.5)
New Hampshire     45.3          (4.4)     59.9          (3.6)    52.8         (2.9)
New Jersey        60.1          (5.3)     75.2          (3.4)    68.0         (3.1)
New Mexico        78.0          (4.3)     90.1          (2.5)    84.2         (2.4)
New York          67.0          (3.3)     75.1          (2.7)    71.3         (2.1)
North Carolina    79.2          (2.4)     91.9          (1.4)    85.9         (1.4)
North Dakota      33.0          (3.5)     49.6          (3.5)    41.4         (2.6)
Ohio              60.6          (4.7)     74.8          (3.3)    68.1         (2.9)
Oklahoma          47.4          (4.1)     59.9          (3.5)    53.9         (2.7)
Oregon            77.8          (2.7)     87.6          (1.8)    82.8         (1.6)
Pennsylvania      49.9          (3.1)     69.3          (2.4)    60.2         (2.0)
Rhode Island      43.0          (4.0)     56.0          (3.5)    49.9         (2.6)
South Carolina    73.6          (3.4)     79.4          (2.8)    76.6         (2.2)
South Dakota      35.4          (3.6)     50.1          (3.4)    42.9         (2.5)
Tennessee         53.5          (3.9)     67.8          (2.9)    61.0         (2.5)
Texas             71.2          (4.0)     83.4          (2.5)    77.5         (2.4)
Utah              52.1          (3.6)     67.6          (3.0)    60.0         (2.4)
Vermont           60.5          (3.4)     80.5          (2.3)    70.8         (2.1)
Virginia          65.4          (4.0)     78.2          (2.7)    72.0         (2.5)
Washington        70.7          (2.6)     84.1          (1.8)    77.5         (1.6)
West Virginia     64.4          (3.4)     74.3          (2.4)    69.6         (2.0)
Wisconsin         46.4          (4.0)     64.9          (3.4)    56.0         (2.7)
Wyoming           41.1          (3.4)     54.0          (3.0)    47.6         (2.3)

Median            58.2                    73.5                   66.0
Low               33.0                    49.6                   41.4
High              84.1                    91.9                   86.9
----------------------------------------------------------------------------------------
* Confidence interval.
========================================================================================
Return to top. Table_8 Note: To print large tables and graphs users may have to change their printer settings to landscape and use a small font size.
TABLE 8. Percentage of adults who reported drinking and driving,* by sex -- Behavioral
Risk Factor Surveillance System, 1995
=========================================================================================
                          Men                   Women                  Total
                   ------------------     -------------------    ------------------------
State                %   (+/-95% CI+)        %   (+/-95% CI)        %   (+/-95% CI)
-----------------------------------------------------------------------------------------
Alabama            4.7          (1.8)      0.8         (0.7)      2.6         (0.9)
Alaska             1.6          (1.0)      0.9         (0.8)      1.3         (0.7)
Arizona            3.7          (1.8)      1.7         (1.1)      2.7         (1.1)
Arkansas           2.8          (1.3)      0.3         (0.3)      1.5         (0.6)
California         3.0          (1.2)      0.8         (0.3)      1.9         (0.6)
Colorado           5.2          (1.7)      1.0         (0.6)      3.1         (0.9)
Connecticut        4.5          (1.6)      0.7         (0.5)      2.5         (0.8)
Delaware           2.4          (1.3)      0.4         (0.5)      1.4         (0.7)
Florida            4.4          (1.3)      1.0         (0.5)      2.6         (0.7)
Georgia            3.3          (1.4)      1.1         (0.6)      2.2         (0.7)
Hawaii             3.0          (1.2)      1.1         (0.7)      2.1         (0.7)
Idaho              2.9          (1.1)      1.2         (0.6)      2.0         (0.6)
Illinois           2.8          (1.4)      0.7         (0.6)      1.8         (0.7)
Indiana            4.8          (1.5)      0.6         (0.4)      2.6         (0.7)
Iowa               4.9          (1.1)      1.9         (0.7)      3.3         (0.6)
Kansas             5.3          (1.8)      1.2         (0.7)      3.2         (0.9)
Kentucky           1.0          (0.7)      0.2         (0.3)      0.6         (0.4)
Louisiana          4.8          (1.7)      1.0         (0.6)      2.8         (0.9)
Maine              1.3          (0.9)      0.6         (0.6)      0.9         (0.5)
Maryland           2.0          (0.7)      0.4         (0.2)      1.1         (0.4)
Massachusetts      5.9          (2.0)      1.3         (1.0)      3.5         (1.1)
Michigan           5.6          (1.5)      1.2         (0.6)      3.3         (0.8)
Minnesota          8.0          (1.5)      2.0         (0.6)      4.9         (0.8)
Mississippi        2.2          (1.4)      0.2         (0.2)      1.1         (0.7)
Missouri           3.7          (1.5)      0.8         (0.7)      2.1         (0.8)
Montana            5.3          (2.2)      1.6         (1.0)      3.4         (1.2)
Nebraska           4.6          (1.6)      1.1         (0.8)      2.8         (0.9)
Nevada             6.1          (1.9)      1.3         (0.8)      3.7         (1.1)
New Hampshire      2.4          (1.3)      0.9         (0.6)      1.6         (0.7)
New Jersey         3.8          (2.0)      0.3         (0.5)      2.0         (1.0)
New Mexico         5.1          (2.4)      1.5         (0.9)      3.3         (1.2)
New York           1.3          (0.7)      0.5         (0.5)      0.9         (0.4)
North Carolina     1.7          (0.8)      0.6         (0.4)      1.1         (0.4)
North Dakota       7.2          (2.0)      1.3         (0.8)      4.2         (1.1)
Ohio               3.1          (1.6)      0.4         (0.4)      1.6         (0.8)
Oklahoma           2.1          (1.4)      0.4         (0.4)      1.2         (0.7)
Oregon             2.7          (1.0)      0.9         (0.6)      1.8         (0.5)
Pennsylvania       6.5          (1.7)      1.0         (0.5)      3.6         (0.9)
Rhode Island       5.6          (1.8)      1.9         (1.1)      3.7         (1.0)
South Carolina     2.1          (1.1)      0.7         (0.6)      1.4         (0.6)
South Dakota       8.0          (2.0)      2.6         (1.0)      5.2         (1.1)
Tennessee          1.4          (0.8)      0.6         (0.5)      1.0         (0.5)
Texas              6.3          (1.9)      1.3         (0.7)      3.7         (1.0)
Utah               2.3          (1.0)      0.2         (0.2)      1.2         (0.5)
Vermont            3.4          (1.3)      1.5         (1.1)      2.4         (0.8)
Virginia           4.3          (1.7)      0.9         (0.6)      2.5         (0.9)
Washington         3.3          (1.0)      1.0         (0.4)      2.1         (0.5)
West Virginia      1.5          (0.8)      0.3         (0.3)      0.9         (0.4)
Wisconsin          7.0          (2.0)      2.3         (1.0)      4.5         (1.1)
Wyoming            5.7          (1.5)      0.8         (0.5)      3.2         (0.8)

Median             3.7                     0.9                    2.3
Low                1.0                     0.2                    0.6
High               8.0                     2.6                    5.2
-----------------------------------------------------------------------------------------
* At least once in the previous month, operated a motor vehicle after drinking too much
  alcohol.
+ Confidence interval.
=========================================================================================
Return to top. Table_9 Note: To print large tables and graphs users may have to change their printer settings to landscape and use a small font size.
TABLE 9. Percentage of adults who reported ever having been told by a health\
professional that they had high blood pressure, by sex -- Behavioral Risk Factor
Surveillance System, 1995
=======================================================================================
                          Men                   Women                  Total
                 ---------------------   ---------------------   ----------------------
State                %   (+/-95% CI *)       %    (+/-95% CI)       %   (+/-95% CI)
---------------------------------------------------------------------------------------
Alabama           21.5          (3.3)     27.3          (2.9)    24.6         (2.2)
Alaska            20.1          (4.4)     18.4          (3.7)    19.3         (2.9)
Arizona           15.8          (3.4)     24.7          (3.3)    20.3         (2.4)
Arkansas          24.1          (3.2)     28.8          (3.0)    26.6         (2.2)
California        21.1          (3.3)     22.5          (2.4)    21.8         (2.0)
Colorado          20.3          (3.0)     22.4          (2.8)    21.4         (2.0)
Connecticut       18.7          (3.1)     19.5          (2.6)    19.1         (2.0)
Delaware          19.2          (2.9)     23.2          (2.4)    21.2         (1.9)
Florida           22.5          (2.4)     23.9          (2.1)    23.2         (1.6)
Georgia           18.8          (2.7)     20.5          (2.5)    19.7         (1.8)
Hawaii            21.3          (3.2)     20.8          (2.9)    21.0         (2.2)
Idaho             23.0          (2.6)     20.1          (2.1)    21.5         (1.7)
Illinois          21.5          (3.4)     22.6          (3.1)    22.0         (2.3)
Indiana           24.1          (2.8)     27.8          (2.6)    26.0         (1.9)
Iowa              22.2          (2.4)     24.8          (1.9)    23.6         (1.5)
Kansas            22.1          (2.9)     24.3          (2.6)    23.2         (1.9)
Kentucky          20.5          (2.8)     22.4          (2.3)    21.5         (1.8)
Louisiana         20.6          (3.3)     27.2          (3.0)    24.1         (2.3)
Maine             18.6          (3.4)     23.0          (3.4)    20.9         (2.4)
Maryland          19.4          (1.8)     22.1          (1.6)    20.8         (1.2)
Massachusetts     25.8          (3.4)     21.5          (2.9)    23.5         (2.2)
Michigan          24.0          (2.8)     24.6          (2.3)    24.3         (1.8)
Minnesota         17.9          (1.9)     19.1          (1.8)    18.5         (1.3)
Mississippi       27.9          (4.1)     31.4          (3.3)    29.8         (2.6)
Missouri          23.4          (3.7)     22.6          (2.9)    23.0         (2.3)
Montana           16.8          (3.4)     21.8          (3.3)    19.4         (2.4)
Nebraska          20.8          (3.2)     22.5          (2.5)    21.7         (2.0)
Nevada            22.6          (3.4)     20.8          (2.7)    21.7         (2.2)
New Hampshire     20.1          (3.2)     20.5          (3.0)    20.3         (2.2)
New Jersey        31.3          (4.9)     20.5          (3.1)    25.6         (2.8)
New Mexico        21.3          (4.2)     18.0          (3.0)    19.6         (2.6)
New York          21.2          (2.9)     22.8          (2.4)    22.0         (1.8)
North Carolina    19.9          (2.5)     21.1          (2.0)    20.5         (1.6)
North Dakota      22.1          (3.0)     22.3          (2.7)    22.2         (2.1)
Ohio              22.0          (3.9)     25.0          (3.4)    23.6         (2.6)
Oklahoma          18.6          (3.0)     24.2          (2.9)    21.5         (2.1)
Oregon            21.7          (2.5)     26.1          (2.3)    23.9         (1.7)
Pennsylvania      24.0          (2.5)     24.8          (2.2)    24.4         (1.6)
Rhode Island      22.6          (3.1)     23.8          (3.0)    23.2         (2.2)
South Carolina    20.8          (3.0)     25.8          (2.8)    23.4         (2.1)
South Dakota      21.6          (3.2)     19.6          (2.7)    20.6         (2.1)
Tennessee         24.3          (3.1)     29.0          (2.9)    26.8         (2.2)
Texas             23.1          (3.7)     24.6          (2.9)    23.8         (2.4)
Utah              17.9          (2.7)     20.3          (2.4)    19.1         (1.8)
Vermont           22.1          (2.7)     23.3          (2.4)    22.7         (1.8)
Virginia          21.3          (3.2)     24.8          (3.0)    23.1         (2.3)
Washington        19.8          (2.2)     21.9          (2.1)    20.9         (1.5)
West Virginia     24.1          (3.0)     26.7          (2.3)    25.5         (1.9)
Wisconsin         21.5          (3.2)     23.8          (2.9)    22.7         (2.2)
Wyoming           22.0          (2.7)     20.2          (2.3)    21.1         (1.7)

Median            21.5                    22.7                   22.0
Low               15.8                    17.9                   18.5
High              31.3                    31.4                   29.8
---------------------------------------------------------------------------------------
* Confidence interval.
=======================================================================================
Return to top. Table_10 Note: To print large tables and graphs users may have to change their printer settings to landscape and use a small font size.
TABLE 10. Percentage of adults who reported ever having been told by a health
professional that they had diabetes, by sex -- Behavioral Risk Factor Surveillance
System, 1994 and 1995
=======================================================================================================================================================
                                                 1994                                                              1995
                  ----------------------------------------------------------------    ---------------------------------------------------------------
                           Men                  Women                 Total                  Men                  Women                  Total
                  -------------------    -------------------    ------------------    ------------------    ------------------     ------------------
State              %    (+/-95% CI *)     %      (+/-95% CI)     %     (+/-95% CI)     %     (+/-95% CI)     %     (+/-95% CI)      %     (+/-95% CI)
-----------------------------------------------------------------------------------------------------------------------------------------------------
Alabama           3.2       (1.4)        3.6        (1.1)       3.4       (0.9)       3.2       (1.0)       6.1       (1.5)        4.8       (1.4)
Alaska            3.1       (1.7)        3.0        (1.6)       3.1       (1.2)       2.0       (1.2)       3.5       (1.9)        2.7       (1.4)
Arizona           4.3       (2.2)        2.7        (1.1)       3.5       (1.2)       5.5       (1.4)       4.1       (1.6)        4.8       (2.5)
Arkansas          4.4       (1.7)        6.4        (1.6)       5.4       (1.2)       4.9       (1.1)       5.5       (1.5)        5.2       (1.6)
California        4.0       (1.0)        3.5        (0.8)       3.8       (0.6)       4.5       (1.4)       6.6       (2.5)        5.6       (1.3)
Colorado          4.0       (1.6)        2.9        (1.2)       3.4       (1.0)       4.3       (1.0)       2.8       (1.1)        3.5       (1.6)
Connecticut       3.9       (1.5)        5.3        (1.4)       4.6       (1.0)       4.5       (1.1)       4.1       (1.3)        4.3       (1.7)
Delaware          6.2       (1.7)        4.9        (1.2)       5.5       (1.0)       3.9       (0.9)       4.7       (1.3)        4.3       (1.4)
District of
  Columbia        4.0       (1.7)        4.3        (1.6)       4.2       (1.2)
Florida           5.0       (1.2)        4.5        (0.9)       4.8       (0.7)       5.4       (0.8)       5.1       (1.0)        5.2       (1.2)
Georgia           3.8       (1.3)        4.9        (1.3)       4.3       (0.9)       4.0       (0.8)       3.4       (1.2)        3.7       (1.3)
Hawaii            4.2       (1.5)        4.3        (1.6)       4.2       (1.1)       3.6       (0.9)       2.8       (1.1)        3.2       (1.3)
Idaho             3.9       (1.5)        4.6        (1.4)       4.2       (1.0)       3.4       (0.7)       3.7       (1.0)        3.6       (1.1)
Illinois          5.4       (1.6)        5.0        (1.4)       5.2       (1.0)       6.2       (0.9)       4.7       (1.1)        5.4       (1.5)
Indiana           3.9       (1.2)        4.7        (1.2)       4.3       (0.8)       4.8       (0.9)       5.2       (1.3)        5.0       (1.3)
Iowa              3.4       (1.1)        4.7        (1.2)       4.1       (0.8)       4.9       (0.8)       5.8       (1.1)        5.4       (1.2)
Kansas            4.9       (1.9)        3.1        (1.2)       3.9       (1.1)       4.3       (1.0)       5.3       (1.4)        4.8       (1.4)
Kentucky          3.6       (1.2)        4.9        (1.1)       4.3       (0.8)       2.8       (0.7)       4.2       (1.0)        3.5       (1.0)
Louisiana         5.2       (1.9)        4.8        (1.6)       5.0       (1.2)       5.7       (1.3)       6.6       (1.7)        6.2       (2.1)
Maine             3.5       (1.4)        3.9        (1.5)       3.7       (1.0)       3.2       (1.0)       3.8       (1.5)        3.5       (1.5)
Maryland          4.8       (1.0)        4.9        (0.9)       4.9       (0.7)       3.8       (0.5)       4.2       (0.8)        4.0       (0.8)
Massachusetts     3.7       (1.4)        4.3        (1.4)       4.0       (1.0)       4.3       (1.0)       3.4       (1.2)        3.8       (1.6)
Michigan          4.0       (1.2)        5.2        (1.2)       4.6       (0.9)       5.5       (0.9)       5.2       (1.2)        5.3       (1.5)
Minnesota         3.6       (0.9)        4.1        (0.8)       3.8       (0.6)       2.8       (0.6)       3.3       (0.8)        3.1       (0.8)
Mississippi       5.6       (1.8)        5.8        (1.6)       5.7       (1.2)       3.8       (1.3)       8.6       (1.9)        6.4       (1.7)
Missouri          6.0       (2.1)        5.8        (1.5)       5.9       (1.2)       3.6       (1.0)       4.6       (1.3)        4.1       (1.4)
Montana           2.6       (1.3)        2.4        (1.1)       2.5       (0.8)       2.6       (0.9)       3.1       (1.2)        2.8       (1.4)
Nebraska          3.8       (1.5)        5.5        (1.5)       4.7       (1.0)       3.7       (0.9)       5.1       (1.3)        4.4       (1.3)
Nevada            4.3       (1.5)        3.1        (1.1)       3.7       (1.0)       4.9       (1.2)       4.7       (1.5)        4.8       (1.9)
New Hampshire     4.7       (1.7)        4.5        (1.6)       4.6       (1.2)       4.9       (1.1)       4.1       (1.5)        4.5       (1.7)
New Jersey        4.7       (2.0)        2.6        (1.1)       3.6       (1.1)       3.3       (1.3)       5.1       (1.8)        4.2       (1.9)
New Mexico        4.8       (2.0)        4.6        (1.5)       4.7       (1.2)       5.8       (1.5)       5.3       (1.9)        5.6       (2.3)
New York          3.8       (1.3)        3.9        (1.1)       3.8       (0.8)       3.0       (0.9)       5.2       (1.3)        4.2       (1.2)
North Carolina    4.2       (1.3)        4.2        (1.1)       4.2       (0.9)       4.0       (0.7)       5.0       (1.1)        4.5       (1.0)
North Dakota      3.9       (1.4)        3.4        (1.1)       3.6       (0.9)       4.2       (0.9)       3.3       (1.1)        3.7       (1.5)
Ohio              4.3       (2.0)        5.2        (2.1)       4.7       (1.4)       4.6       (1.3)       3.8       (1.4)        4.2       (2.3)
Oklahoma          2.4       (1.1)        3.2        (1.0)       2.8       (0.8)       2.3       (1.1)       3.5       (1.3)        2.9       (1.7)
Oregon            4.1       (1.2)        3.4        (0.9)       3.7       (0.8)       4.0       (0.8)       4.1       (1.1)        4.0       (1.2)
Pennsylvania      5.0       (1.2)        5.5        (1.1)       5.3       (0.8)       5.5       (0.8)       5.8       (1.2)        5.7       (1.3)
Rhode Island                                                                          4.5       (1.2)       4.6       (1.8)        4.6       (1.5)
South Carolina    6.2       (1.9)        5.4        (1.3)       5.8       (1.1)       5.1       (1.1)       4.9       (1.3)        5.0       (1.9)
South Dakota      5.0       (1.8)        3.7        (1.1)       4.3       (1.0)       3.1       (0.8)       2.8       (1.2)        2.9       (1.3)
Tennessee         5.0       (1.3)        5.9        (1.1)       5.4       (0.8)       5.1       (1.0)       5.3       (1.4)        5.2       (1.6)
Texas             5.5       (2.2)        4.8        (1.5)       5.1       (1.3)       4.6       (1.2)       5.8       (1.6)        5.2       (1.7)
Utah              4.0       (1.4)        3.7        (1.2)       3.9       (0.9)       4.3       (0.9)       3.2       (1.0)        3.7       (1.5)
Vermont           3.6       (1.1)        4.2        (1.1)       3.9       (0.8)       4.3       (0.9)       4.7       (1.1)        4.5       (1.3)
Virginia          3.3       (1.3)        5.1        (1.5)       4.3       (1.0)       2.4       (1.0)       5.2       (1.5)        3.8       (1.1)
Washington        4.0       (1.1)        3.5        (0.9)       3.7       (0.7)       2.6       (0.6)       3.6       (0.9)        3.1       (0.8)
West Virginia     4.3       (1.3)        6.1        (1.3)       5.2       (0.9)       3.9       (0.9)       5.4       (1.2)        4.7       (1.5)
Wisconsin         3.8       (1.6)        2.9        (1.2)       3.3       (1.0)       3.7       (1.0)       5.3       (1.5)        4.5       (1.3)
Wyoming           3.1       (1.5)        3.7        (1.3)       3.4       (1.0)       3.6       (0.7)       2.8       (0.9)        3.2       (1.2)

Median            4.0                    4.4                    4.2                   4.1                   4.7                    4.4

Low               2.4                    2.4                    2.5                   1.9                   2.7                    2.7

High              6.2                    6.4                    5.9                   6.2                   8.6                    6.4
-----------------------------------------------------------------------------------------------------------------------------------------------------
* Confidence interval.
=======================================================================================================================================================
Return to top. Table_11 Note: To print large tables and graphs users may have to change their printer settings to landscape and use a small font size.
TABLE 11. Percentage of adults who reported ever having been told by a health
professional that they had high blood cholesterol, by sex -- Behavioral Risk Factor
Surveillance System, 1995
===================================================================================
                         Men                  Women                   Total
                 -------------------    -------------------     -----------------
State              %   (+/-95% CI *)     %      (+/-95% CI)      %    (+/-95% CI)
---------------------------------------------------------------------------------
Alabama          18.2       (3.1)       16.8        (2.5)       17.5      (1.9)
Alaska           17.6       (4.3)       14.5        (3.3)       16.1      (2.8)
Arizona          17.5       (3.8)       19.4        (2.8)       18.5      (2.3)
Arkansas         15.1       (2.8)       21.1        (2.6)       18.3      (1.9)
California       16.7       (2.2)       20.1        (2.6)       18.4      (1.7)
Colorado         21.4       (3.3)       19.0        (2.3)       20.1      (2.1)
Connecticut      19.0       (3.1)       18.6        (2.5)       18.8      (2.0)
Delaware         18.8       (2.9)       22.0        (2.4)       20.5      (1.9)
Florida          20.6       (2.3)       25.3        (2.2)       23.1      (1.6)
Georgia          15.4       (2.4)       15.7        (2.3)       15.6      (1.6)
Hawaii           18.9       (2.9)       18.4        (2.7)       18.7      (1.9)
Idaho            18.7       (2.5)       20.3        (2.1)       19.5      (1.6)
Illinois         30.9       (4.9)       23.9        (3.4)       27.2      (2.9)
Indiana          18.9       (2.5)       21.4        (2.3)       20.2      (1.7)
Iowa             19.0       (2.2)       22.3        (1.9)       20.8      (1.5)
Kansas           18.6       (2.6)       24.5        (2.6)       21.7      (1.9)
Kentucky         16.3       (2.5)       21.4        (2.3)       19.0      (1.7)
Louisiana        14.9       (2.8)       19.4        (2.7)       17.3      (2.2)
Maine            16.7       (3.3)       22.6        (3.2)       19.8      (2.3)
Maryland         17.7       (1.7)       19.1        (1.5)       18.4      (1.1)
Massachusetts    23.3       (3.3)       24.1        (3.0)       23.7      (2.2)
Michigan         20.5       (2.6)       25.5        (2.4)       23.1      (1.8)
Minnesota        15.4       (1.9)       18.9        (1.7)       17.2      (1.3)
Mississippi      12.0       (2.6)       18.0        (2.5)       15.2      (1.9)
Missouri         17.4       (3.4)       21.7        (3.1)       19.6      (2.3)
Montana          18.0       (3.6)       20.6        (3.2)       19.3      (2.4)
Nebraska         17.1       (2.9)       20.3        (2.5)       18.8      (1.9)
Nevada           21.0       (3.2)       19.6        (2.6)       20.3      (2.1)
New Hampshire    18.1       (3.3)       22.0        (3.0)       20.1      (2.2)
New Jersey       18.0       (4.0)       17.9        (2.9)       17.9      (2.5)
New Mexico       19.0       (3.8)       20.2        (3.1)       19.6      (2.5)
New York         18.1       (2.6)       19.4        (2.3)       18.8      (1.8)
North Carolina   13.9       (1.9)       18.4        (1.8)       16.3      (1.3)
North Dakota     18.6       (2.8)       21.7        (2.8)       20.1      (2.0)
Ohio             17.4       (3.6)       18.2        (3.2)       17.8      (2.5)
Oklahoma         16.2       (2.9)       21.8        (2.8)       19.1      (2.1)
Oregon           19.8       (2.4)       22.0        (2.2)       20.9      (1.6)
Pennsylvania     21.6       (2.7)       21.4        (2.0)       21.5      (1.7)
Rhode Island     20.7       (3.1)       20.5        (2.8)       20.6      (2.1)
South Carolina   17.2       (2.8)       19.5        (2.7)       18.4      (1.9)
South Dakota     16.1       (2.7)       17.4        (2.5)       16.8      (1.8)
Tennessee        15.3       (2.6)       21.8        (2.5)       18.7      (1.8)
Texas            22.7       (3.7)       25.2        (2.9)       23.9      (2.3)
Utah             14.4       (2.5)       15.5        (2.1)       15.0      (1.6)
Vermont          19.5       (2.7)       19.8        (2.4)       19.7      (1.8)
Virginia         20.1       (3.3)       22.5        (2.9)       21.3      (2.2)
Washington       20.9       (2.3)       21.4        (2.1)       21.2      (1.5)
West Virginia    19.3       (2.7)       21.8        (2.3)       20.6      (1.7)
Wisconsin        19.6       (3.1)       22.1        (2.9)       20.9      (2.1)
Wyoming          17.9       (2.6)       19.2        (2.2)       18.6      (1.7)

Median           18.1                   20.4                    19.4

Low              12.0                   14.5                    15.0

High             30.9                   25.5                    27.2
---------------------------------------------------------------------------------
* Confidence interval.
===================================================================================
Return to top. Table_12 Note: To print large tables and graphs users may have to change their printer settings to landscape and use a small font size.
TABLE 12. Percentage of adults who reported having had their blood cholesterol tested, by
sex -- Behavioral Risk Factor Surveillance System, 1995
=======================================================================================================================================================
                                  Ever had blood cholesterol tested                          Had blood cholesterol tested in the past 5 years
                 -----------------------------------------------------------------    ---------------------------------------------------------------
                          Men                   Women                 Total                   Men                  Women                  Total
                 --------------------    -------------------    ------------------    ------------------    ------------------     ------------------
State             %     (+/-95% CI *)     %      (+/-95% CI)     %     (+/-95% CI)     %     (+/-95% CI)     %     (+/-95% CI)      %     (+/-95% CI)
-----------------------------------------------------------------------------------------------------------------------------------------------------
Alabama          61.0       (4.2)        67.9       (3.1)       64.7      (2.6)       57.3      (4.2)       64.7      (3.2)        61.3      (2.7)
Alaska           64.1       (5.2)        67.1       (4.6)       65.5      (3.5)       59.7      (5.3)       61.8      (4.8)        60.7      (3.6)
Arizona          67.4       (4.6)        72.3       (3.5)       69.9      (2.9)       63.7      (4.7)       69.1      (3.6)        66.4      (2.9)
Arkansas         62.4       (3.8)        66.2       (3.1)       64.4      (2.4)       59.5      (3.8)       63.2      (3.1)        61.5      (2.4)
California       60.0       (3.6)        71.9       (2.7)       66.0      (2.3)       56.4      (3.6)       68.5      (2.7)        62.5      (2.3)
Colorado         70.7       (3.7)        74.1       (3.1)       72.4      (2.4)       64.5      (3.8)       67.9      (3.2)        66.3      (2.5)
Connecticut      72.6       (3.7)        76.5       (2.9)       74.6      (2.4)       67.7      (3.8)       72.5      (3.1)        70.2      (2.5)
Delaware         68.3       (3.6)        69.8       (3.0)       69.1      (2.4)       65.7      (3.7)       67.2      (3.1)        66.5      (2.4)
Florida          72.3       (2.8)        76.7       (2.1)       74.6      (1.7)       69.4      (2.8)       74.6      (2.2)        72.1      (1.8)
Georgia          69.4       (3.3)        73.0       (2.8)       71.3      (2.2)       66.4      (3.4)       70.2      (2.8)        68.4      (2.2)
Hawaii           67.5       (3.5)        71.5       (3.1)       69.5      (2.3)       63.9      (3.6)       69.7      (3.1)        66.8      (2.4)
Idaho            66.8       (3.1)        72.5       (2.5)       69.7      (2.0)       62.4      (3.1)       66.2      (2.6)        64.4      (2.0)
Illinois         64.3       (4.6)        71.0       (3.5)       67.7      (2.9)       61.9      (4.7)       68.2      (3.6)        65.1      (2.9)
Indiana          64.9       (3.1)        69.2       (2.7)       67.2      (2.1)       59.8      (3.2)       64.8      (2.8)        62.4      (2.2)
Iowa             67.0       (2.7)        73.9       (2.2)       70.6      (1.7)       61.8      (2.8)       68.6      (2.3)        65.3      (1.8)
Kansas           66.2       (3.4)        70.9       (2.9)       68.6      (2.2)       62.5      (3.5)       65.4      (3.0)        64.0      (2.3)
Kentucky         61.7       (3.6)        67.6       (2.8)       64.8      (2.2)       57.1      (3.5)       63.8      (2.8)        60.6      (2.2)
Louisiana        64.5       (4.3)        67.3       (3.1)       66.0      (2.6)       61.3      (4.4)       65.0      (3.1)        63.3      (2.6)
Maine            61.7       (4.4)        72.4       (3.8)       67.3      (3.1)       57.9      (4.5)       68.2      (3.9)        63.3      (3.1)
Maryland         71.2       (2.3)        76.9       (1.7)       74.2      (1.4)       68.3      (2.3)       74.0      (1.8)        71.3      (1.5)
Massachusetts    73.7       (3.6)        78.4       (3.0)       76.2      (2.3)       70.3      (3.7)       75.3      (3.1)        72.9      (2.4)
Michigan         67.5       (3.2)        78.8       (2.3)       73.4      (1.9)       64.3      (3.2)       75.0      (2.4)        69.9      (2.0)
Minnesota        59.1       (2.5)        69.1       (2.1)       64.2      (1.7)       55.2      (2.5)       65.7      (2.2)        60.6      (1.7)
Mississippi      56.1       (4.4)        63.2       (3.5)       59.8      (2.8)       51.0      (4.4)       58.7      (3.5)        55.1      (2.8)
Missouri         65.3       (4.4)        72.2       (3.3)       69.0      (2.8)       62.0      (4.4)       65.2      (3.7)        63.7      (2.9)
Montana          67.3       (4.7)        70.1       (3.8)       68.8      (3.0)       59.1      (4.9)       64.2      (4.0)        61.7      (3.2)
Nebraska         63.0       (3.8)        70.0       (3.1)       66.7      (2.5)       56.1      (3.9)       62.9      (3.2)        59.6      (2.5)
Nevada           66.9       (3.9)        69.7       (3.3)       68.3      (2.6)       63.3      (4.0)       66.3      (3.4)        64.8      (2.6)
New Hampshire    72.2       (4.1)        79.4       (2.9)       75.9      (2.5)       66.6      (4.2)       75.1      (3.1)        71.0      (2.6)
New Jersey       72.7       (5.0)        74.2       (3.5)       73.5      (3.0)       69.3      (5.1)       72.1      (3.5)        70.8      (3.1)
New Mexico       62.1       (4.9)        69.3       (3.7)       65.8      (3.2)       58.9      (5.0)       65.8      (3.8)        62.4      (3.2)
New York         71.6       (3.2)        74.1       (2.6)       72.9      (2.1)       68.8      (3.2)       72.2      (2.6)        70.6      (2.1)
North Carolina   64.7       (2.9)        72.1       (2.3)       68.5      (1.9)       61.8      (2.9)       68.2      (2.4)        65.1      (1.9)
North Dakota     66.6       (3.6)        71.2       (3.1)       68.9      (2.4)       60.9      (3.7)       65.7      (3.3)        63.3      (2.5)
Ohio             62.5       (4.9)        64.4       (3.8)       63.5      (3.2)       59.1      (4.8)       62.4      (3.8)        60.8      (3.1)
Oklahoma         67.3       (3.9)        69.9       (3.4)       68.6      (2.6)       64.6      (4.0)       67.5      (3.5)        66.1      (2.7)
Oregon           67.1       (2.9)        75.2       (2.4)       71.3      (1.9)       61.8      (3.0)       70.3      (2.5)        66.1      (2.0)
Pennsylvania     68.6       (2.9)        72.9       (2.4)       70.9      (1.9)       63.8      (3.0)       68.7      (2.5)        66.4      (1.9)
Rhode Island     74.0       (3.6)        76.4       (3.0)       75.3      (2.3)       70.5      (3.7)       74.3      (3.1)        72.5      (2.4)
South Carolina   69.2       (3.6)        71.7       (3.1)       70.5      (2.4)       66.9      (3.6)       69.9      (3.1)        68.5      (2.4)
South Dakota     64.0       (3.6)        70.1       (3.1)       67.1      (2.4)       61.2      (3.7)       65.5      (3.2)        63.4      (2.5)
Tennessee        64.2       (3.8)        72.9       (2.9)       68.8      (2.3)       62.0      (3.7)       70.9      (3.0)        66.7      (2.4)
Texas            70.1       (4.2)        74.0       (3.1)       72.1      (2.6)       64.6      (4.3)       70.6      (3.2)        67.7      (2.7)
Utah             65.4       (3.5)        65.7       (3.0)       65.5      (2.4)       61.7      (3.5)       62.0      (3.0)        61.9      (2.4)
Vermont          69.9       (3.4)        74.3       (2.7)       72.2      (2.2)       65.5      (3.4)       68.6      (2.8)        67.1      (2.2)
Virginia         70.6       (3.7)        76.8       (2.9)       73.8      (2.3)       66.5      (3.9)       72.9      (3.0)        69.8      (2.4)
Washington       69.0       (2.6)        77.3       (2.1)       73.2      (1.7)       63.2      (2.7)       71.4      (2.3)        67.3      (1.8)
West Virginia    66.8       (3.5)        69.8       (2.7)       68.4      (2.2)       64.0      (3.5)       66.6      (2.8)        65.3      (2.2)
Wisconsin        67.7       (3.9)        73.9       (3.2)       70.9      (2.5)       63.0      (4.0)       68.2      (3.3)        65.7      (2.6)
Wyoming          64.2       (3.2)        69.4       (2.8)       66.8      (2.2)       60.0      (3.2)       65.8      (2.9)        62.9      (2.2)

Median           66.9                    72.0                   68.9                  62.5                  68.2                   65.3

Low              56.1                    63.2                   59.8                  51.0                  58.7                   55.1

High             74.0                    79.4                   76.2                  70.5                  75.3                   72.9
-----------------------------------------------------------------------------------------------------------------------------------------------------
* Confidence interval.
=======================================================================================================================================================
Return to top. Table_13 Note: To print large tables and graphs users may have to change their printer settings to landscape and use a small font size.
TABLE 13. Percentage of women with an intact uterine cervix who reported having had a
Papanicolaou (Pap) smear -- Behavioral Risk Factor Surveillance System, 1994 and 1995
==============================================================================================================
                                  Ever had a Pap smear                Had a Pap smear in the past 3 years
                       ------------------------------------------   ----------------------------------------
                                1994                   1995                  1994                  1995
                       --------------------   -------------------   ------------------    ------------------
State                    %    (+/-95% CI *)     %     (+/-95% CI)     %    (+/-95% CI)     %     (+/-95% CI)
------------------------------------------------------------------------------------------------------------
Alabama                94.0       (2.0)       94.9       (2.0)      85.5      (2.7)       85.0      (2.8)
Alaska                 95.4       (2.9)       95.7       (2.6)      89.8      (3.8)       90.9      (3.1)
Arizona                96.6       (1.5)       93.7       (2.4)      87.8      (3.4)       83.4      (3.7)
Arkansas               89.9       (2.6)       93.2       (2.1)      78.6      (3.3)       80.8      (3.2)
Colorado               96.6       (1.5)       97.4       (1.2)      87.6      (2.7)       87.6      (2.4)
Connecticut            92.5       (2.2)       93.8       (1.9)      84.9      (2.7)       86.8      (2.5)
Delaware               94.5       (1.8)       94.3       (1.7)      85.1      (2.5)       85.9      (2.4)
District of Columbia   91.0       (2.5)                             88.4      (2.6)
Florida                92.5       (1.6)       94.3       (1.5)      82.0      (2.2)       85.5      (2.1)
Georgia                95.8       (1.5)       95.2       (1.8)      90.7      (2.0)       89.2      (2.4)
Hawaii                 92.6       (2.2)       93.4       (2.1)      83.2      (3.1)       86.0      (2.8)
Idaho                  93.1       (2.3)       93.3       (1.8)      81.0      (3.2)       80.4      (2.5)
Illinois               90.7       (2.0)       89.3       (2.0)      85.1      (2.4)       81.9      (2.4)
Indiana                94.1       (1.8)       93.7       (1.9)      81.9      (2.7)       81.8      (2.5)
Iowa                   95.8       (1.4)       94.3       (1.4)      86.4      (2.3)       82.7      (2.1)
Kansas                 95.7       (1.9)       93.6       (2.1)      85.9      (2.9)       81.1      (3.0)
Kentucky               93.2       (1.8)       93.3       (1.7)      78.0      (2.7)       79.0      (2.7)
Louisiana              94.7       (1.9)       89.6       (2.6)      86.6      (2.7)       79.2      (3.4)
Maine                  95.4       (2.1)       93.4       (2.3)      89.5      (2.7)       87.0      (2.9)
Maryland               86.5       (2.1)       91.4       (1.5)      81.3      (2.2)       85.4      (1.7)
Massachusetts          93.8       (2.1)       92.6       (2.4)      85.5      (2.7)       84.7      (2.9)
Michigan               93.8       (1.7)       94.6       (1.4)      83.7      (2.5)       84.2      (2.2)
Minnesota              94.9       (1.1)       91.2       (1.5)      85.8      (1.7)       84.0      (1.8)
Mississippi            93.6       (2.3)       92.2       (3.1)      83.8      (3.2)       83.1      (3.6)
Missouri               94.3       (1.9)       94.4       (1.9)      82.8      (2.9)       83.4      (2.9)
Montana                95.3       (1.9)       94.3       (2.4)      84.5      (3.9)       81.8      (3.8)
Nebraska               92.3       (2.2)       91.9       (2.3)      79.7      (3.0)       82.2      (2.9)
Nevada                 93.7       (2.1)       92.9       (2.4)      83.4      (2.9)       83.2      (3.2)
New Hampshire          94.3       (2.1)       95.5       (2.0)      87.1      (2.8)       87.6      (3.0)
New Jersey             89.2       (2.6)       89.6       (2.7)      78.9      (3.3)       79.0      (3.5)
New Mexico             94.2       (2.3)       94.4       (2.2)      84.0      (3.2)       86.8      (3.1)
New York               90.1       (2.1)       88.5       (2.9)      81.5      (2.6)       80.5      (3.1)
North Carolina         94.4       (1.9)       95.4       (1.2)      86.4      (2.5)       86.6      (1.9)
North Dakota           94.6       (2.0)       93.1       (2.2)      83.0      (2.8)       82.9      (2.9)
Ohio                   93.2       (2.6)       93.8       (2.3)      83.3      (3.6)       84.6      (3.2)
Oklahoma               95.1       (2.2)       95.0       (2.0)      85.6      (3.0)       88.7      (2.6)
Oregon                 95.8       (1.3)       95.5       (1.5)      85.8      (2.2)       84.2      (2.4)
Pennsylvania           93.8       (1.3)       93.6       (1.5)      79.5      (2.1)       80.9      (2.3)
Rhode Island                                  93.3       (2.1)                            82.5      (3.0)
South Carolina         93.8       (1.9)       95.8       (1.8)      85.1      (2.6)       88.5      (2.5)
South Dakota           94.5       (1.9)       92.9       (2.2)      85.1      (2.7)       83.3      (2.9)
Tennessee              92.7       (1.7)       92.2       (1.9)      86.1      (2.1)       84.1      (2.6)
Texas                  93.6       (2.1)       92.3       (2.3)      84.7      (3.0)       82.7      (3.1)
Utah                   92.5       (2.5)       89.8       (2.9)      81.9      (3.2)       80.4      (3.3)
Vermont                95.7       (1.6)       94.3       (1.6)      85.6      (2.3)       85.4      (2.4)
Virginia               94.8       (2.0)       94.5       (2.1)      88.2      (2.7)       87.6      (2.8)
Washington             96.1       (1.2)       95.7       (1.4)      87.2      (1.9)       86.8      (2.0)
West Virginia          92.8       (1.8)       91.8       (2.2)      77.6      (2.9)       79.0      (2.8)
Wisconsin              94.5       (2.1)       95.0       (1.9)      82.6      (3.4)       83.7      (3.0)
Wyoming                96.0       (2.5)       95.6       (1.6)      80.7      (4.2)       80.5      (2.6)

Median                 94.1                   93.6                  84.9                  83.6

Low                    86.5                   88.5                  77.6                  79.0

High                   96.6                   97.4                  90.7                  90.9
------------------------------------------------------------------------------------------------------------
* Confidence interval.
==============================================================================================================
Return to top. Table_14 Note: To print large tables and graphs users may have to change their printer settings to landscape and use a small font size.
TABLE 14. Percentage of women who reported having had a mammogram -- Behavioral
Risk Factor Surveillance System, 1994 and 1995
==============================================================================================================
                                  Ever had a mammogram                Had a mammogram in the past 2 years
                                (women >=40 years of age)                  (women >=50 years of age)
                       ------------------------------------------   ----------------------------------------
                                1994                   1995                  1994                  1995
                       --------------------   -------------------   ------------------    ------------------
State                    %    (+/-95% CI *)     %     (+/-95% CI)     %    (+/-95% CI)     %     (+/-95% CI)
------------------------------------------------------------------------------------------------------------
Alabama                78.2       (3.4)       77.5       (3.7)      62.1      (4.6)       65.4      (4.8)
Alaska                 82.1       (5.3)       86.8       (4.7)      81.3      (7.2)       77.2      (8.1)
Arizona                84.2       (3.3)       86.0       (3.1)      70.2      (5.5)       77.3      (5.2)
Arkansas               71.2       (3.8)       72.4       (3.7)      55.1      (5.0)       61.3      (4.7)
Colorado               80.6       (3.9)       83.8       (3.2)      63.4      (5.9)       68.9      (4.8)
Connecticut            81.2       (3.3)       86.7       (3.1)      66.9      (4.8)       76.5      (4.5)
Delaware               86.7       (2.6)       85.4       (2.6)      75.6      (3.9)       73.6      (4.2)
District of Columbia   81.7       (3.8)                             71.5      (5.7)
Florida                81.3       (2.4)       84.3       (2.2)      71.8      (3.1)       76.9      (3.0)
Georgia                79.4       (3.3)       82.5       (3.2)      65.1      (4.8)       75.1      (4.4)
Hawaii                 83.3       (3.2)       86.6       (3.3)      80.0      (4.3)       76.3      (5.3)
Idaho                  77.8       (3.7)       80.3       (2.7)      61.2      (5.5)       66.8      (3.9)
Illinois               75.4       (3.2)       80.6       (2.7)      64.3      (4.2)       71.9      (3.5)
Indiana                76.7       (3.3)       79.7       (2.9)      60.9      (4.3)       66.6      (4.2)
Iowa                   81.9       (2.8)       80.6       (2.4)      68.4      (4.0)       66.1      (3.4)
Kansas                 77.3       (4.0)       77.2       (3.4)      70.0      (5.2)       65.8      (4.5)
Kentucky               72.4       (3.3)       80.0       (2.8)      55.7      (4.4)       63.6      (4.0)
Louisiana              69.7       (3.9)       73.8       (4.0)      60.4      (5.0)       62.6      (5.3)
Maine                  84.1       (3.5)       82.1       (3.8)      69.2      (5.3)       71.4      (5.6)
Maryland               81.5       (2.3)       84.7       (1.9)      72.1      (3.2)       77.4      (2.7)
Massachusetts          85.9       (3.2)       90.4       (2.6)      73.5      (5.0)       81.3      (4.3)
Michigan               86.3       (2.7)       87.7       (2.4)      73.2      (4.0)       79.3      (3.5)
Minnesota              83.3       (2.3)       81.2       (2.3)      71.7      (3.1)       71.1      (3.3)
Mississippi            70.6       (4.4)       72.6       (4.0)      54.2      (5.5)       53.9      (5.4)
Missouri               73.4       (4.0)       81.1       (3.4)      64.2      (4.9)       69.3      (5.2)
Montana                77.4       (5.0)       78.3       (4.3)      66.4      (6.2)       63.6      (6.2)
Nebraska               70.3       (3.7)       76.1       (3.5)      58.8      (4.6)       65.3      (4.6)
Nevada                 77.6       (3.5)       82.1       (3.4)      65.9      (4.9)       69.8      (4.8)
New Hampshire          85.0       (3.6)       84.5       (3.4)      68.8      (5.8)       75.5      (5.3)
New Jersey             77.0       (4.2)       78.4       (4.0)      64.9      (5.9)       63.3      (5.9)
New Mexico             80.1       (3.9)       82.2       (4.2)      67.8      (5.9)       71.9      (6.3)
New York               77.6       (3.3)       84.3       (2.9)      70.7      (4.2)       73.3      (4.2)
North Carolina         80.0       (3.2)       81.0       (2.5)      67.5      (4.4)       66.8      (3.5)
North Dakota           81.4       (3.4)       81.0       (3.4)      70.4      (4.7)       68.8      (4.6)
Ohio                   78.8       (3.8)       81.8       (3.8)      63.5      (5.9)       68.3      (5.5)
Oklahoma               73.7       (4.0)       74.3       (3.7)      57.5      (5.1)       61.8      (5.2)
Oregon                 85.7       (2.4)       85.9       (2.3)      73.8      (3.6)       77.2      (3.4)
Pennsylvania           77.0       (2.6)       82.2       (2.4)      65.7      (3.4)       62.7      (3.7)
Rhode Island                                  86.1       (3.2)                            70.5      (5.1)
South Carolina         80.0       (3.3)       81.7       (3.2)      68.1      (4.7)       71.8      (4.6)
South Dakota           75.3       (3.7)       75.6       (3.7)      66.1      (4.5)       62.7      (5.1)
Tennessee              77.0       (2.9)       79.5       (3.3)      63.0      (3.7)       67.6      (4.6)
Texas                  79.0       (4.2)       78.7       (4.0)      63.7      (6.1)       69.9      (5.2)
Utah                   79.6       (4.0)       81.9       (3.2)      70.8      (5.4)       67.3      (5.0)
Vermont                82.7       (2.6)       82.0       (2.8)      68.6      (4.1)       69.1      (4.2)
Virginia               82.4       (3.7)       83.4       (3.7)      71.5      (5.4)       70.7      (5.5)
Washington             85.5       (2.3)       85.9       (2.3)      76.8      (3.4)       75.7      (3.5)
West Virginia          74.6       (3.0)       77.6       (2.7)      60.8      (3.9)       64.3      (3.8)
Wisconsin              79.5       (4.2)       82.1       (3.5)      62.6      (6.1)       63.1      (5.3)
Wyoming                81.4       (4.1)       78.8       (3.1)      68.0      (5.7)       61.6      (4.7)

Median                 79.6                   81.8                  67.5                  69.2

Low                    69.7                   72.4                  54.2                  53.9

High                   86.7                   90.4                  81.3                  81.3
------------------------------------------------------------------------------------------------------------
* Confidence interval.
==============================================================================================================
Return to top. Table_15 Note: To print large tables and graphs users may have to change their printer settings to landscape and use a small font size.
TABLE 15. Percentage of women who reported having had a clinical breast examination
(CBE) -- Behavioral Risk Factor Surveillance System, 1994 and 1995
=============================================================================================================
                                    Ever had a CBE                       Had a CBE in the past 2 years
                               (women >=40 years of age)                   (women >=50 years of age)
                       -----------------------------------------   ----------------------------------------
                               1994                  1995                  1994                  1995
                       -------------------   -------------------   ------------------    ------------------
State                    %   (+/-95% CI *)     %     (+/-95% CI)     %    (+/-95% CI)      %    (+/-95% CI)
-----------------------------------------------------------------------------------------------------------
Alabama                86.0       (2.9)      86.9       (2.9)      67.8      (4.3)       70.8      (4.9)
Alaska                 93.5       (3.5)      92.7       (4.3)      83.6      (7.4)       76.2      (9.4)
Arizona                90.3       (2.8)      92.4       (2.3)      78.1      (4.6)       80.9      (4.6)
Arkansas               82.9       (3.3)      85.8       (2.8)      76.3      (3.2)       74.1      (4.2)
Colorado               93.1       (2.4)      89.3       (2.7)      71.0      (5.3)       72.3      (4.6)
Connecticut            93.2       (2.1)      88.7       (2.8)      79.5      (4.2)       74.8      (4.7)
Delaware               90.6       (2.4)      90.2       (2.3)      79.7      (4.0)       75.3      (4.3)
District of Columbia   90.4       (3.0)                            80.7      (4.8)
Florida                87.2       (2.1)      89.1       (2.2)      74.4      (3.1)       77.6      (3.1)
Georgia                89.2       (2.5)      92.6       (2.2)      75.9      (4.2)       82.3      (3.9)
Hawaii                 89.0       (2.9)      90.4       (2.6)      75.8      (4.9)       74.5      (5.3)
Idaho                  91.0       (2.7)      92.2       (1.8)      67.6      (5.4)       69.4      (3.7)
Illinois               87.1       (2.5)      87.3       (2.2)      77.5      (3.6)       76.9      (3.4)
Indiana                87.0       (2.6)      87.7       (2.3)      64.1      (4.3)       69.1      (3.9)
Iowa                   90.5       (2.0)      90.3       (1.7)      75.2      (3.9)       71.9      (3.0)
Kansas                 89.1       (2.8)      86.8       (2.7)      75.4      (4.9)       67.1      (4.5)
Kentucky               85.8       (2.3)      85.0       (2.4)      64.4      (4.1)       66.3      (3.9)
Louisiana              85.6       (3.3)      84.6       (3.1)      69.3      (4.9)       69.2      (5.2)
Maine                  92.1       (2.4)      93.3       (2.3)      78.7      (4.5)       80.7      (4.8)
Maryland               88.5       (1.9)      91.7       (1.4)      79.4      (2.9)       81.0      (2.5)
Massachusetts          90.1       (2.8)      93.3       (2.1)      74.7      (5.0)       83.8      (4.0)
Michigan               88.7       (2.2)      89.9       (2.2)      69.4      (4.2)       73.6      (3.8)
Minnesota              92.2       (1.6)      89.0       (1.9)      74.8      (3.1)       74.8      (3.1)
Mississippi            82.5       (3.4)      86.4       (2.9)      63.9      (5.2)       63.8      (5.2)
Missouri               91.5       (2.3)      89.3       (2.9)      70.4      (4.8)       68.3      (5.4)
Montana                92.1       (2.7)      94.1       (2.4)      75.9      (5.2)       68.7      (6.2)
Nebraska               89.5       (2.4)      89.5       (2.5)      68.1      (4.4)       70.6      (4.3)
Nevada                 87.2       (2.9)      88.9       (2.8)      66.9      (4.9)       69.0      (4.8)
New Hampshire          90.6       (2.7)      88.5       (2.9)      71.3      (5.7)       75.1      (5.2)
New Jersey             88.9       (3.4)      90.0       (3.0)      74.2      (5.5)       75.7      (5.1)
New Mexico             88.8       (3.2)      90.4       (3.3)      72.1      (5.3)       74.1      (5.9)
New York               89.0       (2.4)      90.8       (2.3)      76.7      (3.8)       81.9      (3.5)
North Carolina         91.2       (2.3)      91.4       (1.6)      76.9      (4.0)       74.9      (3.3)
North Dakota           92.5       (2.4)      90.7       (2.3)      72.0      (4.7)       72.4      (4.2)
Ohio                   89.1       (2.9)      92.1       (2.5)      72.8      (5.3)       76.9      (4.8)
Oklahoma               93.3       (2.3)      93.3       (1.9)      68.9      (4.7)       81.0      (3.9)
Oregon                 94.8       (1.5)      95.5       (1.5)      76.6      (3.6)       79.6      (3.5)
Pennsylvania           85.1       (2.2)      82.1       (2.6)      63.8      (3.4)       61.2      (3.8)
Rhode Island                                 90.1       (2.7)                            77.1      (4.5)
South Carolina         89.9       (2.5)      91.0       (2.5)      75.1      (4.1)       80.5      (4.2)
South Dakota           89.8       (2.3)      87.1       (3.0)      71.5      (4.4)       71.5      (4.8)
Tennessee              88.8       (2.1)      88.1       (2.5)      75.4      (3.3)       72.3      (4.4)
Texas                  84.6       (3.8)      88.4       (2.8)      67.5      (6.0)       70.0      (5.2)
Utah                   92.6       (2.4)      92.4       (2.1)      77.1      (4.8)       74.0      (4.8)
Vermont                87.6       (2.3)      88.6       (2.2)      71.8      (4.0)       73.2      (4.0)
Virginia               89.0       (2.9)      87.3       (3.0)      72.6      (5.1)       70.1      (5.2)
Washington             93.1       (1.6)      94.2       (1.7)      77.0      (3.4)       78.8      (3.4)
West Virginia          86.6       (2.3)      89.2       (2.1)      68.5      (3.8)       72.2      (3.6)
Wisconsin              90.3       (2.9)      92.2       (2.3)      72.9      (5.5)       71.0      (5.0)
Wyoming                91.1       (2.9)      90.1       (2.3)      69.3      (5.6)       64.1      (4.4)

Median                 89.7                  89.9                  73.6                  73.8

Low                    82.5                  82.1                  63.8                  61.2

High                   94.8                  95.5                  83.6                  83.8
-----------------------------------------------------------------------------------------------------------
* Confidence interval.
=============================================================================================================
Return to top. Table_16 Note: To print large tables and graphs users may have to change their printer settings to landscape and use a small font size.
TABLE 16. Percentage of women who reported having had both a mammogram and a
clinical breast examination (CBE) -- Behavioral Risk Factor Surveillance System, 1994 and
1995
===============================================================================================================
                              Ever had a mammogram and CBE        Had a mammogram and CBE in the past 2 years
                               (women >=40 years of age)                   (women >=50 years of age)
                       -----------------------------------------  -------------------------------------------
                               1994                  1995                  1994                  1995
                       -------------------   -------------------  -------------------    --------------------
State                    %   (+/-95% CI *)     %     (+/-95% CI)     %    (+/-95% CI)      %    (+/-95% CI)
-------------------------------------------------------------------------------------------------------------
Alabama                71.6       (3.8)      70.9       (4.1)      57.2      (4.7)       55.3      (5.2)
Alaska                 78.1       (5.8)      82.5       (5.6)      76.0      (8.1)       70.2      (9.5)
Arizona                79.9       (3.8)      81.6       (3.6)      65.2      (5.6)       70.8      (5.5)
Arkansas               64.2       (4.2)      66.4       (3.9)      48.4      (5.1)       55.1      (4.8)
Colorado               77.6       (4.2)      80.0       (3.1)      57.2      (6.0)       60.8      (5.1)
Connecticut            78.3       (3.5)      78.3       (3.6)      63.6      (4.9)       67.6      (5.1)
Delaware               81.2       (3.1)      79.3       (2.9)      70.4      (4.3)       65.9      (4.4)
District of Columbia   77.3       (4.2)                            66.8      (5.8)
Florida                74.9       (2.7)      78.1       (3.4)      64.1      (3.3)       69.2      (3.4)
Georgia                75.3       (3.4)      79.4       (3.7)      60.8      (4.9)       70.0      (4.6)
Hawaii                 76.3       (3.7)      80.3       (2.9)      69.4      (5.1)       67.1      (5.8)
Idaho                  74.9       (3.9)      76.2       (2.9)      54.7      (5.7)       57.9      (4.0)
Illinois               70.7       (3.3)      75.1       (2.9)      59.0      (4.3)       64.5      (3.7)
Indiana                70.3       (3.5)      72.9       (3.1)      51.6      (4.3)       55.8      (4.3)
Iowa                   77.7       (2.9)      76.6       (2.5)      63.0      (4.3)       58.4      (3.4)
Kansas                 74.4       (4.1)      72.3       (3.6)      64.7      (5.5)       57.0      (4.7)
Kentucky               68.9       (3.4)      73.4       (3.1)      52.0      (4.4)       55.9      (4.2)
Louisiana              64.9       (4.1)      67.6       (4.2)      54.1      (5.2)       54.0      (5.4)
Maine                  80.9       (3.7)      79.6       (3.9)      66.5      (5.4)       68.5      (5.7)
Maryland               77.7       (2.4)      80.4       (2.1)      68.1      (3.3)       71.8      (2.9)
Massachusetts          79.4       (3.7)      86.5       (2.9)      64.0      (5.5)       75.7      (4.7)
Michigan               78.5       (3.0)      81.3       (2.8)      62.1      (4.4)       67.6      (4.1)
Minnesota              80.1       (2.5)      77.3       (2.5)      66.3      (3.3)       66.1      (3.5)
Mississippi            63.7       (4.4)      66.5       (4.1)      48.9      (5.5)       47.5      (5.4)
Missouri               70.5       (4.0)      74.5       (3.8)      57.3      (5.1)       58.7      (5.7)
Montana                74.9       (5.2)      75.7       (4.5)      62.4      (6.4)       58.8      (6.4)
Nebraska               67.4       (3.8)      71.4       (3.8)      54.6      (4.7)       58.2      (4.8)
Nevada                 70.9       (3.9)      77.8       (3.6)      56.7      (5.2)       59.2      (5.1)
New Hampshire          80.2       (4.1)      78.8       (3.9)      62.7      (6.0)       64.9      (5.8)
New Jersey             71.9       (4.5)      74.2       (4.3)      56.7      (6.1)       57.8      (6.0)
New Mexico             75.5       (4.2)      77.4       (4.6)      62.6      (5.9)       64.5      (6.6)
New York               73.8       (3.4)      80.0       (3.2)      65.8      (4.3)       68.8      (4.4)
North Carolina         76.6       (3.3)      76.9       (2.6)      62.4      (4.6)       61.7      (3.6)
North Dakota           78.0       (3.7)      76.6       (3.6)      63.1      (5.1)       62.2      (4.8)
Ohio                   73.5       (4.1)      78.6       (4.0)      56.2      (6.1)       63.9      (5.7)
Oklahoma               71.9       (3.9)      72.2       (3.8)      54.4      (5.1)       58.9      (5.2)
Oregon                 82.9       (2.6)      83.5       (2.5)      65.4      (4.0)       70.4      (3.9)
Pennsylvania           69.4       (2.8)      71.4       (2.9)      54.2      (3.6)       51.1      (3.8)
Rhode Island                                 80.5       (3.6)                            62.2      (5.3)
South Carolina         75.7       (3.5)      78.8       (3.4)      62.6      (4.8)       68.4      (4.7)
South Dakota           71.1       (3.8)      72.1       (3.9)      59.8      (4.7)       57.1      (5.2)
Tennessee              73.0       (2.9)      74.1       (3.5)      58.6      (3.8)       58.7      (4.8)
Texas                  70.7       (4.7)      72.3       (4.2)      55.3      (6.3)       59.7      (5.6)
Utah                   76.0       (4.1)      78.6       (3.4)      65.2      (5.5)       61.4      (5.2)
Vermont                74.4       (3.0)      77.0       (3.1)      61.0      (4.4)       63.2      (4.3)
Virginia               74.7       (4.1)      75.4       (4.0)      63.3      (5.7)       58.1      (5.7)
Washington             81.5       (2.5)      82.7       (2.5)      68.9      (3.7)       69.4      (3.8)
West Virginia          70.0       (3.1)      73.2       (2.9)      54.7      (4.0)       58.8      (3.8)
Wisconsin              75.1       (4.4)      77.5       (3.8)      57.9      (6.2)       55.1      (5.5)
Wyoming                77.7       (4.3)      73.6       (3.5)      60.6      (6.0)       51.3      (4.7)

Median                 75.1                  77.2                  62.1                  61.5

Low                    63.7                  66.4                  48.4                  47.5

High                   82.9                  86.5                  76.0                  75.7
-------------------------------------------------------------------------------------------------------------
* Confidence interval.
===============================================================================================================
Return to top. Table_17 Note: To print large tables and graphs users may have to change their printer settings to landscape and use a small font size.
TABLE 17. Percentage of adults >=50 years of age who reported having had a
proctoscopic examination, by sex -- Behavioral Risk Factor Surveillance System, 1995
====================================================================================
                         Men                   Women                  Total
                 -------------------    --------------------    ------------------
State              %   (+/-95% CI *)      %      (+/-95% CI)     %     (+/-95% CI)
----------------------------------------------------------------------------------
Alabama          41.7       (6.6)       34.5        (5.2)       37.6      (4.1)
Alaska           46.3      (12.0)       34.8        (9.5)       41.0      (8.0)
Arizona          50.6       (7.5)       32.1        (5.4)       40.4      (4.5)
Arkansas         32.0       (5.5)       31.6        (4.5)       31.8      (3.6)
Colorado         42.0       (6.5)       34.3        (4.9)       37.8      (4.0)
Connecticut      51.1       (6.4)       41.8        (5.3)       46.0      (4.2)
Delaware         44.1       (6.1)       29.8        (4.4)       36.3      (3.9)
Florida          48.3       (4.4)       35.7        (3.4)       41.3      (2.8)
Georgia          53.3       (5.7)       40.0        (5.2)       45.8      (3.9)
Hawaii           46.8       (7.0)       32.9        (5.7)       39.4      (4.5)
Idaho            40.4       (5.1)       35.2        (4.2)       37.6      (3.2)
Illinois         40.6       (7.7)       28.4        (5.1)       33.8      (4.4)
Indiana          36.3       (5.2)       31.8        (4.0)       33.8      (3.2)
Iowa             36.3       (4.2)       39.4        (3.4)       38.0      (2.6)
Kansas           38.6       (5.7)       31.2        (4.3)       34.4      (3.5)
Kentucky         33.6       (5.5)       28.0        (3.8)       30.5      (3.2)
Louisiana        37.6       (7.2)       37.2        (5.4)       37.4      (4.3)
Maine            28.6       (6.3)       23.1        (5.2)       25.6      (3.9)
Maryland         38.5       (4.1)       26.9        (2.9)       32.2      (2.5)
Massachusetts    44.9       (6.7)       29.9        (5.2)       36.4      (4.2)
Michigan         48.6       (5.6)       38.4        (4.3)       42.9      (3.4)
Minnesota        55.4       (4.5)       46.8        (3.7)       50.7      (2.9)
Mississippi      36.2       (6.8)       34.7        (5.0)       35.3      (4.2)
Missouri         44.1       (6.9)       31.6        (5.0)       37.1      (4.2)
Montana          36.9       (7.6)       27.4        (5.8)       31.9      (4.7)
Nebraska         36.6       (6.0)       34.8        (4.6)       35.6      (3.6)
Nevada           38.8       (6.3)       34.7        (4.9)       36.7      (4.0)
New Hampshire    44.0       (7.4)       32.2        (5.4)       37.6      (4.4)
New Jersey       42.9       (8.8)       25.6        (5.4)       33.4      (5.1)
New Mexico       41.5       (7.6)       36.4        (6.4)       38.8      (4.9)
New York         41.6       (6.2)       27.4        (4.0)       33.5      (3.6)
North Carolina   39.0       (4.9)       28.2        (3.3)       33.0      (2.9)
North Dakota     46.1       (6.1)       35.9        (4.6)       40.6      (3.8)
Ohio             42.2       (8.1)       31.1        (6.1)       36.0      (4.9)
Oklahoma         19.8       (4.3)       23.0        (4.3)       21.5      (3.1)
Oregon           46.3       (5.1)       43.8        (4.2)       44.9      (3.4)
Pennsylvania     44.1       (5.5)       30.0        (3.4)       36.2      (3.2)
Rhode Island     41.7       (6.4)       27.4        (4.7)       33.3      (3.9)
South Carolina   38.7       (6.5)       31.2        (4.9)       34.5      (3.9)
South Dakota     43.6       (6.2)       41.9        (5.3)       42.7      (3.9)
Tennessee        36.9       (6.3)       27.4        (4.3)       31.7      (3.7)
Texas            42.9       (7.9)       36.2        (5.6)       39.3      (4.7)
Utah             43.5       (6.0)       36.0        (5.0)       39.3      (3.8)
Vermont          41.2       (5.6)       30.8        (4.0)       35.5      (3.4)
Virginia         54.0       (7.4)       35.9        (5.4)       44.1      (4.7)
Washington       49.2       (5.1)       46.3        (4.2)       47.6      (3.3)
West Virginia    37.3       (5.4)       27.8        (3.5)       31.8      (3.1)
Wisconsin        57.8       (6.6)       42.6        (5.5)       49.3      (4.3)
Wyoming          42.6       (5.7)       41.6        (4.7)       42.1      (3.7)

Median           41.9                   32.9                    37.1

Low              19.8                   22.9                    21.5

High             57.8                   46.8                    50.7
----------------------------------------------------------------------------------
* Confidence interval.
====================================================================================
Return to top. Table_18 Note: To print large tables and graphs users may have to change their printer settings to landscape and use a small font size.
TABLE 18. Percentage of adults >=65 years of age who reported ever having a pneumococcal
vaccination or having an influenza vaccination in the past 1 year -- Behavioral Risk Factor
Surveillance System, 1995
=======================================================================================================================================================
                                 Ever had a pneumococcal vaccination                           Had an influenza vaccination in the past 1 year
                 -----------------------------------------------------------------    ---------------------------------------------------------------
                         Men                    Women                  Total                  Men                  Women                  Total
                 -------------------     -------------------    ------------------    ------------------    ------------------     ------------------
State              %    (+/-95% CI *)     %      (+/-95% CI)     %     (+/-95% CI)     %     (+/-95% CI)     %     (+/-95% CI)      %     (+/-95% CI)
-----------------------------------------------------------------------------------------------------------------------------------------------------
Alabama          31.2       (9.2)        31.2       (6.2)       31.2      (5.1)       44.1      (9.6)       44.3      (6.9)        44.2      (5.7)
Alaska           37.6      (26.7)        44.4      (18.5)       41.1     (15.9)       37.3     (24.5)       60.6     (19.0)        49.4     (16.0)
Arizona          52.3      (10.2)        42.2       (7.5)       46.6      (6.2)       64.5      (9.5)       64.8      (7.4)        64.7      (5.8)
Arkansas         35.3       (8.5)        36.1       (6.4)       35.8      (5.2)       55.0      (8.8)       64.4      (6.1)        60.5      (5.0)
California       42.9       (8.1)        42.6       (5.5)       42.7      (4.7)       61.0      (8.4)       58.3      (5.6)        59.4      (4.8)
Colorado         42.1      (10.5)        46.3       (6.9)       44.6      (5.9)       66.7      (9.7)       65.4      (6.5)        65.9      (5.5)
Connecticut      34.6       (8.5)        38.4       (7.3)       36.9      (5.5)       67.4      (8.7)       58.8      (7.4)        62.3      (5.6)
Delaware         38.5       (7.6)        40.9       (6.4)       39.9      (4.7)       57.8      (8.0)       56.7      (6.6)        57.2      (5.1)
Florida          35.0       (5.7)        41.0       (4.7)       38.4      (3.6)       61.2      (5.4)       61.4      (4.7)        61.3      (3.6)
Georgia          38.2       (7.1)        37.6       (6.3)       37.8      (4.6)       41.3      (6.7)       49.9      (6.7)        46.6      (4.9)
Hawaii           38.6       (8.1)        42.2       (7.6)       40.5      (5.5)       59.7      (8.9)       64.3      (7.3)        62.1      (5.5)
Idaho            35.8       (7.3)        41.1       (5.5)       38.8      (4.4)       65.0      (7.5)       63.5      (5.4)        64.2      (4.4)
Illinois         25.3       (9.2)        30.6       (7.0)       28.3      (5.7)       56.4     (10.7)       58.5      (7.9)        57.6      (6.2)
Indiana          34.5       (7.1)        32.3       (5.3)       33.2      (4.4)       58.6      (8.1)       58.9      (5.6)        58.8      (4.7)
Iowa             41.9       (6.3)        44.7       (4.6)       43.6      (3.8)       64.0      (6.0)       61.9      (4.5)        62.8      (3.6)
Kansas           43.2       (8.5)        40.2       (6.2)       41.4      (5.1)       60.6      (8.4)       57.4      (6.4)        58.7      (5.1)
Kentucky         20.9       (6.0)        26.3       (4.7)       24.1      (3.7)       47.4      (7.3)       55.2      (5.2)        52.1      (4.3)
Louisiana        25.9       (8.8)        25.2       (6.0)       25.5      (5.1)       45.1     (10.2)       56.5      (7.6)        52.0      (6.1)
Maine            40.6      (10.5)        30.8       (7.9)       34.8      (6.4)       69.8      (9.9)       61.0      (8.0)        64.5      (6.4)
Maryland         29.2       (5.6)        34.2       (4.3)       32.2      (3.4)       54.8      (6.0)       59.1      (4.6)        57.3      (3.7)
Massachusetts    23.1       (8.3)        35.6       (7.3)       30.8      (5.6)       55.9      (9.6)       60.8      (7.4)        58.9      (5.9)
Michigan         34.2       (7.6)        41.5       (6.0)       38.5      (4.7)       53.8      (8.0)       58.8      (6.0)        56.7      (4.8)
Minnesota        37.6       (6.4)        40.3       (4.4)       39.2      (3.6)       62.8      (6.3)       62.9      (4.5)        62.9      (3.7)
Mississippi      39.9      (10.4)        37.9       (6.6)       38.7      (5.7)       53.5     (10.4)       58.7      (6.9)        56.7      (5.8)
Missouri         34.8      (11.1)        27.8       (6.6)       30.6      (6.0)       64.7     (11.0)       67.6      (6.6)        66.5      (6.0)
Montana          38.9      (10.0)        31.3       (7.7)       34.6      (6.3)       62.3     (10.9)       64.9      (8.3)        63.8      (6.4)
Nebraska         33.1       (7.8)        36.2       (5.7)       35.0      (4.5)       66.2      (7.5)       62.3      (5.8)        63.9      (4.6)
Nevada           37.6       (9.1)        39.8       (7.4)       38.8      (5.8)       49.3      (9.4)       53.7      (7.6)        51.7      (5.9)
New Hampshire    39.8      (10.9)        36.2       (8.2)       37.7      (6.5)       60.9     (10.6)       48.3      (8.9)        53.4      (6.7)
New Jersey       10.0       (7.4)        12.5       (7.4)       11.4      (4.5)       51.2     (13.4)       41.1      (8.2)        45.6      (7.5)
New Mexico       40.1      (10.5)        37.3       (9.4)       38.5      (7.1)       73.7     (10.6)       64.5      (9.1)        68.5      (7.0)
New York         24.6       (7.4)        26.4       (6.0)       25.7      (4.7)       59.6      (8.7)       53.6      (6.7)        55.9      (5.3)
North Carolina   31.8       (6.2)        30.0       (4.2)       30.7      (3.5)       50.2      (6.4)       53.6      (4.7)        52.2      (3.9)
North Dakota     35.6       (7.9)        29.5       (5.8)       32.1      (4.7)       55.6      (8.0)       57.8      (5.8)        56.9      (4.9)
Ohio             36.5      (10.7)        42.0       (8.5)       39.8      (6.8)       65.9     (10.3)       60.6      (8.3)        62.7      (6.5)
Oklahoma         35.3       (6.9)        37.8       (6.0)       36.8      (4.5)       57.5      (7.2)       63.0      (6.2)        60.8      (4.7)
Oregon           41.2       (7.0)        47.3       (5.7)       44.7      (4.4)       66.4      (6.6)       67.4      (5.2)        67.0      (4.1)
Pennsylvania     33.9       (9.1)        38.3       (5.3)       36.5      (4.8)       61.6      (7.6)       55.2      (5.2)        57.7      (4.4)
Rhode Island     30.1       (8.7)        28.6       (6.6)       29.2      (5.3)       70.6      (8.6)       62.5      (6.9)        65.6      (5.4)
South Carolina   26.9       (7.7)        25.1       (6.2)       25.8      (4.7)       48.4      (8.8)       50.4      (7.3)        49.6      (5.5)
South Dakota     28.9       (7.6)        32.8       (6.1)       31.1      (4.8)       57.0      (8.2)       62.0      (6.2)        59.9      (4.9)
Tennessee        31.9       (8.0)        28.0       (5.9)       29.5      (4.8)       68.6      (8.3)       59.4      (6.7)        63.0      (5.4)
Texas            39.4      (12.2)        45.0       (7.9)       42.7      (6.8)       53.8     (12.2)       58.2      (7.7)        56.4      (6.8)
Utah             43.5       (9.1)        40.7       (6.7)       41.9      (5.4)       69.3      (8.1)       70.6      (5.7)        70.0      (4.8)
Vermont          32.3       (7.8)        36.7       (5.9)       34.9      (4.7)       62.2      (8.4)       64.3      (5.8)        63.5      (4.9)
Virginia         31.5      (11.7)        43.5       (8.6)       38.7      (7.1)       49.2     (12.1)       54.7      (8.0)        52.5      (6.9)
Washington       38.8       (7.8)        48.5       (6.1)       44.4      (4.8)       64.7      (7.8)       67.7      (5.6)        66.4      (4.6)
West Virginia    34.9       (7.4)        36.9       (5.4)       36.1      (4.4)       51.2      (7.7)       54.3      (5.2)        53.0      (4.4)
Wisconsin        30.8       (8.4)        37.7       (7.2)       34.8      (5.5)       58.2      (9.5)       55.7      (7.4)        56.7      (5.9)
Wyoming          44.3       (8.4)        42.1       (6.3)       43.1      (5.1)       68.2      (7.9)       65.2      (6.3)        66.5      (5.0)

Median           35.3                    37.7                   36.8                  59.6                  59.2                   59.2

Low              10.0                    12.5                   11.4                  37.3                  41.1                   44.2

High             52.3                    48.5                   46.6                  73.6                  70.6                   70.0
-----------------------------------------------------------------------------------------------------------------------------------------------------
* Confidence interval.
=======================================================================================================================================================
Return to top. Figure_1 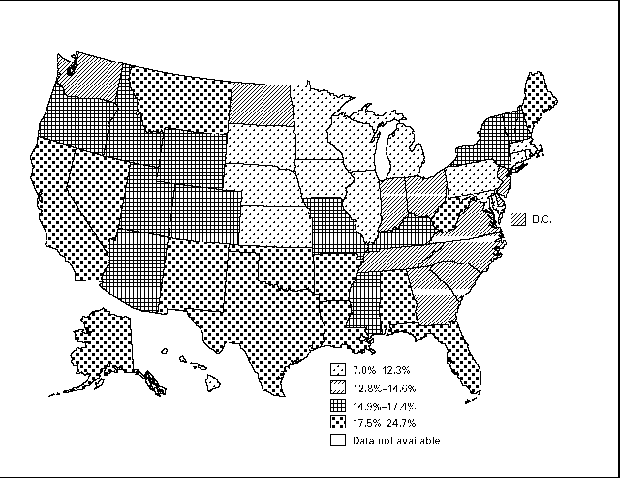 Return to top. Figure_2 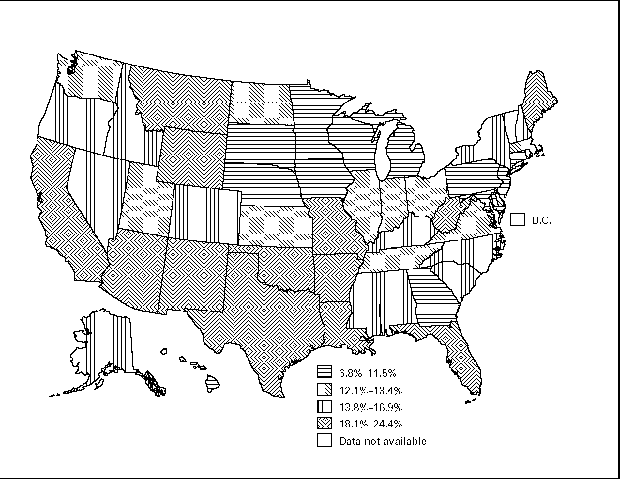 Return to top. Disclaimer All MMWR HTML versions of articles are electronic conversions from ASCII text into HTML. This conversion may have resulted in character translation or format errors in the HTML version. Users should not rely on this HTML document, but are referred to the electronic PDF version and/or the original MMWR paper copy for the official text, figures, and tables. An original paper copy of this issue can be obtained from the Superintendent of Documents, U.S. Government Printing Office (GPO), Washington, DC 20402-9371; telephone: (202) 512-1800. Contact GPO for current prices. **Questions or messages regarding errors in formatting should be addressed to mmwrq@cdc.gov.Page converted: 09/19/98 |
|||||||||
This page last reviewed 5/2/01
|