 |
|
|
|
|
|
|
| ||||||||||
|
|
|
|
|
|
|
||||
| ||||||||||
|
|
|
|
|
Persons using assistive technology might not be able to fully access information in this file. For assistance, please send e-mail to: mmwrq@cdc.gov. Type 508 Accommodation and the title of the report in the subject line of e-mail. State- and Sex-Specific Prevalence of Selected Characteristics- Behavioral Risk Factor Surveillance System, 1992 and 1993Emma L. Frazier, Ph.D. Catherine A. Okoro, M.S. Charlene Smith, M.S. David V. McQueen, Sc.D. Coordinators for the Behavioral Risk Factor Surveillance System (Appendix A) (Table_A) Behavioral Surveillance Branch Division of Adult and Community Health National Center for Chronic Disease Prevention and Health Promotion Abstract Problem/Condition: Much chronic disease and injury morbidity and mortality is associated with high-risk behaviors (e.g., cigarette smoking, excessive alcohol consumption, and physical inactivity) and with lack of preventive health care (e.g., screening for cancer). States use the Behavioral Risk Factor Surveillance System (BRFSS) to collect data about these modifiable health behaviors and to monitor trends and significant changes in their populations over time. Reporting Period: 1992 and 1993. Description of System: The BRFSS is a state-based telephone survey of the civilian, noninstitutionalized, adult (persons greater than or equal to 18 years of age) population. In 1992, 48 states and the District of Columbia participated in the BRFSS; in 1993, 49 states and the District of Columbia participated. Several questions were added to the BRFSS in 1993. Results: As in previous years, state-specific variations occurred in the prevalence of high-risk behaviors, awareness of certain medical conditions, use of preventive health services, and health-care coverage. In 1993, 4.0% (range: 1.4%-6.4%) of adults reported riding with a driver who had had too much alcohol to drink. The percentage of persons greater than or equal to 50 years of age who had ever had a proctoscopic examination ranged from 25.6% to 51.5% (median: 36.8%). Among adults greater than or equal to 65 years of age, 27.4% (range: 18.5%-40.0%) had ever had a pneumococcal vaccination, and 49.9% (range: 28.7%-66.2%) had had an influenza vaccination within the past 1 year. Interpretation: The variations in prevalence across states likely reflect socioeconomic differences, differences in state laws enacted to discourage risky behaviors, different levels of effort to screen for certain types of cancer or risk factors for other diseases, and other factors. Action Taken: States will continue to use the BRFSS to collect data about health behaviors. Analysis of these data will enable states to monitor factors that may affect the rate of chronic disease and injury mortality and morbidity and to develop public health policies to address these problems. INTRODUCTION Behaviors such as cigarette smoking, excessive alcohol consumption, and physical inactivity are major contributors to chronic disease and injury morbidity and mortality in the United States. Preventive health practices such as cholesterol screening, mammography, and proctoscopy can help identify early stages of and thus reduce the death rate from chronic diseases (e.g., heart disease, breast cancer, and prostate cancer). Increasing the use of screening for chronic diseases and reducing high-risk behaviors are among the goals of the year 2000 national health objectives (1). The Behavioral Risk Factor Surveillance System (BRFSS) is a continuous, state-based surveillance system that gathers information monthly about modifiable risk factors for chronic diseases and other leading causes of death. This system is used to measure achievement toward both the national health objectives (1) and specific state objectives. This report is the latest in a series that summarizes yearly BRFSS data. It presents state- and sex-specific data for 1992 and 1993 concerning a) risk factors for chronic diseases; b) factors that place persons at risk for injury; c) awareness of certain medical conditions that place persons at risk for developing chronic diseases; d) screenings related to cardiovascular diseases and cancer of the cervix, breast, and colon; e) vaccinations; and f) lack of health-care coverage (which is often a prerequisite for access to clinical preventive health services). The use, history, and rationale of the BRFSS have been previously described (2,3). In 1992, all states * except Arkansas and Wyoming participated in the BRFSS; Arkansas joined in 1993 (Appendix B) (Table_B). The data collected in 1992 and 1993 are presented separately; statistical comparisons between the 2 years of data were not made. METHODS Sampling Each state health department used random digit dialing to select samples of adults in households with telephones. The samples represented each state's civilian, noninstitutionalized, adult (persons greater than or equal to 18 years of age) population. Most states used three-stage cluster sampling based on the Waksberg method (4); other states used simple random, stratified random, or other sampling designs. Questionnaire The 1992 BRFSS questionnaire consisted of a) a core set of questions asked in all participating states, b) optional questions on selected topics developed by CDC and asked at the discretion of each state, and c) questions developed and asked in a particular state to meet a specific need for information. In 1993, two additional components were added to the BRFSS questionnaire: d) a rotating set of core questions asked every other year and e) questions addressing emerging health-care issues and requiring timely data collection. The rotating core question on leisure-time physical activity was asked by all participating states in 1992 but not in 1993. Rotating core questions for 1993 were about riding with a driver who had been drinking alcohol, colorectal cancer screening, and two kinds of vaccinations. Several changes were made to the questions asked in 1992 and 1993. In 1993, an introductory phrase about kinds of alcohol and when people drink was dropped, and gestational diabetes was excluded from the question on diabetes awareness. Changes in the questions on screening for cervical cancer and breast cancer were made both from 1991 to 1992 and from 1992 to 1993. The questions on cervical cancer screening were asked only of women with an intact uterine cervix. In 1992, the introduction to the questions on Papanicolaou (Pap) smears was "These next questions are about Pap smears. A Pap smear is a test where material is taken from the cervix, that is the mouth of the womb, to see if any cancer cells are present. Have you ever had a Pap smear?" In 1993, the introduction was simplified to "A Pap smear is a test for cancer of the cervix. Have you ever had a Pap smear?" In 1992, the introduction to the questions on mammograms was "I would like to ask you a few questions about a medical exam called a mammogram. A mammogram is an X-ray of the breast and involves pressing the breast between two plastic plates. Have you ever had a mammogram?" In 1993, the introduction was simplified to "A mammogram is an X-ray of the breast to look for cancer. Have you ever had a mammogram?" In 1992, the introduction to the questions on clinical breast examinations was "The next questions are about a clinical breast exam. During this exam, the breast is felt for lumps by a doctor, nurse, or other medical professional. Have you ever had a clinical breast exam?" In 1993, the introduction was simplified to "A clinical breast exam is when a doctor, nurse, or other health professional feels the breast for lumps. Have you ever had a clinical breast exam?" For comparability across studies, some BRFSS questions were based on those from the National Health Interview Survey (NHIS) or the National Health and Nutrition Examination Survey (NHANES). However, because these studies collected data by different means (BRFSS: telephone survey; NHIS: in-person interview; NHANES: physical examination), the phrasing of each question sometimes differed among surveys. Data Collection and Processing In each state, during the interview period in each month, BRFSS data were collected from the randomly selected population. When the monthly interviewing cycle ended, the data were sent to CDC. CDC edited the data and checked the reliability of the data collected. A computer-assisted telephone interviewing (CATI) system, which permits direct entry of data into a computer file during an interview, was used in 35 states in 1992 and 37 states in 1993. By facilitating data coding, data entry, and the monitoring of interviewers, CATI helps reduce errors in data collection. Data Weighting and Analysis CDC aggregated the edited monthly data files to create a yearly sample for each state. Each state's yearly data file was weighted to both the respondent's probability of selection and the age- and sex-specific or the race-, age-, and sex-specific population from the most current census data (or intercensal estimates) for each state (2,5). CDC used these weighted data to estimate the prevalence of risk factors for each state's population. SUDAAN, a software package for analyzing complex survey data, was used to calculate the standard errors and the 95% confidence intervals for the prevalence estimates (6). In 1992, the number of interviews completed in each state ranged from 1,188 to 3,988 (men: 515-1,802; women: 673-2,186). In 1993, the number of interviews completed ranged from 1,189 to 4,361 (men: 493-1,771; women: 696-2,590). Response rates for completed interviews ranged from 42.8% to 94.8% in 1992 and from 62.6% to 96.4% in 1993. RESULTS Risk Factors for Chronic Diseases Overweight A body mass index of greater than or equal to 27.8 kg/m2 for men and greater than or equal to 27.3 kg/m2 for women is considered overweight. These values approximate the sex-specific 85th percentile of body mass index estimated from NHANES II for persons 20-29 years of age in the United States. In 1992, the prevalence of adults who reported being overweight ranged from 17.3% in Colorado to 29.7% in Mississippi (median: 24.4%) (Table_1). In 1993, the prevalence of overweight adults ranged from 20.2% in Arizona and Hawaii to 31.7% in Mississippi (median: 25.5%). In both years, men were slightly more likely than women to report being overweight (1992: 25.2% vs. 23.1%; 1993: 26.9% vs. 24.4%). No Leisure-Time Physical Activity The question about lack of leisure-time physical activity (i.e., no exercise, recreation, or physical activities {other than regular job duties} during the previous month) was asked in all participating states in 1992 only. The percentage of adults who did not engage in any leisure-time physical activity varied by states nearly threefold, from 17.1% in Colorado to 48.1% in Mississippi (median: 27.4%) (Table_2). The median percentage of adults who reported no leisure-time physical activity was slightly lower for men (26.8%) than for women (29.8%). High Alcohol Consumption Until 1993, an introductory phrase about kinds of alcohol and when people drink was read before the questions on alcohol consumption were asked. In 1993, this introduction was dropped. Drinking Pattern I. In 1992 and 1993, the percentage of adults who reported binge drinking (i.e., consumption of five or more alcoholic beverages on at least one occasion during the previous month) varied approximately fivefold among states (Table_3). In 1992, this percentage ranged from 5.4% in Tennessee to 24.5% in Wisconsin (median: 14.3%); in 1993, it ranged from 4.2% in Tennessee to 22.8% in Wisconsin (median: 14.2%). Approximately three times as many men as women reported binge drinking in 1992 (21.9% vs. 6.9%) and 1993 (21.1% vs. 7.3%). Drinking Pattern II. In 1992, the percentage of adults who reported chronic drinking (i.e., consumption of 60 or more alcoholic beverages during the previous month) ranged from 1.7% in West Virginia to 6.8% in Nevada (median: 2.9%) (Table_4). In 1993, the prevalence of this drinking pattern ranged from 1.4% in Tennessee to 6.1% in Nevada (median: 3.0%). Men were more than six times as likely as women to report chronic drinking in 1992 (5.1% vs. 0.8%) and 1993 (5.3% vs. 0.8%). Cigarette Smoking Smoking Among Adults. The prevalence of adults who reported being current cigarette smokers and having smoked at least 100 cigarettes varied twofold among states (Table_5). In 1992, the prevalence ranged from 15.7% in Utah to 30.7% in Nevada (median: 23.0%), and in 1993, it ranged from 14.4% in Utah to 30.1% in Kentucky (median: 22.5%). The median prevalence of smoking was slightly higher for men than for women in 1992 (24.7% vs. 21.6%) and 1993 (23.9% vs. 21.1%). Smoking Among Young Adults. CDC's Office of Smoking and Health has used smoking prevalence among persons 20-24 years of age as an indicator of smoking initiation in the U.S. general population. However, because sample sizes for this narrow age group were likely to be small at the state level, the age span of 18-29 years was used for this question in the BRFSS. In addition, data from states that participated in the BRFSS in both 1992 and 1993 were aggregated to compensate for the small sample sizes and large confidence intervals that could occur from 1 year of state data. The percentage of young adults who reported being current cigarette smokers and having smoked at least 100 cigarettes ranged from 15.1% in the District of Columbia to 31.2% in Alaska (median: 24.8%) (Table_6). The smoking rate was similar for young men (25.6%) and young women (25.0%). In most states, the smoking rate for young adults was higher than that for all adults. Risk Factors for Personal Injury Safety Belt Use In 1992 and 1993, the percentage of adults who reported that they always wore a safety belt while driving or riding in a car varied more than threefold among states (Table_7). In 1992, the percentage ranged from 25.2% in South Dakota to 88.4% in Hawaii (median: 61.0%), and in 1993, it ranged from 24.9% in South Dakota to 89.8% in Hawaii (median: 62.6%). The median prevalence was more than 13 percentage points lower for men than for women in 1992 (55.0% vs. 68.4%) and 1993 (54.5% vs. 68.1%). Drinking and Driving In 1992, the percentage of adults who reported operating a motor vehicle at least once in the previous month after drinking too much alcohol ranged from 0.6% in North Carolina to 5.5% in Texas (median: 2.3%) (Table_8). In 1993, the precentage ranged from 0.8% in Maryland and Tennessee to 5.3% in Wisconsin (median: 2.4%). More than four times as many men as women reported this behavior in 1992 (3.9% vs. 0.9%) and 1993 (3.7% vs. 0.9%). Riding with a Driver Who Had Had Too Much Alcohol to Drink The question about riding, at least once during the past month, with a driver who had had too much alcohol to drink was asked in 1993 only. The percentage of adults who replied yes ranged from 1.4% in Oklahoma to 6.4% in Texas (median: 4.0%) (Table_9). A higher percentage of men (4.7%) than women (3.4%) reported this behavior. Awareness of Certain Medical Conditions Hypertension In 1992, the percentage of adults who reported ever having been told by a health professional that they had high blood pressure varied from 14.7% in New Mexico to 27.9% in Mississippi (median: 20.6%) (Table_10). In 1993, the percentage ranged from 16.8% in the District of Columbia to 29.8% in Mississippi (median: 21.7%). Slightly fewer men than women reported hypertension awareness in 1992 (19.6% vs. 21.8%) and 1993 (20.6% vs. 22.5%). Diabetes In 1992, the percentage of adults who reported ever having been told by a health professional that they had diabetes ranged from 2.8% in Alaska and Maine to 7.4% in the District of Columbia (median: 5.2%) (Table_11). In 1993, gestational diabetes was excluded from the question on diabetes awareness. In that year, the percentage of diabetes awareness ranged from 2.7% in Colorado to 6.3% in Mississippi (median: 4.5%). In both years, men were slightly less likely than women to report diabetes awareness (1992: 4.4% vs. 5.9%; 1993: 4.4% vs. 4.6%). High Blood Cholesterol In 1992, the percentage of adults who reported ever having been told by a health professional that they had high blood cholesterol ranged from 14.4% in Utah to 21.5% in West Virginia (median: 18.2%) (Table_12). In 1993, this percentage varied from 11.9% in the District of Columbia to 23.3% in Hawaii (median: 19.2%). In both years, fewer men than women reported awareness of high blood cholesterol (1992: 16.5% vs. 19.3%; 1993: 18.0% vs. 20.4%). Screening Cholesterol In 1992, the percentage of adults who reported ever having had their blood cholesterol tested ranged from 59.4% in Utah to 73.7% in Massachusetts (median: 67.3%) (Table_13). In 1993, the percentage ranged from 59.5% in Mississippi to 75.6% in Massachusetts (median: 67.9%). The median was lower for men than for women in 1992 (65.3% vs. 69.6%) and 1993 (65.5% vs. 70.3%). The percentage of adults who reported that they had had their blood cholesterol tested within the past 5 years varied from 58.4% in Utah to 72.6% in Massachusetts (median: 65.9%) in 1992 (Table_14). In 1993, this percentage varied from 57.0% in Mississippi to 73.4% in Massachusetts (median: 65.0%). The median was lower for men than for women in 1992 (63.5% vs. 68.1%) and 1993 (62.7% vs. 67.6%). Cervical Cancer In 1992 and 1993, the percentage of women who had ever had a Pap smear was greater than 84% in all states (Table_15). The percentage varied from 86.6% to 97.1% (median: 93.5%) in 1992 and from 84.3% to 96.6% (median: 93.7%) in 1993. In both years, the percentage of women who reported having had a Pap smear in the past 3 years for any reason was greater than 76% (Table_15). The percentage ranged from 76.2% to 89.8% (median: 83.2%) in 1992 and from 77.3% to 90.2% (median: 84.2%) in 1993. The proportion of women who had had a Pap smear in the previous 3 years as part of a routine checkup was 4.8 and 4.0 percentage points lower than that for any reason in 1992 and 1993, respectively. Breast Cancer Mammogram. In 1992, the percentage of women greater than or equal to 40 years of age who reported ever having had a mammogram varied from 57.3% to 82.3% (median: 74.0%) (Table_16). In 1993, the percentage varied from 68.5% to 85.7% (median: 77.9%). In 1992, 62.4% of women greater than or equal to 50 years of age reported that they had had a mammogram in the past 2 years for any reason (range: 44.3%-75.8%) (Table_16). In 1993, this value was 65.9% (range: 55.2%-74.6%). In 1992, the percentage of women who had had a mammogram in the past 2 years for routine reasons was 7.0 percentage points lower than that for having the mammogram for any reason; in 1993, this value was 5.7 percentage points lower. Clinical Breast Examination. In both 1992 and 1993, greater than 81% of women greater than or equal to 40 years of age reported ever having had a clinical breast examination (Table_17). In 1992, this percentage ranged from 81.5% to 96.0% (median: 87.9%); in 1993, the percentage varied from 81.6% to 95.0% (median: 89.8%). In 1992 and 1993, greater than 60% of women greater than or equal to 50 years of age reported that they had had a clinical breast examination in the past 2 years for any reason (Table_17). In 1992, the percentage ranged from 60.5% to 83.2% (median: 72.4%); in 1993, it ranged from 60.2% to 82.0% (median: 73.4%). In 1992, the percentage of women who reported having had a clinical breast examination in the past 2 years for routine reasons was 5.3 percentage points lower than that for any reason; in 1993, this value was 5.1 percentage points lower. Mammogram and Clinical Breast Examination. In 1992, the percentage of women greater than or equal to 40 years of age who had ever had both a mammogram and a clinical breast examination ranged from 54.6% to 78.9% (median: 70.5%) (Table_18). In 1993, this percentage ranged from 63.6% to 81.7% (median: 73.4%). In 1992, the combined use of mammography and clinical breast examination in the previous 2 years for any reason among women greater than or equal to 50 years of age varied from 39.2% to 70.2% (median: 55.9%) (Table_18). In 1993, this percentage ranged from 49.8% to 68.0% (median: 60.2%). The proportion of women who reported having had both a mammogram and clinical breast examination in the previous 2 years for routine reasons was 7.5 and 6.4 percentage points lower than that for any reason in 1992 and 1993, respectively. Colorectal Cancer Digital Rectal Examination. The questions on digital rectal examination were asked in 1993 only. In all but one state (Kentucky), more than one half of adults greater than or equal to 40 years of age reported that they had ever had this examination (Table_19). The percentage ranged from 48.6% in Kentucky to 81.9% in Alaska (median: 71.7%). This value was higher for men (75.5%) than for women (68.6%). The percentage of adults greater than or equal to 40 years of age who reported that they had had this examination in the previous 2 years ranged from 32.9% in Kentucky to 62.1% in Rhode Island (median: 51.3%) (Table_19). This value was higher for men (54.6%) than for women (49.0%). Proctoscopic Examination. The question on proctoscopic examination was asked in 1993 only. The percentage of adults greater than or equal to 50 years of age who reported that they had ever had this examination ranged from 25.6% in Tennessee to 51.5% in Minnesota (median: 36.8%) (Table_20). The rate was higher for men (39.9%) than for women (34.0%). Vaccination Pneumococcal Vaccination In 1993, the percentage of adults greater than or equal to 65 years of age who reported that they had ever had a pneumococcal vaccination ranged from 18.5% in Louisiana to 40.0% in Colorado (median: 27.4%) (Table_21). The percentage was slightly higher for men (28.7%) than for women (27.4%). Influenza Vaccination In 1993, the percentage of adults greater than or equal to 65 years of age who reported that they had had an influenza vaccination in the previous year ranged from 28.7% in the District of Columbia to 66.2% in Arizona (median: 49.9%) (Table_21). The value was about the same for men (50.6%) and women (50.4%). Lack of Health-Care Coverage In both 1992 and 1993, the percentage of adults 18-64 years of age who reported that they did not have any health-care coverage varied nearly fourfold (Figure_1) and (Figure_2). In 1992, the percentage varied from 7.6% to 28.8% (median: 15.9%), and in 1993, the percentage ranged from 6.8% to 25.5% (median: 14.9). For both years, the greatest prevalence of uninsured persons 18-64 years of age was in southern and southwestern states. Men were slightly more likely than women to have no health insurance in 1992 (16.9% vs. 15.1%) and 1993 (15.6% vs. 14.0%). DISCUSSION Reports on BRFSS data for 1984-1991 (7-12) and this report have demonstrated that the prevalence of health risk behaviors varies considerably among states. The variation between states may be attributable to differences in socioeconomic factors (e.g., per capita income, median number of years of education, and unemployment levels), different state laws enacted to discourage risky behaviors (e.g., driving under the influence of alcohol), different levels of effort to screen for certain types of cancer, and other factors. These variations illustrate why policy makers need state-specific data to address health problems in each state. The percentage of men and women who reported being overweight for the 1992 and 1993 BRFSS (approximately 25%) was lower than the estimated 34% obtained by direct measurements of height and weight from NHANES III, which was conducted between 1988 and 1991 (13). This difference may be a result of overweight adults underreporting their weight more often than do adults who are not overweight (14). Additionally, underreporting of weight is more common among women than among men (14). In the BRFSS, fewer women than men reported being overweight; however, in NHANES III, more women than men were found to be overweight (35% and 32%, respectively) (13). Because BRFSS data are self-reported, they may underestimate the true prevalence of overweight adults in the United States. Measuring the prevalence of physical activity has historically been limited by the lack of data about work-related physical activity. Examination of leisure-time physical activity only and exclusion of work and household activity may underestimate total physical activity (15). Thus, the BRFSS data about lack of leisure-time physical activity probably underestimate total physical activity among adults in the United States. In 1992 and 1993, the percentage of adults reporting alcohol consumption pattern I or II varied not only by state but also by sex. Other studies have also demonstrated the prevalence of these drinking patterns to vary by geographic region and sex (16,17). The BRFSS data also correspond closely with results from a study on per capita alcohol consumption estimated from alcohol sales data (18). The 1993 BRFSS median prevalence of adults who currently smoke cigarettes (22.5%) correlates closely with the 1993 NHIS estimate of 25% (19). The 1991 NHIS estimate that 22.9% of young adults 20-24 years of age are current smokers (20) is also similiar to the BRFSS 1992-1993 aggregate datum that 24.8% of young adults 18-29 years of age are current smokers. The highest prevalence of safety belt use was reported in states having safety-belt-use laws that permit primary enforcement. Primary enforcement allows a police officer to stop a driver for an observed violation of a safety-belt-use law only. Secondary enforcement requires a police officer to first stop the driver for another violation. Primary enforcement laws are associated with more frequent safety belt use than are secondary enforcement laws (21). Adults living in states with the highest rates of alcohol consumption are most likely to drive after drinking too much alcohol or to ride with a driver who had too much alcohol to drink. Thus, engaging in these drinking-related behaviors increases the risk for injury. Data about self-reported awareness of certain medical conditions (e.g., hypertension, diabetes, and high blood cholesterol) provide health-care providers and educators information about what people know about their medical condition. However, awareness does not indicate that these conditions are being treated or controlled, nor does it reflect the prevalence of risk factors for these conditions. These self-reported BRFSS data are likely lower than the true prevalence of these medical conditions because many persons may be unaware that they have such medical problems (22). The self-reported BRFSS data about the use of mammography and clinical breast examination are similar to estimates from the Jacobs Institute of Women's Health Mammography Attitudes and Usage Study (23) and the NHIS (13), which also are based on self-reported data. In 1992, the BRFSS study and the study conducted by the Jacobs Institute of Women's Health (23) indicated that 74% of women greater than or equal to 40 years of age had ever had a mammogram. The BRFSS estimates of the percentage of uninsured adults 18-64 years of age are slightly lower than those reported from the March 1993 Current Population Survey (24). The Current Population Survey includes persons in households without telephones. Persons without telephones in the household tend to be poorer and less educated than persons who have telephones (25). These persons may also be less likely to have health insurance (25). Thus, the finding that the percentage of uninsured adults is lower in the BRFSS than in the March 1993 Current Population Survey may reflect the fact that BRFSS data are collected only from persons in households with telephones. States can use BRFSS data about health insurance coverage to identify the sociodemographic characteristics of persons who do not have coverage and to compare the prevalence of health risk behaviors and the use of preventive health services among the insured and uninsured (25). For example, lack of mammography use is associated with lack of health insurance (25). This information also can be used by managed-care organizations in determining the best options for state populations and by policy makers in evaluating health-care reforms at the state level. The differences in self-reported behaviors and use of medical services must be interpreted cautiously on the basis of only these 2 years of state data. The apparent decreases or increases may reflect changes in the true prevalence of the population sampled. However, these changes could be artifactual because several factors, including wording changes in the questions on alcohol consumption and diabetes awareness; modifications in the definition of Pap smear, mammography, and clinical breast examination; shifts in the demographic composition of the sample population between 1992 and 1993; differences resulting from under- or overreporting of certain factors; and sampling and nonresponse errors. The extent of these possible effects probably is limited, but the effects can be assessed only after data from subsequent years are collected and analyzed. The BRFSS can provide the basis for developing or evaluating public health programs or policies designed to reduce the prevalence of health risk factors. BRFSS data have been useful in the development of state-specific health plans and continue to be valuable in evaluating progression toward national year 2000 health objectives and state health objectives. References
Table_1 Note: To print large tables and graphs users may have to change their printer settings to landscape and use a small font size.
TABLE 1. Percentage of adults who reported being overweight,* by sex -- Behavioral Risk
Factor Surveillance System, 1992 and 1993
======================================================================================================================================================
                                               1992                                                               1993
                  ---------------------------------------------------------------    ---------------------------------------------------------------
                          Men                  Women                  Total                  Men                  Women                  Total
                  -------------------    -----------------      -----------------    ------------------     -----------------      -----------------
State              %    (+/-95% CI +)     %    (+/-95% CI)       %    (+/-95% CI)     %     (+/-95% CI)      %    (+/-95% CI)       %    (+/-95% CI)
----------------------------------------------------------------------------------------------------------------------------------------------------
Alabama           23.7      (2.9)        21.9     (2.5)         22.7     (2.0)       26.2      (3.3)        22.9     (2.5)         24.5     (2.2)
Alaska            24.0      (4.5)        24.8     (4.1)         24.4     (3.1)       23.9      (4.7)        23.5     (3.9)         23.7     (3.1)
Arizona           18.3      (3.5)        20.6     (3.5)         19.5     (2.4)       21.0      (4.3)        19.5     (3.1)         20.2     (2.7)
Arkansas                                                                             31.8      (3.7)        28.6     (2.9)         30.1     (2.4)
California        23.2      (2.2)        21.5     (2.0)         22.3     (1.4)       24.8      (2.5)        24.3     (2.0)         24.5     (1.6)
Colorado          17.1      (2.9)        17.6     (2.5)         17.3     (2.0)       22.5      (3.3)        19.4     (2.7)         20.9     (2.2)
Connecticut       22.1      (3.3)        18.1     (2.5)         20.0     (2.0)       25.3      (3.5)        18.6     (2.5)         21.8     (2.2)
Delaware          24.2      (3.7)        26.0     (3.1)         25.1     (2.5)       28.1      (3.3)        25.2     (2.7)         26.6     (2.0)
District                                                                                                                              ,
  of Columbia     22.2      (3.7)        26.9     (3.3)         24.8     (2.5)       12.7      (2.7)        27.7     (3.3)         20.9     (2.4)
Florida           25.0      (2.7)        23.5     (2.4)         24.2     (1.8)       27.1      (2.7)        25.4     (2.2)         26.2     (1.8)
Georgia           21.6      (3.1)        25.3     (2.9)         23.5     (2.2)       23.6      (3.1)        24.6     (2.7)         24.1     (2.0)
Hawaii            23.5      (3.1)        16.2     (2.5)         19.9     (2.2)       22.4      (3.3)        18.0     (2.7)         20.2     (2.2)
Idaho             24.3      (3.1)        22.2     (2.7)         23.2     (2.2)       25.1      (4.1)        24.2     (2.9)         24.6     (2.5)
Illinois          27.4      (3.3)        24.9     (2.5)         26.1     (2.2)       25.5      (3.3)        25.7     (2.7)         25.6     (2.2)
Indiana           27.1      (2.9)        26.1     (2.4)         26.5     (2.0)       28.7      (3.3)        31.8     (3.1)         30.3     (2.2)
Iowa              30.5      (3.5)        23.6     (2.9)         26.9     (2.4)       31.7      (3.3)        24.7     (2.9)         28.0     (2.2)
Kansas            25.2      (3.5)        25.8     (3.3)         25.5     (2.5)       25.4      (3.5)        22.5     (3.1)         23.9     (2.4)
Kentucky          26.9      (3.1)        27.8     (2.7)         27.3     (2.0)       30.4      (3.1)        26.0     (2.5)         28.1     (2.0)
Louisiana         28.0      (3.5)        29.2     (2.9)         28.6     (2.4)       28.9      (3.9)        28.2     (2.9)         28.5     (2.4)
Maine             26.4      (3.9)        21.1     (3.3)         23.6     (2.5)       28.5      (4.1)        25.0     (3.5)         26.7     (2.7)
Maryland          24.9      (3.3)        24.1     (2.7)         24.5     (2.2)       25.1      (2.2)        24.7     (2.0)         24.9     (1.4)
Massachusetts     25.5      (3.7)        20.8     (3.1)         23.0     (2.4)       26.8      (3.7)        19.5     (2.7)         22.9     (2.4)
Michigan          31.5      (3.1)        26.8     (2.5)         29.0     (2.0)       29.6      (2.9)        27.9     (2.5)         28.7     (2.0)
Minnesota         26.8      (2.4)        22.1     (2.0)         24.4     (1.6)       29.0      (2.4)        25.2     (2.2)         27.0     (1.6)
Mississippi       26.8      (3.9)        32.2     (3.3)         29.7     (2.5)       30.3      (4.1)        32.9     (3.3)         31.7     (2.5)
Missouri          29.9      (4.1)        25.0     (3.1)         27.3     (2.5)       29.3      (3.7)        23.6     (3.1)         26.3     (2.4)
Montana           23.6      (4.1)        23.1     (3.5)         23.3     (2.7)       26.4      (4.3)        20.9     (3.5)         23.6     (2.7)
Nebraska          24.3      (3.5)        22.3     (2.9)         23.2     (2.2)       27.4      (3.3)        26.0     (2.9)         26.7     (2.2)
Nevada            24.7      (3.9)        19.9     (2.7)         22.3     (2.4)       25.5      (3.5)        21.1     (2.7)         23.3     (2.2)
New Hampshire     24.7      (3.3)        21.2     (3.1)         22.9     (2.4)       25.8      (3.5)        21.2     (3.1)         23.4     (2.4)
New Jersey        19.9      (3.5)        21.0     (3.1)         20.5     (2.4)       25.1      (3.7)        19.0     (2.9)         21.9     (2.4)
New Mexico        22.2      (3.9)        21.4     (3.1)         21.8     (2.5)       24.2      (3.7)        21.5     (3.3)         22.8     (2.5)
New York          26.2      (2.9)        23.3     (2.7)         24.7     (2.0)       28.5      (3.1)        22.6     (2.5)         25.3     (2.0)
North Carolina    26.1      (3.3)        22.8     (2.5)         24.4     (2.0)       28.4      (2.9)        25.3     (2.5)         26.8     (2.0)
North Dakota      28.0      (3.3)        27.2     (2.9)         27.6     (2.2)       30.5      (3.3)        24.0     (2.9)         27.2     (2.2)
Ohio              26.1      (3.9)        26.4     (3.5)         26.2     (2.5)       26.3      (3.9)        23.3     (3.1)         24.7     (2.5)
Oklahoma          26.6      (4.1)        25.7     (3.1)         26.1     (2.5)       25.7      (3.5)        28.2     (3.3)         27.0     (2.5)
Oregon            26.8      (2.4)        21.9     (2.0)         24.3     (1.6)       24.2      (2.5)        23.1     (2.4)         23.6     (1.8)
Pennsylvania      28.6      (2.9)        26.9     (2.5)         27.7     (2.0)       29.0      (2.9)        28.6     (2.5)         28.8     (2.0)
Rhode Island      23.5      (3.3)        22.8     (2.9)         23.1     (2.2)       25.4      (3.1)        21.5     (2.7)         23.4     (2.2)
South Carolina    26.6      (3.5)        24.2     (2.7)         25.3     (2.2)       29.3      (3.7)        27.1     (2.9)         28.2     (2.4)
South Dakota      27.9      (3.5)        21.3     (2.5)         24.5     (2.2)       29.6      (3.5)        26.3     (2.9)         27.9     (2.2)
Tennessee         26.0      (2.7)        22.1     (2.4)         23.9     (1.8)       27.1      (2.7)        27.5     (2.4)         27.3     (1.8)
Texas             24.3      (2.9)        26.2     (2.5)         25.3     (2.0)       28.9      (3.1)        23.5     (2.5)         26.1     (2.0)
Utah              22.8      (3.3)        20.5     (2.7)         21.6     (2.2)       24.4      (3.3)        20.6     (2.7)         22.5     (2.2)
Vermont           23.1      (2.9)        19.8     (2.5)         21.4     (2.0)       24.6      (3.3)        21.0     (2.5)         22.8     (2.2)
Virginia          25.5      (3.5)        21.9     (2.7)         23.6     (2.2)       29.2      (3.5)        22.0     (2.9)         25.5     (2.4)
Washington        22.6      (2.5)        18.8     (2.2)         20.7     (1.8)       27.5      (2.7)        24.6     (2.5)         26.0     (1.8)
West Virginia     30.8      (3.1)        28.4     (2.5)         29.5     (2.0)       31.2      (3.3)        31.1     (2.5)         31.1     (2.0)
Wisconsin         33.5      (3.9)        25.3     (3.3)         29.3     (2.5)       28.0      (3.7)        26.7     (3.3)         27.3     (2.5)

Median            25.2                   23.1                   24.4                 26.9                   24.4                   25.5
Low               17.1                   16.2                   17.3                 12.7                   18.0                   20.2
High              33.5                   32.2                   29.7                 31.8                   32.9                   31.7
----------------------------------------------------------------------------------------------------------------------------------------------------
* Body mass index >= 27.8 kg/m 2 for men and >= 27.3 kg/m 2 for women.
+ Confidence interval.
======================================================================================================================================================
Return to top. Table_2 Note: To print large tables and graphs users may have to change their printer settings to landscape and use a small font size.
TABLE 2. Percentage of adults who reported no leisure-time physical activity,*
by sex -- Behavioral Risk
Factor Surveillance System, 1992
                          Men                  Women                  Total
                  -------------------    -----------------      -----------------
State              %    (+/-95% CI +)     %    (+/-95% CI)       %    (+/-95% CI)
---------------------------------------------------------------------------------
Alabama           32.5      (3.5)        30.7     (2.9)         31.5     (2.4)
Alaska            19.6      (4.3)        25.9     (4.5)         22.5     (3.1)
Arizona           22.6      (3.7)        26.6     (3.9)         24.7     (2.7)
California        19.0      (2.2)        26.0     (2.0)         22.5     (1.4)
Colorado          15.3      (2.7)        18.9     (2.7)         17.1     (2.0)
Connecticut       28.1      (3.5)        31.3     (2.9)         29.7     (2.4)
Delaware          27.8      (4.1)        34.0     (3.3)         31.1     (2.7)
District                                                           ,
  of Columbia     33.5      (4.5)        42.4     (3.7)         38.3     (2.9)
Florida           24.3      (2.7)        29.2     (2.5)         26.9     (1.8)
Georgia           39.1      (3.7)        40.0     (3.5)         39.6     (2.5)
Hawaii            21.7      (3.5)        30.8     (3.5)         26.3     (2.5)
Idaho             21.2      (3.1)        19.3     (2.7)         20.2     (2.2)
Illinois          31.0      (3.5)        34.8     (2.9)         33.0     (2.2)
Indiana           18.9      (2.7)        29.8     (2.5)         24.6     (2.0)
Iowa              38.8      (3.7)        33.9     (3.3)         36.2     (2.5)
Kansas            26.7      (3.5)        31.0     (3.5)         28.9     (2.5)
Kentucky          38.6      (3.5)        44.2     (2.9)         41.6     (2.4)
Louisiana         32.4      (3.9)        37.2     (3.5)         34.9     (2.7)
Maine             40.7      (4.3)        33.3     (3.9)         36.8     (2.9)
Maryland          26.6      (3.3)        37.5     (3.1)         32.3     (2.4)
Massachusetts     18.6      (3.3)        24.8     (3.3)         21.9     (2.4)
Michigan          23.6      (2.9)        25.3     (2.5)         24.5     (2.0)
Minnesota         17.4      (2.2)        20.0     (2.0)         18.7     (1.6)
Mississippi       47.8      (4.3)        48.4     (3.5)         48.1     (2.7)
Missouri          31.2      (3.9)        33.1     (3.3)         32.2     (2.5)
Montana           17.0      (3.7)        18.7     (3.1)         17.9     (2.4)
Nebraska          27.2      (3.5)        26.4     (3.1)         26.8     (2.4)
Nevada            21.2      (3.7)        26.3     (3.1)         23.7     (2.5)
New Hampshire     22.2      (3.5)        25.4     (3.3)         23.9     (2.4)
New Jersey        29.9      (4.1)        34.5     (3.5)         32.3     (2.7)
New Mexico        26.8      (4.3)        31.9     (4.1)         29.5     (3.1)
New York          29.6      (3.1)        36.2     (2.9)         33.1     (2.2)
North Carolina    33.2      (3.3)        35.2     (2.9)         34.2     (2.4)
North Dakota      27.1      (3.5)        27.0     (2.9)         27.0     (2.4)
Ohio              31.3      (4.1)        33.5     (3.7)         32.5     (2.7)
Oklahoma          33.4      (4.3)        34.1     (3.3)         33.8     (2.9)
Oregon            19.4      (2.2)        21.0     (2.0)         20.2     (1.4)
Pennsylvania      23.6      (2.9)        28.7     (2.7)         26.3     (2.0)
Rhode Island      21.4      (3.3)        29.4     (3.3)         25.6     (2.4)
South Carolina    32.8      (3.9)        38.6     (3.5)         35.8     (2.5)
South Dakota      31.5      (3.7)        28.0     (2.9)         29.7     (2.4)
Tennessee         36.1      (3.1)        39.5     (2.7)         37.9     (2.2)
Texas             25.5      (3.1)        29.2     (2.7)         27.4     (2.2)
Utah              20.3      (3.1)        23.1     (2.7)         21.7     (2.2)
Vermont           27.4      (3.3)        24.2     (2.7)         25.7     (2.2)
Virginia          23.8      (3.5)        27.8     (3.1)         25.8     (2.4)
Washington        18.2      (2.5)        19.1     (2.2)         18.7     (1.6)
West Virginia     40.6      (3.5)        40.9     (2.7)         40.8     (2.4)
Wisconsin         23.2      (3.3)        22.6     (3.1)         22.9     (2.4)

Median            26.8                   29.8                   27.4
Low               15.3                   18.7                   17.1
High              47.8                   48.4                   48.1
---------------------------------------------------------------------------------
* No exercise, recreation, or physical activities (other than regular job duties) during the previous month.
+ Confidence interval.
Return to top. Table_3 Note: To print large tables and graphs users may have to change their printer settings to landscape and use a small font size.
TABLE 3. Percentage of adults who reported binge drinking, * by sex -- Behavioral Risk
Factor Surveillance System, 1992 and 1993
======================================================================================================================================================
                                               1992                                                                1993 +
                  ---------------------------------------------------------------     --------------------------------------------------------------
                          Men                  Women                  Total                   Men                  Women                 Total
                  -------------------    -----------------      -----------------     -----------------      -----------------     -----------------
State              %    (+/-95% CI &)     %    (+/-95% CI)       %    (+/-95% CI)      %    (+/-95% CI)       %    (+/-95% CI)      %    (+/-95% CI)
----------------------------------------------------------------------------------------------------------------------------------------------------
Alabama           17.9      (2.7)         5.2     (1.4)         11.2     (1.6)        13.7     (2.5)          3.4     (1.2)         8.2     (1.4)
Alaska            34.7      (5.5)        11.7     (3.3)         23.9     (3.5)        26.1     (4.7)         11.5     (3.5)        19.2     (3.1)
Arizona           12.0      (3.5)         6.3     (2.2)          9.0     (2.0)        15.8     (3.7)          4.8     (2.2)        10.2     (2.2)
Arkansas                                                                              18.0     (3.1)          3.8     (1.2)        10.5     (1.8)
California        26.9      (2.4)         8.6     (1.4)         17.7     (1.4)        23.7     (2.5)          7.6     (1.4)        15.6     (1.6)
Colorado          30.7      (3.5)         8.7     (2.0)         19.4     (2.2)        24.3     (3.3)          9.3     (2.0)        16.7     (2.2)
Connecticut       20.4      (3.3)         8.2     (2.0)         14.0     (2.0)        21.3     (3.3)          7.8     (1.8)        14.2     (1.8)
Delaware          24.0      (3.9)         6.0     (2.2)         14.6     (2.2)        21.2     (3.3)          7.8     (1.8)        14.2     (1.8)
District                                                                                                                              ,
  of Columbia     18.0      (3.7)         4.9     (1.6)         10.9     (2.0)        10.5     (2.9)          5.8     (2.2)         8.0     (1.8)
Florida           21.2      (2.7)         5.3     (1.2)         12.8     (1.6)        22.5     (2.5)          6.8     (1.2)        14.3     (1.4)
Georgia           11.0      (2.2)         4.0     (1.6)          7.3     (1.4)        16.3     (2.9)          5.5     (1.8)        10.6     (1.8)
Hawaii            28.2      (3.5)         7.5     (2.0)         17.7     (2.0)        25.2     (3.3)          5.2     (1.4)        15.1     (1.8)
Idaho             15.5      (2.9)         3.9     (1.4)          9.6     (1.6)        19.8     (3.7)          7.9     (2.0)        13.8     (2.2)
Illinois          22.7      (3.3)         6.7     (1.6)         14.3     (1.8)        19.8     (2.9)          8.3     (1.8)        13.7     (1.8)
Indiana           20.5      (2.7)         6.9     (1.6)         13.4     (1.6)        20.6     (2.9)          8.5     (2.0)        14.3     (1.8)
Iowa              16.2      (2.9)         6.6     (2.0)         11.1     (1.8)        19.8     (2.9)          5.8     (1.6)        12.5     (1.8)
Kansas            14.1      (2.9)         5.2     (2.0)          9.5     (1.8)        15.4     (2.9)          6.4     (2.0)        10.7     (1.8)
Kentucky          17.1      (2.9)         2.8     (1.0)          9.5     (1.6)        15.2     (2.4)          3.7     (1.2)         9.2     (1.4)
Louisiana         24.4      (3.5)         7.1     (2.0)         15.2     (2.0)        25.5     (3.7)          6.1     (1.8)        15.3     (2.0)
Maine             14.0      (3.3)         4.7     (1.8)          9.2     (1.8)        18.4     (3.9)          5.1     (1.8)        11.5     (2.2)
Maryland          14.7      (2.7)         3.3     (1.2)          8.7     (1.4)        15.0     (1.8)          4.4     (1.0)         9.5     (1.0)
Massachusetts     29.7      (3.9)        11.8     (2.5)         20.2     (2.4)        29.5     (3.9)         11.1     (2.4)        19.8     (2.4)
Michigan          28.4      (2.9)         9.6     (1.8)         18.6     (1.8)        27.1     (2.9)         10.5     (2.0)        18.5     (1.8)
Minnesota         30.2      (2.5)        10.6     (1.6)         20.1     (1.6)        27.7     (2.5)         11.2     (1.6)        19.2     (1.6)
Mississippi       18.8      (3.5)         4.1     (1.4)         10.9     (1.8)        14.5     (3.1)          3.3     (1.4)         8.5     (1.6)
Missouri          20.6      (3.3)         8.6     (2.0)         14.2     (2.0)        21.7     (3.3)          7.7     (2.0)        14.3     (2.0)
Montana           24.6      (4.3)        10.1     (2.4)         17.2     (2.5)        22.2     (3.9)          8.4     (2.4)        15.1     (2.4)
Nebraska          24.9      (3.7)         7.9     (2.0)         16.0     (2.2)        25.4     (3.3)          9.7     (2.0)        17.2     (2.0)
Nevada            31.9      (4.1)        10.0     (2.2)         21.1     (2.4)        27.4     (3.7)          9.7     (2.0)        18.7     (2.2)
New Hampshire     27.4      (3.9)        11.3     (2.9)         19.1     (2.4)        30.5     (3.9)         11.0     (2.5)        20.4     (2.4)
New Jersey        17.3      (3.3)         6.2     (1.8)         11.5     (2.0)        22.4     (3.7)          6.4     (2.0)        14.0     (2.2)
New Mexico        24.1      (4.5)         5.5     (1.8)         14.6     (2.5)        21.0     (3.7)          5.5     (1.8)        13.0     (2.2)
New York          21.3      (2.7)         6.4     (1.6)         13.4     (1.6)        20.8     (2.9)         10.0     (2.0)        15.1     (1.8)
North Carolina    14.4      (2.5)         2.8     (1.0)          8.4     (1.4)        14.0     (2.4)          2.8     (1.0)         8.1     (1.4)
North Dakota      24.7      (3.1)         8.7     (2.0)         16.6     (2.0)        26.1     (3.1)          9.2     (2.2)        17.5     (2.0)
Ohio              18.0      (3.5)         5.1     (2.0)         11.2     (2.0)        20.6     (4.1)          6.3     (2.0)        13.0     (2.4)
Oklahoma          17.4      (3.7)         4.1     (1.4)         10.4     (2.0)        10.8     (2.5)          4.1     (1.6)         7.3     (1.6)
Oregon            22.0      (2.4)         8.0     (1.4)         14.8     (1.4)        23.4     (2.5)          7.3     (1.6)        15.1     (1.4)
Pennsylvania      28.6      (3.1)         8.6     (1.8)         18.0     (1.8)        27.0     (2.9)          9.5     (1.8)        17.8     (1.8)
Rhode Island      27.8      (3.5)         9.0     (2.0)         17.8     (2.0)        28.6     (3.3)          9.7     (2.2)        18.6     (2.2)
South Carolina    16.7      (3.1)         4.5     (1.4)         10.3     (1.8)        16.5     (2.9)          3.5     (1.2)         9.7     (1.6)
South Dakota      24.2      (3.3)         7.4     (1.8)         15.6     (2.0)        19.4     (3.1)          7.8     (2.2)        13.4     (2.0)
Tennessee          9.3      (2.0)         1.9     (0.6)          5.4     (1.0)         6.9     (1.6)          1.8     (0.6)         4.2     (0.8)
Texas             29.9      (3.3)         9.1     (1.8)         19.2     (2.0)        27.5     (3.3)          7.6     (1.8)        17.3     (2.0)
Utah              16.4      (2.9)         5.2     (1.6)         10.7     (1.6)        17.2     (2.9)          6.8     (1.8)        11.9     (1.8)
Vermont           23.3      (3.1)         7.7     (1.8)         15.2     (1.8)        25.5     (3.5)          8.5     (2.0)        16.7     (2.0)
Virginia          21.9      (3.3)         8.5     (2.2)         15.0     (2.0)        20.8     (3.1)          7.4     (1.8)        13.9     (2.0)
Washington        24.2      (2.9)         9.3     (1.8)         16.6     (1.8)        23.6     (2.5)          7.2     (1.6)        15.2     (1.6)
West Virginia     15.4      (2.5)         3.0     (1.0)          8.8     (1.4)        11.6     (2.4)          3.1     (1.0)         7.1     (1.2)
Wisconsin         33.2      (3.9)        16.5     (2.9)         24.5     (2.5)        31.8     (3.7)         14.5     (2.7)        22.8     (2.4)

Median            21.9                    6.9                   14.3                  21.1                    7.3                  14.2
Low                9.3                    1.9                    5.4                   6.9                    1.8                   4.2
High              34.7                   16.5                   24.5                  31.8                   14.5                  22.8
----------------------------------------------------------------------------------------------------------------------------------------------------
* Consumption of five or more alcoholic beverages on at least one occasion (i.e., drinking pattern I) during the
  previous month.
+ Until 1993, an introductory phrase about kinds of alcohol and when people drink was read before the questions
  on alcohol consumption were asked. In 1993, this introduction was dropped.
& Confidence interval.
======================================================================================================================================================
Return to top. Table_4 Note: To print large tables and graphs users may have to change their printer settings to landscape and use a small font size.
TABLE 4. Percentage of adults who reported chronic drinking, * by sex -- Behavioral Risk
Factor Surveillance System, 1992 and 1993
========================================================================================================================================================
                                                1992                                                                1993 +
                   ---------------------------------------------------------------     ---------------------------------------------------------------
                           Men                  Women                  Total                   Men                  Women                 Total
                   -------------------    -----------------      -----------------     -----------------      -----------------     ------------------
State               %    (+/-95% CI &)     %    (+/-95% CI)       %    (+/-95% CI)      %    (+/-95% CI)       %    (+/-95% CI)      %     (+/-95% CI)
------------------------------------------------------------------------------------------------------------------------------------------------------
Alabama             3.5      (1.2)         0.3     (0.4)          1.8     (0.6)         3.4     (1.4)          0.5     (0.4)         1.9      (0.8)
Alaska              9.2      (3.7)         0.8     (0.6)          5.2     (2.0)         8.6     (2.9)          1.6     (1.2)         5.3      (1.6)
Arizona             3.0      (1.4)         0.8     (0.6)          1.9     (0.8)         3.9     (2.0)          0.8     (0.8)         2.3      (1.0)
Arkansas                                                                                5.0     (1.8)          0.8     (0.6)         2.8      (1.0)
California          7.4      (1.4)         1.3     (0.6)          4.3     (0.8)         7.8     (1.6)          1.8     (0.8)         4.7      (0.8)
Colorado            8.2      (2.0)         1.1     (0.6)          4.6     (1.0)         6.9     (2.2)          2.0     (1.0)         4.4      (1.2)
Connecticut         4.3      (1.6)         0.4     (0.4)          2.3     (0.8)         5.9     (2.0)          1.0     (0.6)         3.3      (1.0)
Delaware            6.4      (2.2)         1.1     (0.8)          3.6     (1.2)         6.6     (2.0)          1.0     (0.6)         3.7      (1.0)
District                                                                                                                               ,
  of Columbia       5.1      (2.0)         1.1     (0.8)          2.9     (1.0)         4.7     (2.0)          3.1     (1.6)         3.9      (1.2)
Florida             8.4      (2.2)         1.6     (0.8)          4.8     (1.2)         7.3     (1.6)          1.7     (0.6)         4.4      (0.8)
Georgia             3.2      (1.4)         0.5     (0.4)          1.8     (0.8)         5.1     (1.6)          0.4     (0.4)         2.7      (0.8)
Hawaii              9.6      (2.2)         1.8     (1.0)          5.7     (1.2)         9.1     (2.2)          1.0     (0.6)         5.0      (1.2)
Idaho               4.7      (1.6)         0.4     (0.4)          2.5     (0.8)         6.6     (2.5)          0.9     (0.6)         3.7      (1.2)
Illinois            4.7      (1.6)         0.9     (0.6)          2.7     (0.8)         6.3     (2.0)          1.0     (0.6)         3.5      (1.0)
Indiana             6.2      (1.8)         0.3     (0.2)          3.1     (0.8)         4.5     (1.4)          0.8     (0.8)         2.6      (0.8)
Iowa                5.0      (1.6)         0.4     (0.4)          2.6     (0.8)         4.7     (1.6)          0.4     (0.4)         2.4      (0.8)
Kansas              3.8      (1.6)         1.4     (1.2)          2.5     (1.0)         2.9     (1.6)          0.5     (0.4)         1.6      (0.8)
Kentucky            4.1      (1.4)         0.2     (0.2)          2.0     (0.6)         4.6     (1.4)          0.4     (0.4)         2.4      (0.6)
Louisiana           5.7      (1.8)         0.8     (0.6)          3.1     (1.0)         5.4     (2.0)          0.5     (0.4)         2.8      (1.0)
Maine               3.6      (1.8)         1.0     (0.8)          2.2     (1.0)         3.0     (1.6)          0.6     (0.6)         1.7      (0.8)
Maryland            4.3      (1.4)         0.8     (0.6)          2.5     (0.8)         3.1     (0.8)          0.7     (0.4)         1.9      (0.4)
Massachusetts       8.0      (2.4)         1.3     (0.8)          4.5     (1.2)         8.8     (2.5)          0.7     (0.6)         4.5      (1.4)
Michigan            8.7      (2.0)         1.0     (0.6)          4.7     (1.0)         7.0     (1.8)          0.9     (0.6)         3.8      (1.0)
Minnesota           7.7      (1.6)         1.2     (0.6)          4.3     (0.8)         6.0     (1.4)          0.6     (0.4)         3.2      (0.8)
Mississippi         5.0      (2.0)         0.4     (0.4)          2.5     (1.0)         5.2     (2.2)          0.6     (0.4)         2.7      (1.0)
Missouri            5.0      (1.8)         1.7     (1.0)          3.2     (1.0)         4.9     (1.8)          0.3     (0.2)         2.4      (0.8)
Montana             4.3      (2.0)         0.2     (0.4)          2.2     (1.0)         3.8     (1.8)          0.9     (0.6)         2.3      (1.0)
Nebraska            5.7      (2.0)         0.1     (0.2)          2.7     (1.0)         5.1     (1.8)          0.4     (0.4)         2.6      (0.8)
Nevada             11.2      (2.7)         2.1     (1.2)          6.8     (1.6)        10.0     (2.4)          2.1     (1.0)         6.1      (1.4)
New Hampshire       6.4      (2.0)         0.2     (0.4)          3.2     (1.0)         7.2     (2.0)          1.6     (1.2)         4.3      (1.2)
New Jersey          3.5      (1.8)         1.3     (0.8)          2.3     (1.0)         5.4     (1.8)          0.8     (0.6)         3.0      (1.0)
New Mexico          5.1      (2.0)         0.7     (0.6)          2.8     (1.0)         6.4     (2.2)          1.0     (0.6)         3.6      (1.0)
New York            4.9      (1.4)         1.2     (0.8)          2.9     (0.8)         5.3     (1.6)          0.9     (0.6)         3.0      (0.8)
North Carolina      6.4      (1.8)         0.8     (0.6)          3.5     (1.0)         5.0     (1.6)          0.4     (0.4)         2.6      (0.8)
North Dakota        4.1      (1.6)         0.8     (0.6)          2.4     (0.8)         3.5     (1.4)          0.7     (0.6)         2.1      (0.8)
Ohio                6.3      (2.5)         0.4     (0.4)          3.2     (1.2)         4.1     (1.8)          1.0     (0.6)         2.5      (1.0)
Oklahoma            3.4      (1.8)         0.4     (0.4)          1.9     (0.8)         3.1     (1.4)          1.8     (1.2)         2.4      (1.0)
Oregon              7.1      (1.4)         1.3     (0.6)          4.1     (0.8)         7.5     (1.6)          1.4     (0.6)         4.4      (0.8)
Pennsylvania        7.6      (2.0)         1.5     (0.8)          4.4     (1.0)         7.1     (1.8)          0.9     (0.6)         3.8      (0.8)
Rhode Island       10.1      (2.4)         1.5     (0.8)          5.5     (1.2)         8.4     (2.4)          1.5     (1.0)         4.7      (1.2)
South Carolina      4.2      (1.6)         0.4     (0.4)          2.2     (0.8)         5.0     (1.6)          0.2     (0.2)         2.4      (0.8)
South Dakota        5.2      (1.8)         0.2     (0.4)          2.6     (1.0)         2.8     (1.2)          0.7     (0.6)         1.7      (0.8)
Tennessee           3.4      (1.2)         0.5     (0.4)          1.9     (0.6)         2.6     (1.0)          0.4     (0.4)         1.4      (0.4)
Texas               9.3      (2.0)         1.5     (0.6)          5.3     (1.0)         9.0     (2.4)          1.0     (0.6)         4.9      (1.2)
Utah                5.1      (1.6)         0.7     (0.6)          2.8     (0.8)         2.4     (1.2)          0.7     (0.6)         1.6      (0.6)
Vermont             7.5      (2.0)         0.7     (0.6)          4.0     (1.2)         7.0     (2.4)          0.9     (0.6)         3.8      (1.2)
Virginia            4.2      (1.6)         1.1     (0.8)          2.6     (0.8)         6.5     (2.0)          0.7     (0.6)         3.5      (1.0)
Washington          6.6      (1.8)         1.2     (0.6)          3.9     (1.0)         5.5     (1.4)          0.6     (0.4)         3.0      (0.8)
West Virginia       3.3      (1.2)         0.3     (0.2)          1.7     (0.6)         4.2     (1.4)          0.3     (0.2)         2.2      (0.6)
Wisconsin           7.6      (2.0)         1.6     (1.0)          4.5     (1.2)         7.6     (2.2)          1.1     (0.8)         4.3      (1.2)

Median              5.1                    0.8                    2.9                   5.3                    0.8                   3.0
Low                 3.0                    0.1                    1.7                   2.4                    0.2                   1.4
High               11.2                    2.1                    6.8                  10.0                    3.1                   6.1
------------------------------------------------------------------------------------------------------------------------------------------------------
* Consumption of 60 or more alcoholic beverages (i.e., drinking pattern II) during the previous month.
+ Until 1993, an introductory phrase about kinds of alcohol and when people drink was read before the questions
  on alcohol consumption were asked. In 1993, this introduction was dropped.
& Confidence interval.
========================================================================================================================================================
Return to top. Table_5 Note: To print large tables and graphs users may have to change their printer settings to landscape and use a small font size.
TABLE 5. Percentage of adults who reported cigarette smoking, * by sex -- Behavioral Risk
Factor Surveillance System, 1992 and 1993
======================================================================================================================================================
                                               1992                                                               1993
                  ---------------------------------------------------------------    ---------------------------------------------------------------
                          Men                  Women                  Total                  Men                  Women                  Total
                  -------------------    -----------------    -------------------    ------------------     -----------------      -----------------
State              %    (+/-95% CI +)     %    (+/-95% CI)       %    (+/-95% CI)     %     (+/-95% CI)      %    (+/-95% CI)       %    (+/-95% CI)
----------------------------------------------------------------------------------------------------------------------------------------------------
Alabama           25.0      (3.1)        19.2     (2.4)         21.9     (2.0)       21.4      (2.9)        16.0     (2.2)         18.5     (1.8)
Alaska            28.6      (4.9)        29.1     (4.7)         28.8     (3.3)       28.1      (4.7)        25.0     (4.5)         26.6     (3.3)
Arizona           22.0      (4.3)        17.3     (3.1)         19.5     (2.5)       21.9      (4.3)        19.6     (3.5)         20.7     (2.7)
Arkansas                                                                             29.8      (3.7)        23.4     (2.9)         26.4     (2.4)
California        22.4      (2.2)        17.9     (1.8)         20.1     (1.4)       19.8      (2.4)        17.1     (2.0)         18.4     (1.4)
Colorado          25.3      (3.1)        22.4     (2.7)         23.8     (2.2)       25.1      (3.5)        22.5     (2.7)         23.8     (2.2)
Connecticut       23.2      (3.3)        21.5     (2.7)         22.3     (2.2)       21.9      (3.3)        19.5     (2.5)         20.6     (2.2)
Delaware          32.2      (4.1)        23.9     (2.9)         27.9     (2.5)       28.2      (3.5)        24.0     (2.7)         26.0     (2.2)
District
  of Columbia     21.3      (3.5)        18.5     (3.3)         19.7     (2.4)       18.8      (3.9)        14.3     (2.9)         16.4     (2.4)
Florida           24.9      (2.7)        20.6     (2.2)         22.6     (1.8)       23.9      (2.5)        20.3     (2.2)         22.0     (1.6)
Georgia           22.6      (3.1)        16.5     (2.4)         19.4     (2.0)       27.0      (3.1)        21.1     (2.5)         23.9     (2.0)
Hawaii            23.2      (3.3)        16.7     (2.5)         19.9     (2.2)       19.9      (2.9)        17.8     (2.5)         18.9     (2.0)
Idaho             22.2      (3.3)        16.7     (2.4)         19.4     (2.0)       21.4      (3.7)        19.0     (2.7)         20.2     (2.4)
Illinois          27.5      (3.5)        22.1     (2.5)         24.7     (2.2)       24.4      (3.3)        22.1     (2.5)         23.2     (2.0)
Indiana           29.8      (3.3)        25.5     (2.5)         27.5     (2.2)       26.7      (3.3)        26.1     (2.7)         26.4     (2.2)
Iowa              24.0      (3.1)        16.5     (2.5)         20.0     (2.0)       22.5      (3.1)        21.5     (2.9)         22.0     (2.2)
Kansas            24.7      (3.7)        21.3     (2.9)         23.0     (2.4)       22.1      (3.3)        18.5     (2.7)         20.2     (2.2)
Kentucky          32.2      (3.5)        25.0     (2.5)         28.4     (2.2)       31.6      (3.1)        28.7     (2.7)         30.1     (2.2)
Louisiana         28.2      (4.1)        21.6     (2.7)         24.7     (2.4)       25.2      (3.9)        19.9     (2.7)         22.4     (2.4)
Maine             25.6      (4.1)        22.1     (3.3)         23.8     (2.7)       26.7      (4.1)        22.9     (3.5)         24.7     (2.5)
Maryland          21.4      (3.3)        20.4     (2.5)         20.8     (2.2)       20.9      (2.2)        18.7     (1.8)         19.7     (1.4)
Massachusetts     25.5      (3.7)        21.8     (3.1)         23.6     (2.4)       20.6      (3.3)        21.6     (2.9)         21.2     (2.2)
Michigan          25.8      (2.9)        24.8     (2.5)         25.3     (2.0)       26.9      (3.1)        23.4     (2.5)         25.1     (2.0)
Minnesota         23.8      (2.4)        20.4     (2.0)         22.0     (1.6)       23.9      (2.4)        21.0     (2.0)         22.4     (1.6)
Mississippi       27.7      (3.9)        21.7     (2.7)         24.5     (2.4)       29.9      (3.9)        19.0     (2.7)         24.1     (2.4)
Missouri          25.6      (3.7)        22.0     (3.1)         23.7     (2.4)       29.2      (3.9)        24.3     (3.1)         26.6     (2.5)
Montana           19.2      (3.7)        19.3     (3.1)         19.3     (2.4)       21.5      (3.7)        19.4     (3.3)         20.4     (2.5)
Nebraska          19.5      (3.1)        16.0     (2.5)         17.7     (2.0)       22.6      (3.1)        21.4     (2.7)         22.0     (2.2)
Nevada            30.7      (4.1)        30.7     (3.3)         30.7     (2.7)       29.4      (3.7)        30.5     (3.1)         30.0     (2.4)
New Hampshire     23.7      (3.7)        22.7     (3.3)         23.2     (2.5)       22.4      (3.3)        18.9     (2.9)         20.6     (2.2)
New Jersey        20.9      (3.5)        19.6     (2.9)         20.2     (2.4)       20.2      (3.5)        17.8     (2.7)         18.9     (2.2)
New Mexico        22.5      (3.9)        18.3     (3.1)         20.4     (2.5)       24.0      (3.9)        19.7     (3.3)         21.8     (2.5)
New York          23.6      (2.9)        22.3     (2.5)         22.9     (2.0)       26.2      (2.9)        21.1     (2.5)         23.5     (2.0)
North Carolina    31.2      (3.3)        22.7     (2.5)         26.7     (2.2)       28.6      (3.1)        23.2     (2.5)         25.8     (2.0)
North Dakota      26.1      (3.3)        20.3     (2.7)         23.2     (2.2)       20.7      (2.9)        18.6     (2.5)         19.6     (2.0)
Ohio              26.0      (3.9)        22.1     (3.3)         23.9     (2.5)       26.1      (4.1)        24.6     (3.1)         25.3     (2.5)
Oklahoma          29.0      (4.3)        24.5     (3.1)         26.7     (2.5)       29.7      (3.9)        23.8     (3.1)         26.6     (2.5)
Oregon            21.1      (2.4)        21.1     (2.0)         21.1     (1.6)       22.3      (2.5)        20.9     (2.2)         21.6     (1.6)
Pennsylvania      25.1      (2.9)        24.3     (2.5)         24.7     (2.0)       22.3      (2.7)        22.9     (2.4)         22.6     (1.8)
Rhode Island      24.3      (3.1)        20.9     (2.7)         22.5     (2.2)       25.8      (3.3)        21.1     (2.9)         23.3     (2.4)
South Carolina    31.6      (3.7)        24.2     (2.9)         27.8     (2.4)       28.3      (3.9)        20.5     (2.5)         24.2     (2.4)
South Dakota      23.3      (3.3)        21.6     (2.7)         22.4     (2.2)       22.1      (3.1)        20.1     (2.7)         21.1     (2.2)
Tennessee         30.7      (2.9)        23.5     (2.2)         26.9     (1.8)       28.9      (2.7)        23.9     (2.2)         26.3     (1.8)
Texas             25.9      (3.1)        19.1     (2.4)         22.4     (2.0)       26.7      (3.5)        21.1     (2.5)         23.8     (2.2)
Utah              19.5      (2.9)        12.2     (2.2)         15.7     (2.0)       15.5      (2.5)        13.5     (2.2)         14.4     (1.8)
Vermont           22.5      (2.9)        20.9     (2.7)         21.7     (2.0)       20.7      (3.3)        21.8     (2.7)         21.3     (2.2)
Virginia          23.1      (3.3)        23.8     (2.9)         23.5     (2.2)       25.1      (3.3)        21.6     (2.9)         23.3     (2.2)
Washington        22.9      (2.5)        20.7     (2.2)         21.8     (1.8)       23.7      (2.5)        21.3     (2.4)         22.5     (1.8)
West Virginia     27.4      (3.1)        22.5     (2.2)         24.8     (2.0)       27.5      (3.1)        26.2     (2.5)         26.8     (2.0)
Wisconsin         23.7      (3.5)        23.8     (3.3)         23.8     (2.4)       22.6      (3.3)        23.2     (3.1)         22.9     (2.4)

Median            24.7                   21.6                   23.0                 23.9                   21.1                   22.5
Low               19.2                   12.2                   15.7                 15.5                   13.5                   14.4
High              32.2                   30.7                   30.7                 31.6                   30.5                   30.1
----------------------------------------------------------------------------------------------------------------------------------------------------
* Ever smoked at least 100 cigarettes and currently smoke.
+ Confidence interval.
======================================================================================================================================================
Return to top. Table_6 Note: To print large tables and graphs users may have to change their printer settings to landscape and use a small font size.
TABLE 6. Percentage of young adults (persons 18-29 years of age) who reported
cigarette smoking, * by sex -- Behavioral Risk Factor Surveillance System, 1992 and
1993 aggregate data
=====================================================================================
                           Men                   Women                  Total
                  -------------------     ------------------     ------------------
State              %    (+/-95% CI +)      %     (+/-95% CI)      %     (+/-95% CI)
-----------------------------------------------------------------------------------
Alabama           19.8      (4.3)         16.7      (3.3)        18.2      (2.7)
Alaska            28.7      (7.3)         34.3      (7.3)        31.2      (5.1)
Arizona           19.2      (5.7)         19.4      (5.5)        19.3      (3.9)
California        21.4      (3.3)         16.7      (2.7)        19.2      (2.2)
Colorado          29.7      (5.3)         25.2      (4.7)        27.5      (3.5)
Connecticut       25.1      (5.5)         25.4      (5.1)        25.2      (3.7)
Delaware          34.1      (6.1)         25.1      (4.5)        29.6      (3.7)
District
  of Columbia     14.8      (4.7)         15.3      (5.1)        15.1      (3.5)
Florida           26.3      (4.3)         21.2      (3.7)        23.8      (2.9)
Georgia           19.7      (4.1)         18.1      (4.5)        18.9      (2.9)
Hawaii            22.1      (4.7)         19.9      (4.1)        21.0      (3.1)
Idaho             21.3      (4.9)         19.8      (4.3)        20.6      (3.3)
Illinois          26.7      (5.1)         22.8      (4.3)        24.8      (3.3)
Indiana           29.6      (5.1)         28.2      (4.5)        28.9      (3.5)
Iowa              22.9      (4.9)         19.7      (4.5)        21.3      (3.3)
Kansas            24.0      (5.5)         20.3      (4.9)        22.2      (3.7)
Kentucky          34.6      (5.3)         25.3      (4.1)        29.9      (3.3)
Louisiana         25.3      (5.7)         19.5      (4.3)        22.4      (3.5)
Maine             26.1      (6.5)         30.1      (6.3)        28.1      (4.5)
Maryland          22.2      (4.5)         20.1      (3.3)        21.1      (2.7)
Massachusetts     26.4      (5.5)         26.2      (4.9)        26.3      (3.7)
Michigan          26.4      (4.5)         25.1      (3.9)        25.8      (2.9)
Minnesota         25.9      (3.9)         25.4      (3.3)        25.7      (2.5)
Mississippi       26.1      (6.1)         21.2      (4.3)        23.6      (3.7)
Missouri          29.4      (6.1)         26.5      (5.3)        28.0      (4.1)
Montana           11.7      (5.3)         24.0      (5.9)        17.7      (3.9)
Nebraska          19.0      (4.7)         25.0      (4.9)        22.0      (3.3)
Nevada            29.8      (5.7)         29.9      (5.1)        29.8      (3.9)
New Hampshire     24.0      (5.9)         28.4      (6.1)        26.2      (4.1)
New Jersey        15.6      (4.5)         22.6      (5.1)        19.0      (3.3)
New Mexico        25.9      (5.9)         17.0      (4.9)        21.6      (3.9)
New York          30.1      (4.7)         26.8      (4.3)        28.5      (3.1)
North Carolina    30.4      (4.7)         25.1      (4.1)        27.8      (3.1)
North Dakota      20.3      (4.5)         23.4      (4.5)        21.7      (3.1)
Ohio              27.2      (6.9)         31.5      (6.1)        29.4      (4.5)
Oklahoma          25.6      (5.7)         26.3      (5.7)        25.9      (3.9)
Oregon            22.1      (3.7)         26.6      (3.9)        24.3      (2.7)
Pennsylvania      27.8      (4.7)         28.1      (4.7)        28.0      (3.3)
Rhode Island      27.1      (5.3)         29.2      (5.1)        28.2      (3.7)
South Carolina    24.9      (5.7)         24.4      (4.5)        24.6      (3.7)
South Dakota      25.3      (5.5)         22.7      (4.7)        24.0      (3.7)
Tennessee         30.5      (4.1)         25.0      (3.5)        27.8      (2.7)
Texas             25.9      (4.5)         17.8      (3.3)        21.8      (2.9)
Utah              19.3      (4.1)         15.8      (3.3)        17.5      (2.7)
Vermont           24.4      (5.5)         26.0      (4.7)        25.2      (3.5)
Virginia          24.0      (5.1)         26.6      (4.9)        25.2      (3.5)
Washington        24.6      (4.1)         23.7      (3.9)        24.2      (2.9)
West Virginia     28.3      (5.3)         29.5      (4.5)        28.9      (3.3)
Wisconsin         25.8      (5.5)         29.9      (5.5)        27.9      (3.9)

Median            25.6                    25.0                   24.8
Low               11.7                    15.3                   15.1
High              34.6                    34.3                   31.2
-----------------------------------------------------------------------------------
* Ever smoked at least 100 cigarettes and currently smoke.
+ Confidence interval.
=====================================================================================
Return to top. Table_7 Note: To print large tables and graphs users may have to change their printer settings to landscape and use a small font size.
TABLE 7. Percentage of adults who reported always wearing a safety belt while driving or
riding in a car, by sex -- Behavioral Risk Factor Surveillance System, 1992 and 1993
=====================================================================================================================================================
                                                1992                                                                1993
                  ---------------------------------------------------------------     -------------------------------------------------------------
                           Men                  Women                  Total                   Men                 Women                  Total
                  -------------------    ------------------     -----------------     -----------------     ------------------     ----------------
State              %    (+/-95% CI *)     %     (+/-95% CI)      %    (+/-95% CI)      %    (+/-95% CI)      %     (+/-95% CI)      %   (+/-95% CI)
---------------------------------------------------------------------------------------------------------------------------------------------------
Alabama           59.3      (3.5)        73.0      (2.7)        66.6     (2.2)        66.5     (3.7)        76.2      (2.7)        71.7     (2.4)
Alaska            52.0      (5.5)        70.9      (4.3)        60.9     (3.7)        52.5     (5.5)        73.7      (4.1)        62.5     (3.5)
Arizona           69.3      (4.7)        79.5      (3.1)        74.7     (2.7)        67.1     (5.3)        77.9      (3.5)        72.6     (3.1)
Arkansas                                                                              48.1     (3.9)        68.1      (3.1)        58.7     (2.5)
California        69.8      (2.4)        76.7      (2.0)        73.3     (1.6)        80.2     (2.4)        87.1      (1.8)        83.7     (1.4)
Colorado          58.3      (3.9)        70.4      (3.1)        64.5     (2.5)        58.5     (4.1)        67.0      (3.1)        62.8     (2.5)
Connecticut       61.2      (3.9)        76.0      (2.7)        69.0     (2.4)        63.2     (3.9)        75.2      (2.7)        69.5     (2.4)
Delaware          66.0      (4.3)        77.5      (3.1)        72.0     (2.5)        63.5     (3.7)        73.5      (2.9)        68.7     (2.4)
District
  of Columbia     61.1      (4.5)        71.3      (3.3)        66.6     (2.7)        65.4     (4.5)        67.8      (3.7)        66.7     (2.9)
Florida           64.8      (3.1)        75.7      (2.4)        70.5     (2.0)        68.1     (2.7)        78.3      (2.2)        73.4     (1.8)
Georgia           55.0      (3.9)        66.5      (3.3)        61.0     (2.7)        50.8     (3.7)        64.7      (3.1)        58.1     (2.5)
Hawaii            85.6      (2.7)        91.1      (2.2)        88.4     (1.6)        88.8     (2.4)        90.8      (2.0)        89.8     (1.6)
Idaho             42.2      (3.7)        56.0      (3.3)        49.2     (2.5)        44.0     (4.5)        58.1      (3.5)        51.2     (2.9)
Illinois          58.5      (3.7)        69.7      (2.9)        64.4     (2.4)        61.7     (3.5)        74.4      (2.7)        68.3     (2.4)
Indiana           48.2      (3.5)        59.8      (2.9)        54.3     (2.4)        49.7     (3.5)        62.4      (3.1)        56.4     (2.4)
Iowa              52.9      (3.9)        70.7      (3.1)        62.2     (2.5)        59.9     (3.7)        68.1      (3.1)        64.2     (2.5)
Kansas            45.6      (4.1)        62.3      (3.7)        54.3     (2.7)        46.7     (4.1)        57.4      (3.7)        52.3     (2.7)
Kentucky          45.2      (3.7)        53.5      (3.1)        49.6     (2.5)        43.9     (3.5)        54.4      (2.9)        49.4     (2.4)
Louisiana         58.4      (4.3)        69.0      (3.1)        64.0     (2.7)        53.2     (4.3)        69.4      (3.3)        61.7     (2.7)
Maine             43.2      (4.5)        55.8      (4.1)        49.8     (3.1)        41.2     (4.5)        55.0      (3.9)        48.4     (3.1)
Maryland          69.6      (3.5)        76.2      (2.7)        73.0     (2.2)        68.3     (2.4)        79.1      (1.8)        74.0     (1.6)
Massachusetts     38.0      (4.1)        48.9      (3.7)        43.8     (2.7)        31.7     (3.7)        42.6      (3.5)        37.5     (2.5)
Michigan          59.4      (3.3)        72.7      (2.5)        66.4     (2.2)        56.8     (3.5)        71.4      (2.5)        64.4     (2.2)
Minnesota         52.0      (2.7)        68.0      (2.4)        60.3     (2.0)        54.1     (2.7)        72.7      (2.2)        63.7     (1.8)
Mississippi       36.4      (4.3)        50.1      (3.3)        43.7     (2.7)        40.9     (4.5)        49.2      (3.5)        45.3     (2.9)
Missouri          51.7      (4.5)        66.7      (3.5)        59.7     (2.9)        52.3     (4.5)        64.1      (3.5)        58.6     (2.7)
Montana           42.2      (4.7)        53.9      (4.1)        48.1     (2.9)        48.7     (4.7)        61.7      (3.9)        55.3     (3.1)
Nebraska          29.1      (3.7)        37.4      (3.3)        33.5     (2.5)        46.1     (3.7)        61.1      (3.1)        53.9     (2.5)
Nevada            62.5      (4.1)        71.4      (3.1)        66.8     (2.5)        57.4     (4.1)        72.0      (2.9)        64.6     (2.5)
New Hampshire     44.7      (4.1)        51.5      (3.9)        48.2     (2.9)        40.8     (4.1)        55.0      (3.7)        48.1     (2.7)
New Jersey        65.3      (4.5)        77.3      (3.1)        71.6     (2.7)        62.9     (4.3)        78.0      (3.1)        70.8     (2.5)
New Mexico        73.5      (4.1)        82.7      (3.3)        78.2     (2.5)        74.1     (4.1)        82.4      (2.9)        78.4     (2.7)
New York          60.7      (3.3)        68.4      (2.9)        64.8     (2.2)        56.4     (3.5)        69.0      (2.9)        63.1     (2.4)
North Carolina    71.9      (3.3)        82.2      (2.4)        77.3     (2.0)        73.9     (3.1)        84.3      (2.4)        79.3     (2.0)
North Dakota      26.2      (3.5)        32.3      (3.1)        29.3     (2.4)        25.0     (3.3)        36.8      (3.3)        31.0     (2.5)
Ohio              55.1      (4.5)        62.1      (3.9)        58.8     (2.9)        55.0     (4.7)        65.3      (3.5)        60.4     (2.9)
Oklahoma          50.6      (4.9)        67.3      (3.3)        59.3     (2.9)        64.2     (4.3)        69.9      (3.5)        67.2     (2.7)
Oregon            68.0      (2.5)        83.6      (1.8)        76.1     (1.6)        71.4     (2.5)        87.0      (1.8)        79.4     (1.6)
Pennsylvania      47.9      (3.3)        60.2      (2.9)        54.4     (2.2)        50.8     (3.3)        65.4      (2.7)        58.5     (2.2)
Rhode Island      34.5      (3.7)        47.3      (3.5)        41.3     (2.5)        34.7     (3.7)        51.6      (3.5)        43.6     (2.7)
South Carolina    59.6      (3.9)        69.4      (2.9)        64.8     (2.5)        59.0     (4.1)        73.7      (2.7)        66.7     (2.5)
South Dakota      22.1      (3.3)        28.2      (2.9)        25.2     (2.4)        21.6     (3.3)        28.1      (2.9)        24.9     (2.2)
Tennessee         53.2      (3.3)        64.1      (2.5)        59.0     (2.0)        52.3     (3.1)        66.7      (2.5)        59.9     (2.0)
Texas             65.9      (3.5)        79.7      (2.4)        73.1     (2.2)        70.1     (3.5)        79.3      (2.4)        74.8     (2.2)
Utah              44.4      (3.7)        57.0      (3.3)        50.9     (2.5)        54.0     (3.9)        67.1      (3.3)        60.7     (2.5)
Vermont           44.3      (3.9)        60.2      (3.3)        52.6     (2.5)        44.0     (3.9)        65.0      (3.1)        54.9     (2.5)
Virginia          64.9      (3.9)        77.3      (2.9)        71.3     (2.4)        64.4     (3.7)        77.3      (2.7)        71.0     (2.4)
Washington        67.2      (2.9)        80.1      (2.2)        73.8     (2.0)        65.7     (2.9)        80.4      (2.2)        73.2     (2.0)
West Virginia     38.0      (3.3)        47.1      (2.7)        42.8     (2.2)        45.9     (3.7)        58.5      (2.7)        52.6     (2.4)
Wisconsin         50.5      (4.1)        59.7      (3.7)        55.3     (2.7)        45.9     (4.1)        61.8      (3.7)        54.2     (2.7)

Median            55.0                   68.4                   61.0                  54.5                  68.1                   62.6
Low               22.1                   28.2                   25.2                  21.6                  28.1                   24.9
High              85.6                   91.1                   88.4                  88.8                  90.8                   89.8
---------------------------------------------------------------------------------------------------------------------------------------------------
* Confidence interval.
=====================================================================================================================================================
Return to top. Table_8 Note: To print large tables and graphs users may have to change their printer settings to landscape and use a small font size.
TABLE 8. Percentage of adults who reported drinking and driving, * by sex -- Behavioral
Risk Factor Surveillance System, 1992 and 1993
======================================================================================================================================================
                                               1992                                                               1993
                  ---------------------------------------------------------------    ---------------------------------------------------------------
                          Men                  Women                  Total                  Men                  Women                  Total
                  -------------------    -----------------      -----------------    ------------------     -----------------      -----------------
State              %    (+/-95% CI +)     %    (+/-95% CI)       %    (+/-95% CI)     %     (+/-95% CI)      %    (+/-95% CI)       %    (+/-95% CI)
----------------------------------------------------------------------------------------------------------------------------------------------------
Alabama            3.4      (1.2)         0.7     (0.6)          2.0     (0.6)        3.1      (1.4)         0.7     (0.6)          1.8     (0.6)
Alaska             4.0      (2.0)         1.4     (1.0)          2.8     (1.2)        3.2      (1.8)         1.7     (1.2)          2.5     (1.2)
Arizona            1.7      (1.2)         1.1     (0.8)          1.4     (0.8)        2.9      (1.6)         0.8     (0.8)          1.8     (0.8)
Arkansas                                                                              3.1      (1.4)         0.3     (0.2)          1.6     (0.6)
California         3.7      (1.0)         0.8     (0.4)          2.3     (0.6)        3.7      (1.0)         1.2     (0.6)          2.4     (0.6)
Colorado           4.4      (1.6)         1.5     (0.8)          2.9     (0.8)        3.6      (1.4)         1.5     (0.8)          2.5     (0.8)
Connecticut        4.1      (1.8)         1.8     (1.0)          2.9     (1.0)        5.7      (2.0)         0.5     (0.4)          3.0     (1.0)
Delaware           4.1      (2.0)         0.3     (0.4)          2.1     (1.0)        4.5      (1.6)         0.4     (0.4)          2.3     (0.8)
District
  of Columbia      2.4      (1.2)         1.6     (1.2)          2.0     (0.8)        1.5      (1.0)         0.8     (0.8)          1.1     (0.6)
Florida            4.3      (1.2)         0.7     (0.4)          2.4     (0.6)        5.1      (1.4)         1.3     (0.6)          3.2     (0.8)
Georgia            1.5      (0.8)         0.2     (0.2)          0.8     (0.4)        2.4      (1.2)         0.6     (0.4)          1.5     (0.6)
Hawaii             4.4      (1.6)         1.4     (1.0)          2.9     (1.0)        3.3      (1.2)         0.6     (0.4)          2.0     (0.6)
Idaho              3.2      (1.4)         0.4     (0.4)          1.8     (0.8)        3.4      (1.4)         1.0     (1.0)          2.2     (0.8)
Illinois           3.7      (1.6)         0.6     (0.6)          2.1     (0.8)        3.3      (1.4)         1.1     (0.6)          2.2     (0.8)
Indiana            3.7      (1.2)         0.9     (0.6)          2.2     (0.6)        3.8      (1.4)         1.3     (0.6)          2.5     (0.8)
Iowa               3.7      (1.6)         0.8     (0.6)          2.2     (0.8)        4.4      (1.6)         1.5     (0.8)          2.9     (0.8)
Kansas             4.5      (1.8)         1.7     (1.4)          3.1     (1.2)        5.1      (2.0)         1.6     (0.8)          3.3     (1.0)
Kentucky           1.5      (0.8)         0.4     (0.4)          0.9     (0.4)        1.9      (0.8)         0.2     (0.2)          1.0     (0.4)
Louisiana          5.2      (2.0)         0.9     (0.6)          2.9     (1.0)        4.2      (1.6)         0.8     (0.6)          2.4     (0.8)
Maine              1.4      (1.2)         0.2     (0.2)          0.7     (0.6)        1.8      (1.4)         0.2     (0.4)          1.0     (0.6)
Maryland           1.3      (0.8)         0.5     (0.4)          0.8     (0.4)        1.3      (0.6)         0.4     (0.2)          0.8     (0.2)
Massachusetts      4.2      (1.8)         2.5     (1.2)          3.3     (1.0)        4.8      (1.8)         0.9     (0.8)          2.8     (1.0)
Michigan           5.6      (1.4)         2.1     (1.0)          3.8     (0.8)        7.3      (2.0)         2.2     (1.0)          4.6     (1.0)
Minnesota          5.7      (1.4)         1.9     (0.8)          3.7     (0.8)        4.6      (1.2)         1.9     (0.6)          3.2     (0.6)
Mississippi        3.3      (1.6)         1.3     (1.0)          2.3     (0.8)        3.0      (1.8)         0.7     (0.6)          1.8     (1.0)
Missouri           4.6      (1.8)         0.4     (0.4)          2.4     (0.8)        4.3      (1.8)         1.3     (0.8)          2.7     (0.8)
Montana            4.8      (2.4)         1.1     (0.8)          2.9     (1.2)        4.1      (2.0)         0.9     (0.8)          2.5     (1.0)
Nebraska           6.3      (2.2)         1.5     (0.8)          3.8     (1.2)        6.7      (2.0)         1.2     (0.6)          3.8     (1.0)
Nevada             6.5      (2.2)         1.9     (1.0)          4.2     (1.2)        7.2      (2.0)         1.6     (0.8)          4.5     (1.2)
New Hampshire      5.3      (2.2)         1.9     (1.2)          3.5     (1.2)        7.2      (2.4)         1.7     (1.0)          4.4     (1.2)
New Jersey         2.7      (1.4)         1.4     (1.0)          2.0     (0.8)        5.0      (1.8)         0.1     (0.2)          2.4     (1.0)
New Mexico         3.9      (2.0)         0.9     (0.8)          2.4     (1.0)        4.1      (1.8)         1.4     (1.0)          2.7     (1.0)
New York           2.0      (1.0)         0.6     (0.4)          1.3     (0.6)        3.4      (1.4)         1.0     (0.6)          2.1     (0.8)
North Carolina     1.2      (0.6)         0.1     (0.2)          0.6     (0.4)        2.4      (1.2)         0.6     (0.4)          1.5     (0.6)
North Dakota       5.8      (1.8)         1.0     (0.6)          3.3     (1.0)        6.6      (1.8)         2.0     (1.2)          4.3     (1.2)
Ohio               3.4      (1.8)         0.0     (0.0)          1.6     (0.8)        2.8      (1.6)         0.9     (0.6)          1.8     (0.8)
Oklahoma           3.1      (1.6)         0.6     (0.6)          1.8     (0.8)        1.5      (1.0)         0.3     (0.4)          0.9     (0.6)
Oregon             3.1      (1.0)         0.6     (0.4)          1.8     (0.6)        2.8      (1.0)         0.6     (0.4)          1.7     (0.6)
Pennsylvania       5.5      (1.8)         0.8     (0.4)          3.0     (0.8)        4.6      (1.4)         1.1     (0.6)          2.7     (0.8)
Rhode Island       4.7      (1.8)         1.7     (0.8)          3.1     (1.0)        5.4      (1.6)         1.2     (0.8)          3.2     (1.0)
South Carolina     4.6      (2.0)         0.6     (0.4)          2.5     (1.0)        2.2      (1.2)         1.3     (0.8)          1.7     (0.8)
South Dakota       4.6      (1.8)         1.0     (0.6)          2.7     (1.0)        4.5      (2.0)         1.6     (1.2)          3.0     (1.0)
Tennessee          1.2      (0.6)         0.6     (0.4)          0.9     (0.4)        1.4      (0.6)         0.3     (0.2)          0.8     (0.4)
Texas              8.2      (2.2)         2.9     (1.0)          5.5     (1.2)        6.0      (1.8)         1.4     (0.6)          3.6     (1.0)
Utah               2.3      (1.2)         0.6     (0.4)          1.4     (0.6)        2.8      (1.4)         0.4     (0.4)          1.5     (0.6)
Vermont            3.0      (1.2)         0.7     (0.6)          1.8     (0.6)        4.6      (1.8)         0.8     (0.6)          2.7     (1.0)
Virginia           3.5      (1.4)         1.2     (0.6)          2.3     (0.8)        3.8      (1.6)         0.8     (0.6)          2.3     (0.8)
Washington         4.4      (1.4)         1.3     (0.6)          2.8     (0.8)        3.2      (1.0)         0.8     (0.6)          2.0     (0.6)
West Virginia      1.5      (0.8)         0.3     (0.2)          0.9     (0.4)        2.5      (1.0)         0.5     (0.4)          1.4     (0.6)
Wisconsin          6.8      (2.0)         2.7     (1.2)          4.6     (1.2)        9.5      (2.4)         1.4     (0.8)          5.3     (1.2)

Median             3.9                    0.9                    2.3                  3.7                    0.9                    2.4
Low                1.2                    0.0                    0.6                  1.3                    0.1                    0.8
High               8.2                    2.9                    5.5                  9.5                    2.2                    5.3
----------------------------------------------------------------------------------------------------------------------------------------------------
* At least once in the previous month, operated a motor vehicle after drinking too much alcohol.
+ Confidence interval.
======================================================================================================================================================
Return to top. Table_9 Note: To print large tables and graphs users may have to change their printer settings to landscape and use a small font size.
TABLE 9. Percentage of adults who reported riding with a driver who had been
drinking, * by sex -- Behavioral Risk Factor Surveillance System, 1993
==================================================================================================
                         Men                  Women                  Total
                 -------------------    -----------------      -----------------
State             %    (+/-95% CI +)     %    (+/-95% CI)       %    (+/-95% CI)
--------------------------------------------------------------------------------
Alabama           5.6      (1.8)         3.1     (1.2)          4.3     (1.0)
Alaska            5.1      (2.4)         4.2     (2.2)          4.7     (1.6)
Arizona           5.0      (2.4)         2.7     (1.4)          3.8     (1.4)
Arkansas          4.2      (1.6)         3.1     (1.4)          3.6     (1.0)
California        5.9      (1.8)         4.3     (1.0)          5.1     (1.0)
Colorado          3.7      (1.6)         4.7     (1.6)          4.2     (1.0)
Connecticut       6.3      (2.2)         3.3     (1.2)          4.7     (1.2)
Delaware          5.2      (1.8)         3.0     (1.2)          4.1     (1.0)
District
  of Columbia     3.4      (2.0)         3.4     (1.8)          3.4     (1.4)
Florida           6.2      (1.6)         4.2     (1.2)          5.2     (1.0)
Georgia           3.5      (1.6)         2.7     (1.4)          3.1     (1.0)
Hawaii            4.6      (1.6)         5.4     (1.8)          5.0     (1.2)
Idaho             2.6      (1.6)         3.9     (1.6)          3.2     (1.0)
Illinois          3.8      (1.4)         3.5     (1.2)          3.6     (0.8)
Indiana           4.7      (1.6)         3.3     (1.2)          3.9     (1.0)
Iowa              4.0      (1.6)         3.3     (1.2)          3.7     (1.0)
Kansas            7.0      (2.4)         3.5     (1.4)          5.2     (1.4)
Kentucky          2.8      (1.2)         1.9     (0.8)          2.3     (0.6)
Louisiana         6.3      (2.2)         4.5     (1.6)          5.4     (1.4)
Maine             1.6      (1.2)         1.4     (0.8)          1.5     (0.8)
Maryland          2.6      (1.0)         2.3     (0.8)          2.4     (0.6)
Massachusetts     8.1      (2.5)         3.9     (1.4)          5.9     (1.4)
Michigan          6.3      (1.8)         5.2     (1.4)          5.7     (1.2)
Minnesota         5.8      (1.6)         3.5     (1.0)          4.6     (1.0)
Mississippi       6.2      (2.5)         2.2     (1.0)          4.1     (1.4)
Missouri          3.9      (1.8)         3.5     (1.4)          3.7     (1.2)
Montana           4.8      (2.2)         5.0     (2.0)          4.9     (1.6)
Nebraska          6.6      (2.0)         4.0     (1.4)          5.2     (1.2)
Nevada            5.8      (2.0)         4.1     (1.4)          5.0     (1.2)
New Hampshire     7.6      (2.5)         3.6     (1.6)          5.5     (1.6)
New Jersey        5.5      (2.2)         2.7     (1.2)          4.0     (1.2)
New Mexico        6.6      (2.4)         3.5     (1.4)          5.0     (1.4)
New York          4.7      (1.6)         3.4     (1.2)          4.0     (1.0)
North Carolina    2.8      (1.2)         2.0     (0.8)          2.4     (0.8)
North Dakota      6.9      (2.0)         4.0     (1.4)          5.5     (1.2)
Ohio              2.3      (1.6)         3.3     (1.4)          2.9     (1.0)
Oklahoma          2.3      (1.4)         0.6     (0.4)          1.4     (0.8)
Oregon            4.1      (1.2)         2.9     (1.0)          3.5     (0.8)
Pennsylvania      5.3      (1.6)         4.1     (1.2)          4.7     (1.0)
Rhode Island      7.3      (2.2)         5.2     (1.8)          6.2     (1.4)
South Carolina    4.6      (2.0)         3.0     (1.2)          3.8     (1.2)
South Dakota      3.8      (1.8)         3.5     (1.6)          3.7     (1.2)
Tennessee         1.8      (0.8)         1.6     (0.6)          1.7     (0.6)
Texas             7.7      (2.4)         5.2     (1.4)          6.4     (1.4)
Utah              3.2      (1.6)         3.9     (1.4)          3.6     (1.0)
Vermont           3.7      (1.6)         2.4     (1.0)          3.0     (1.0)
Virginia          4.2      (1.8)         2.6     (1.2)          3.4     (1.0)
Washington        3.7      (1.2)         3.3     (1.0)          3.5     (0.8)
West Virginia     3.9      (1.6)         2.7     (1.0)          3.3     (1.0)
Wisconsin         6.7      (2.0)         5.5     (1.8)          6.1     (1.4)

Median            4.7                    3.4                    4.0
Low               1.6                    0.6                    1.4
High              8.1                    5.5                    6.4
--------------------------------------------------------------------------------
* At least once in the previous month, rode with a driver who had had too much alcohol to drink.
+ Confidence interval.
==================================================================================================
Return to top. Table_10 Note: To print large tables and graphs users may have to change their printer settings to landscape and use a small font size.
TABLE 10. Percentage of adults who reported ever having been told by a health professional
that they had high blood pressure, by sex -- Behavioral Risk Factor Surveillance System,
1992 and 1993
======================================================================================================================================================
                                                1992                                                                1993
                  ---------------------------------------------------------------     --------------------------------------------------------------
                           Men                  Women                  Total                   Men                 Women                  Total
                  -------------------    ------------------     -----------------     -----------------     ------------------     -----------------
State              %    (+/-95% CI *)     %     (+/-95% CI)      %    (+/-95% CI)      %    (+/-95% CI)      %     (+/-95% CI)      %    (+/-95% CI)
----------------------------------------------------------------------------------------------------------------------------------------------------
Alabama           19.7      (2.7)        21.1      (2.4)        20.5     (2.0)        18.6     (2.9)        22.2      (2.5)        20.5     (2.0)
Alaska            14.8      (3.5)        19.5      (3.9)        17.0     (2.7)        14.6     (3.7)        20.1      (3.9)        17.2     (2.7)
Arizona           20.5      (3.9)        21.1      (3.5)        20.8     (2.7)        15.7     (3.5)        20.5      (3.3)        18.2     (2.4)
Arkansas                                                                              21.4     (3.3)        25.1      (2.7)        23.4     (2.2)
California        19.0      (2.0)        22.1      (2.0)        20.6     (1.4)        20.2     (2.4)        21.8      (2.0)        21.0     (1.6)
Colorado          15.4      (2.5)        19.4      (2.7)        17.4     (2.0)        19.5     (2.9)        22.6      (2.9)        21.1     (2.2)
Connecticut       21.4      (3.1)        23.8      (2.7)        22.7     (2.2)        22.8     (3.3)        22.4      (2.7)        22.6     (2.2)
Delaware          21.1      (3.7)        22.1      (2.9)        21.6     (2.4)        21.7     (3.1)        22.6      (2.5)        22.2     (2.0)
District                                                                                                                              ,
  of Columbia     18.1      (3.7)        22.0      (2.9)        20.2     (2.5)        15.5     (3.3)        17.8      (2.9)        16.8     (2.2)
Florida           20.9      (2.5)        22.5      (2.2)        21.8     (1.8)        24.0     (2.5)        24.3      (2.2)        24.2     (1.8)
Georgia           17.0      (2.7)        20.3      (2.9)        18.7     (2.0)        18.0     (2.7)        24.5      (2.7)        21.4     (2.0)
Hawaii            18.6      (3.1)        20.1      (2.7)        19.3     (2.2)        24.7     (3.5)        18.8      (2.9)        21.7     (2.4)
Idaho             14.2      (2.4)        22.8      (2.7)        18.6     (2.0)        20.1     (3.9)        25.8      (3.1)        23.0     (2.5)
Illinois          18.7      (2.7)        20.9      (2.4)        19.8     (1.8)        22.0     (3.1)        21.8      (2.4)        21.9     (2.0)
Indiana           21.5      (2.7)        27.6      (2.5)        24.7     (1.8)        23.4     (2.7)        27.0      (2.7)        25.3     (2.0)
Iowa              20.5      (3.1)        21.3      (2.7)        21.0     (2.2)        17.9     (2.7)        22.6      (2.7)        20.4     (2.0)
Kansas            18.4      (3.1)        24.2      (3.3)        21.4     (2.4)        21.4     (3.3)        25.7      (3.3)        23.6     (2.4)
Kentucky          23.5      (2.9)        26.9      (2.5)        25.3     (2.0)        21.3     (2.7)        23.8      (2.4)        22.6     (1.8)
Louisiana         19.1      (3.1)        22.9      (2.9)        21.1     (2.2)        19.8     (3.3)        25.0      (2.9)        22.6     (2.4)
Maine             20.8      (3.5)        22.5      (3.3)        21.7     (2.4)        22.8     (3.7)        20.8      (3.1)        21.7     (2.5)
Maryland          18.0      (2.7)        21.9      (2.5)        20.1     (2.0)        20.4     (2.0)        21.6      (1.8)        21.0     (1.4)
Massachusetts     18.5      (3.1)        21.8      (3.1)        20.2     (2.4)        20.4     (3.3)        20.5      (2.9)        20.4     (2.2)
Michigan          23.8      (2.7)        22.3      (2.4)        23.0     (1.8)        20.4     (2.5)        23.2      (2.4)        21.9     (1.8)
Minnesota         20.6      (2.2)        22.2      (2.0)        21.5     (1.6)        22.2     (2.4)        22.5      (2.0)        22.4     (1.6)
Mississippi       23.7      (3.7)        31.6      (3.3)        27.9     (2.5)        27.6     (3.9)        31.8      (3.1)        29.8     (2.5)
Missouri          22.2      (3.5)        24.9      (3.1)        23.7     (2.4)        21.2     (3.5)        27.8      (3.3)        24.7     (2.4)
Montana           19.5      (3.7)        20.8      (3.3)        20.2     (2.5)        20.0     (3.9)        21.7      (3.3)        20.9     (2.5)
Nebraska          20.3      (3.1)        21.0      (2.7)        20.6     (2.2)        22.5     (3.1)        23.3      (2.7)        22.9     (2.2)
Nevada            21.3      (3.7)        21.0      (2.7)        21.2     (2.4)        22.3     (3.3)        22.2      (2.7)        22.2     (2.2)
New Hampshire     19.6      (3.1)        19.8      (2.9)        19.7     (2.2)        23.8     (3.5)        19.7      (2.9)        21.7     (2.4)
New Jersey        24.1      (3.7)        18.9      (2.9)        21.4     (2.4)        25.4     (3.7)        17.1      (2.7)        21.1     (2.4)
New Mexico        15.4      (3.5)        14.0      (2.7)        14.7     (2.2)        16.6     (3.3)        19.4      (2.9)        18.0     (2.2)
New York          20.0      (2.7)        21.7      (2.7)        20.9     (2.0)        20.8     (2.7)        22.7      (2.5)        21.8     (1.8)
North Carolina    17.4      (2.7)        19.2      (2.5)        18.3     (1.8)        16.8     (2.5)        17.1      (2.2)        16.9     (1.8)
North Dakota      17.4      (2.5)        21.2      (2.7)        19.3     (2.0)        23.0     (2.9)        21.8      (2.7)        22.4     (2.0)
Ohio              18.5      (3.3)        22.9      (3.3)        20.8     (2.4)        17.4     (3.5)        19.6      (2.7)        18.5     (2.2)
Oklahoma          20.7      (3.7)        26.0      (2.9)        23.5     (2.4)        19.0     (3.3)        22.9      (2.9)        21.0     (2.4)
Oregon            18.8      (2.2)        20.7      (2.0)        19.8     (1.4)        19.9     (2.4)        23.1      (2.2)        21.5     (1.6)
Pennsylvania      22.4      (2.7)        22.6      (2.5)        22.5     (1.8)        22.6     (2.7)        23.1      (2.4)        22.9     (1.8)
Rhode Island      22.3      (3.1)        21.9      (2.9)        22.1     (2.2)        21.9     (3.1)        23.7      (3.1)        22.8     (2.4)
South Carolina    20.7      (3.3)        27.0      (2.7)        24.0     (2.2)        24.4     (3.3)        26.0      (2.9)        25.2     (2.2)
South Dakota      15.8      (2.9)        19.5      (2.7)        17.7     (2.0)        18.2     (2.7)        20.4      (2.7)        19.3     (2.0)
Tennessee         21.0      (2.5)        24.3      (2.4)        22.7     (1.8)        20.6     (2.4)        27.7      (2.4)        24.3     (1.8)
Texas             17.3      (2.5)        19.5      (2.4)        18.4     (1.8)        18.4     (2.7)        19.6      (2.4)        19.0     (1.8)
Utah              17.1      (2.7)        20.0      (2.7)        18.6     (2.0)        18.1     (2.9)        18.1      (2.5)        18.1     (2.0)
Vermont           19.5      (2.7)        19.6      (2.5)        19.5     (1.8)        21.9     (3.3)        20.2      (2.5)        21.0     (2.0)
Virginia          17.6      (2.9)        22.4      (2.9)        20.1     (2.2)        20.0     (3.1)        20.8      (2.7)        20.4     (2.2)
Washington        18.9      (2.4)        19.6      (2.2)        19.2     (1.6)        20.7     (2.5)        22.9      (2.4)        21.8     (1.8)
West Virginia     22.6      (2.9)        24.8      (2.4)        23.8     (2.0)        23.1     (2.9)        25.7      (2.5)        24.5     (2.0)
Wisconsin         20.2      (3.3)        20.1      (3.1)        20.1     (2.2)        19.3     (3.1)        23.0      (3.1)        21.2     (2.2)

Median            19.6                   21.8                   20.6                  20.6                  22.5                   21.7
Low               14.2                   14.0                   14.7                  14.6                  17.1                   16.8
High              24.1                   31.6                   27.9                  27.6                  31.8                   29.8
----------------------------------------------------------------------------------------------------------------------------------------------------
* Confidence interval.
======================================================================================================================================================
Return to top. Table_11 Note: To print large tables and graphs users may have to change their printer settings to landscape and use a small font size.
TABLE 11. Percentage of adults who reported ever having been told by a health professional
that they had diabetes, by sex -- Behavioral Risk Factor Surveillance System, 1992 and 1993
========================================================================================================================================================
                                                 1992                                                                 1993*
                  ----------------------------------------------------------------      --------------------------------------------------------------
                           Men                   Women                  Total                    Men                 Women                  Total
                  -------------------     ------------------     -----------------      -----------------     -----------------      -----------------
State              %    (+/-95% CI +)      %     (+/-95% CI)      %    (+/-95% CI)       %    (+/-95% CI)      %    (+/-95% CI)       %    (+/-95% CI)
------------------------------------------------------------------------------------------------------------------------------------------------------
Alabama            5.2      (1.6)          5.0      (1.4)         5.1     (1.0)          4.4     (1.6)         6.7     (1.6)          5.6     (1.2)
Alaska             1.6      (1.0)          4.1      (2.0)         2.8     (1.0)          3.7     (2.5)         4.0     (1.8)          3.9     (1.6)
Arizona            4.5      (2.2)          4.5      (1.6)         4.5     (1.4)          2.2     (1.6)         4.2     (1.8)          3.2     (1.2)
Arkansas                                                                                 4.2     (1.6)         7.2     (1.8)          5.8     (1.2)
California         3.9      (1.0)          6.9      (1.2)         5.4     (0.8)          4.0     (1.0)         5.0     (1.2)          4.5     (0.8)
Colorado           4.1      (1.6)          5.0      (1.4)         4.6     (1.0)          2.6     (1.2)         2.8     (1.2)          2.7     (0.8)
Connecticut        5.2      (1.8)          5.5      (1.6)         5.3     (1.2)          5.6     (2.0)         4.9     (1.4)          5.2     (1.2)
Delaware           4.6      (1.8)          4.5      (1.4)         4.5     (1.2)          5.0     (1.8)         5.5     (1.4)          5.2     (1.2)
District
  of Columbia      6.2      (2.2)          8.4      (2.0)         7.4     (1.6)          3.5     (1.6)         5.4     (2.0)          4.5     (1.2)
Florida            6.2      (1.6)          6.3      (1.2)         6.3     (1.0)          4.5     (1.2)         5.8     (1.2)          5.2     (0.8)
Georgia            4.1      (1.4)          6.8      (1.8)         5.5     (1.2)          3.1     (1.2)         4.2     (1.2)          3.7     (0.8)
Hawaii             6.2      (2.0)          7.8      (2.0)         7.0     (1.4)          4.6     (1.6)         5.3     (1.6)          5.0     (1.2)
Idaho              4.9      (1.4)          7.4      (1.8)         6.1     (1.0)          4.4     (1.6)         4.0     (1.4)          4.2     (1.0)
Illinois           3.9      (1.4)          5.1      (1.4)         4.5     (1.0)          4.7     (1.6)         5.7     (1.4)          5.2     (1.0)
Indiana            5.1      (1.6)          6.4      (1.4)         5.8     (1.0)          3.5     (1.2)         3.6     (1.2)          3.5     (0.8)
Iowa               3.6      (1.4)          4.9      (1.6)         4.3     (1.0)          3.3     (1.4)         3.3     (1.2)          3.3     (0.8)
Kansas             4.2      (1.6)          4.5      (1.6)         4.3     (1.2)          4.6     (1.8)         4.3     (1.6)          4.4     (1.2)
Kentucky           5.2      (1.6)          5.4      (1.4)         5.3     (1.0)          3.5     (1.2)         3.9     (1.0)          3.7     (0.8)
Louisiana          4.5      (1.6)          6.9      (1.8)         5.7     (1.2)          5.7     (2.0)         4.7     (1.4)          5.2     (1.2)
Maine              2.8      (1.4)          2.8      (1.2)         2.8     (1.0)          3.7     (1.6)         2.7     (1.2)          3.2     (1.0)
Maryland           5.0      (1.8)          6.1      (1.6)         5.6     (1.2)          4.1     (1.0)         5.7     (1.0)          4.9     (0.8)
Massachusetts      3.7      (1.6)          6.5      (2.0)         5.2     (1.4)          4.7     (1.8)         3.7     (1.4)          4.2     (1.0)
Michigan           4.4      (1.4)          6.3      (1.4)         5.4     (1.0)          6.1     (1.6)         5.0     (1.4)          5.5     (1.0)
Minnesota          2.2      (0.8)          4.6      (1.0)         3.5     (0.6)          4.1     (1.0)         4.3     (1.0)          4.2     (0.8)
Mississippi        3.9      (1.6)          9.0      (2.0)         6.6     (1.4)          5.5     (2.0)         7.1     (1.8)          6.3     (1.4)
Missouri           4.4      (1.8)          7.3      (1.8)         5.9     (1.2)          5.6     (2.0)         5.0     (1.6)          5.3     (1.2)
Montana            4.3      (1.8)          4.4      (1.8)         4.4     (1.2)          4.6     (2.0)         4.2     (1.6)          4.4     (1.4)
Nebraska           4.6      (1.8)          6.8      (2.0)         5.7     (1.4)          5.6     (1.8)         5.6     (1.4)          5.6     (1.2)
Nevada             5.7      (2.0)          7.2      (1.8)         6.5     (1.4)          3.7     (1.6)         4.4     (1.4)          4.0     (1.0)
New Hampshire      2.6      (1.0)          5.3      (1.6)         4.0     (1.0)          4.2     (1.6)         4.5     (1.4)          4.4     (1.0)
New Jersey         3.5      (1.6)          4.7      (1.6)         4.1     (1.2)          6.1     (2.2)         4.2     (1.4)          5.1     (1.4)
New Mexico         3.5      (2.0)          4.4      (1.6)         4.0     (1.2)          3.0     (1.4)         4.6     (1.6)          3.8     (1.2)
New York           4.4      (1.4)          6.7      (1.6)         5.6     (1.0)          4.5     (1.4)         4.3     (1.2)          4.4     (1.0)
North Carolina     4.9      (1.4)          6.5      (1.4)         5.7     (1.0)          4.9     (1.4)         4.9     (1.2)          4.9     (1.0)
North Dakota       4.4      (1.4)          4.9      (1.4)         4.6     (1.0)          4.9     (1.8)         3.8     (1.4)          4.4     (1.0)
Ohio               4.2      (1.8)          5.6      (1.8)         5.0     (1.2)          4.5     (1.8)         5.9     (1.6)          5.2     (1.2)
Oklahoma           4.6      (2.2)          5.5      (1.6)         5.1     (1.4)          3.0     (1.4)         5.5     (1.6)          4.3     (1.0)
Oregon             4.7      (1.2)          5.9      (1.2)         5.3     (0.8)          3.8     (1.2)         4.8     (1.2)          4.3     (0.8)
Pennsylvania       5.9      (1.6)          6.0      (1.4)         5.9     (1.0)          4.8     (1.4)         5.7     (1.4)          5.3     (1.0)
Rhode Island       3.3      (1.2)          6.9      (1.6)         5.2     (1.0)          6.5     (2.0)         4.4     (1.4)          5.4     (1.2)
South Carolina     5.0      (1.6)          6.3      (1.4)         5.7     (1.0)          5.0     (1.8)         6.1     (1.4)          5.6     (1.2)
South Dakota       4.5      (1.8)          5.2      (1.4)         4.9     (1.0)          3.0     (1.2)         4.2     (1.2)          3.6     (0.8)
Tennessee          4.8      (1.4)          6.1      (1.2)         5.5     (1.0)          5.8     (1.4)         6.5     (1.2)          6.2     (1.0)
Texas              4.5      (1.4)          8.2      (1.6)         6.4     (1.2)          5.4     (1.6)         5.2     (1.4)          5.3     (1.0)
Utah               2.4      (1.2)          4.3      (1.4)         3.4     (1.0)          2.9     (1.4)         4.0     (1.2)          3.5     (1.0)
Vermont            3.0      (1.2)          4.3      (1.2)         3.7     (0.8)          4.2     (1.6)         4.6     (1.4)          4.4     (1.0)
Virginia           3.8      (1.4)          6.5      (1.6)         5.2     (1.0)          5.1     (1.6)         4.3     (1.4)          4.7     (1.0)
Washington         3.8      (1.2)          4.4      (1.2)         4.1     (0.8)          3.6     (1.2)         3.7     (1.0)          3.6     (0.8)
West Virginia      5.8      (1.6)          7.0      (1.4)         6.4     (1.0)          5.1     (1.6)         6.9     (1.4)          6.0     (1.0)
Wisconsin          6.2      (2.0)          3.4      (1.4)         4.8     (1.2)          3.7     (1.6)         5.3     (1.8)          4.5     (1.2)

Median             4.4                     5.9                    5.2                    4.4                   4.6                    4.5
Low                1.6                     2.8                    2.8                    2.2                   2.7                    2.7
High               6.2                     9.0                    7.4                    6.5                   7.2                    6.3
------------------------------------------------------------------------------------------------------------------------------------------------------
* In 1993, gestational diabetes was excluded from the question on diabetes awareness.
+ Confidence interval.
========================================================================================================================================================
Return to top. Table_12 Note: To print large tables and graphs users may have to change their printer settings to landscape and use a small font size.
TABLE 12. Percentage of adults who reported ever having been told by a health professional
that they had high blood cholesterol, by sex -- Behavioral Risk Factor Surveillance System,
1992 and 1993
======================================================================================================================================================
                                                1992                                                                1993
                  ---------------------------------------------------------------     --------------------------------------------------------------
                           Men                  Women                  Total                   Men                 Women                  Total
                  -------------------    ------------------     -----------------     -----------------     ------------------     -----------------
State              %    (+/-95% CI *)     %     (+/-95% CI)      %    (+/-95% CI)      %    (+/-95% CI)      %     (+/-95% CI)      %    (+/-95% CI)
----------------------------------------------------------------------------------------------------------------------------------------------------
Alabama           12.4      (2.5)        16.5      (2.2)        14.6     (1.6)        16.7     (2.7)        19.1      (2.4)        18.0     (1.8)
Alaska            16.2      (3.7)        18.2      (4.1)        17.2     (2.7)        18.1     (4.5)        18.5      (3.9)        18.3     (2.9)
Arizona           14.3      (3.3)        16.8      (2.9)        15.6     (2.4)        16.3     (4.3)        16.0      (2.7)        16.2     (2.4)
Arkansas                                                                              16.1     (2.9)        20.4      (2.5)        18.4     (2.0)
California        15.6      (1.8)        18.8      (1.8)        17.2     (1.2)        18.3     (2.2)        20.7      (2.0)        19.5     (1.4)
Colorado          18.0      (2.9)        16.4      (2.4)        17.2     (2.0)        16.5     (2.7)        19.1      (2.5)        17.8     (2.0)
Connecticut       20.0      (3.1)        21.0      (2.7)        20.6     (2.0)        21.9     (3.3)        20.4      (2.5)        21.1     (2.2)
Delaware          18.6      (3.5)        20.1      (2.7)        19.4     (2.4)        20.0     (2.9)        19.7      (2.4)        19.9     (2.0)
District
  of Columbia     12.8      (2.9)        19.6      (2.9)        16.5     (2.2)        10.3     (2.7)        13.2      (2.5)        11.9     (2.0)
Florida           18.1      (2.5)        22.5      (2.2)        20.4     (1.6)        21.7     (2.4)        24.3      (2.2)        23.0     (1.6)
Georgia           14.3      (2.5)        14.8      (2.4)        14.6     (1.8)        15.1     (2.5)        19.3      (2.4)        17.3     (1.8)
Hawaii            19.6      (3.1)        18.7      (2.9)        19.2     (2.2)        23.9     (3.5)        22.7      (3.1)        23.3     (2.4)
Idaho             12.4      (2.4)        18.4      (2.5)        15.4     (1.8)        18.6     (3.5)        20.2      (2.9)        19.4     (2.4)
Illinois          15.4      (2.5)        16.6      (2.2)        16.0     (1.6)        17.2     (2.7)        18.9      (2.4)        18.1     (1.8)
Indiana           20.9      (2.7)        20.7      (2.4)        20.8     (1.8)        16.3     (2.5)        22.4      (2.5)        19.5     (1.8)
Iowa              15.5      (2.7)        21.1      (2.9)        18.4     (2.0)        18.4     (2.7)        21.8      (2.7)        20.2     (2.0)
Kansas            16.2      (2.9)        19.4      (2.9)        17.9     (2.2)        19.0     (3.1)        23.3      (3.1)        21.2     (2.2)
Kentucky          15.8      (2.5)        21.2      (2.2)        18.7     (1.8)        18.2     (2.5)        21.8      (2.4)        20.1     (1.8)
Louisiana         14.8      (2.9)        18.1      (2.5)        16.5     (2.0)        17.3     (3.1)        17.0      (2.4)        17.1     (2.0)
Maine             12.5      (2.9)        18.5      (3.3)        15.6     (2.2)        18.7     (3.5)        19.0      (3.1)        18.8     (2.4)
Maryland          16.5      (2.7)        17.9      (2.4)        17.2     (1.8)        17.2     (2.0)        19.8      (1.8)        18.5     (1.4)
Massachusetts     19.7      (3.3)        20.8      (3.1)        20.3     (2.4)        22.1     (3.5)        19.8      (2.9)        20.9     (2.2)
Michigan          18.3      (2.5)        19.3      (2.2)        18.8     (1.8)        19.6     (2.5)        23.4      (2.5)        21.6     (1.8)
Minnesota         18.5      (2.0)        20.3      (2.0)        19.4     (1.4)        17.9     (2.2)        20.3      (2.0)        19.1     (1.4)
Mississippi       16.0      (2.9)        20.6      (2.7)        18.5     (2.2)        16.7     (3.1)        20.4      (2.9)        18.7     (2.2)
Missouri          16.4      (3.1)        19.3      (2.7)        17.9     (2.0)        17.3     (3.1)        24.5      (3.3)        21.1     (2.4)
Montana           15.1      (3.1)        19.0      (3.3)        17.1     (2.4)        18.1     (3.5)        17.6      (2.9)        17.8     (2.2)
Nebraska          13.4      (2.7)        16.1      (2.5)        14.8     (1.8)        16.7     (2.7)        19.3      (2.5)        18.0     (2.0)
Nevada            21.3      (3.9)        20.3      (2.7)        20.8     (2.4)        19.8     (3.3)        21.2      (2.5)        20.5     (2.2)
New Hampshire     18.8      (2.9)        21.3      (2.9)        20.1     (2.2)        18.1     (2.9)        22.0      (3.1)        20.1     (2.2)
New Jersey        19.9      (3.5)        19.4      (2.9)        19.6     (2.4)        19.5     (3.5)        20.4      (2.9)        20.0     (2.2)
New Mexico        17.3      (3.5)        17.2      (2.9)        17.3     (2.4)        18.0     (3.1)        18.6      (2.9)        18.3     (2.2)
New York          16.5      (2.5)        20.1      (2.5)        18.4     (1.8)        17.6     (2.5)        20.9      (2.4)        19.3     (1.8)
North Carolina    17.4      (2.7)        19.4      (2.4)        18.4     (1.8)        14.3     (2.4)        20.4      (2.4)        17.5     (1.6)
North Dakota      18.3      (2.7)        19.9      (2.5)        19.1     (2.0)        21.0     (2.9)        22.4      (2.7)        21.7     (2.2)
Ohio              14.7      (3.1)        15.6      (2.9)        15.2     (2.2)        17.1     (3.3)        18.4      (2.7)        17.8     (2.2)
Oklahoma          15.3      (3.1)        18.1      (2.5)        16.7     (2.2)        17.5     (3.1)        18.7      (2.7)        18.1     (2.2)
Oregon            18.6      (2.2)        19.2      (2.0)        18.9     (1.4)        19.7     (2.2)        21.8      (2.2)        20.8     (1.6)
Pennsylvania      16.5      (2.4)        20.7      (2.4)        18.7     (1.8)        17.4     (2.5)        20.2      (2.4)        18.9     (1.8)
Rhode Island      18.9      (2.9)        19.3      (2.5)        19.1     (2.0)        17.8     (2.7)        20.7      (2.9)        19.4     (2.0)
South Carolina    18.0      (3.1)        17.4      (2.4)        17.7     (2.0)        14.8     (2.5)        21.7      (2.5)        18.4     (1.8)
South Dakota      14.2      (2.7)        17.2      (2.5)        15.7     (1.8)        16.6     (2.7)        18.1      (2.5)        17.4     (1.8)
Tennessee         15.3      (2.2)        18.8      (2.2)        17.1     (1.6)        17.5     (2.4)        20.8      (2.0)        19.2     (1.6)
Texas             17.5      (2.5)        20.2      (2.4)        18.9     (1.8)        18.1     (2.7)        20.5      (2.4)        19.3     (1.8)
Utah              12.3      (2.5)        16.4      (2.4)        14.4     (1.8)        18.4     (3.1)        16.3      (2.4)        17.4     (2.0)
Vermont           16.4      (2.5)        21.1      (2.5)        18.8     (1.8)        17.7     (2.7)        19.4      (2.5)        18.6     (1.8)
Virginia          15.8      (2.7)        17.0      (2.4)        16.4     (1.8)        18.5     (2.9)        19.8      (2.4)        19.2     (2.0)
Washington        17.9      (2.4)        18.4      (2.2)        18.2     (1.6)        18.6     (2.4)        22.5      (2.4)        20.6     (1.8)
West Virginia     19.8      (2.7)        23.0      (2.4)        21.5     (1.8)        18.3     (2.7)        23.9      (2.4)        21.3     (2.0)
Wisconsin         19.0      (3.1)        20.6      (3.1)        19.8     (2.2)        18.7     (3.1)        24.1      (3.1)        21.5     (2.4)

Median            16.5                   19.3                   18.2                  18.0                  20.4                   19.2
Low               12.3                   14.8                   14.4                  10.3                  13.2                   11.9
High              21.3                   23.0                   21.5                  23.9                  24.5                   23.3
----------------------------------------------------------------------------------------------------------------------------------------------------
* Confidence interval.
======================================================================================================================================================
Return to top. Table_13 Note: To print large tables and graphs users may have to change their printer settings to landscape and use a small font size.
TABLE 13. Percentage of adults who reported ever having their blood cholesterol tested,
by sex -- Behavioral Risk Factor Surveillance System, 1992 and 1993
=======================================================================================================================================================
                                                 1992                                                                 1993
                  ----------------------------------------------------------------     --------------------------------------------------------------
                           Men                   Women                  Total                   Men                 Women                  Total
                  -------------------     ------------------     -----------------     -----------------     -----------------      -----------------
State              %    (+/-95% CI *)      %     (+/-95% CI)      %    (+/-95% CI)      %    (+/-95% CI)      %    (+/-95% CI)       %    (+/-95% CI)
-----------------------------------------------------------------------------------------------------------------------------------------------------
Alabama           64.8      (3.3)         69.0      (2.9)        67.1     (2.2)        62.2     (3.5)        65.0     (2.9)         63.7     (2.4)
Alaska            61.0      (5.7)         66.5      (4.7)        63.5     (3.7)        65.0     (4.9)        65.8     (4.9)         65.4     (3.5)
Arizona           60.3      (4.9)         68.3      (4.1)        64.5     (3.3)        67.6     (4.9)        69.5     (4.3)         68.5     (3.3)
Arkansas                                                                               61.4     (4.1)        64.1     (3.1)         62.8     (2.5)
California        61.7      (2.5)         69.4      (2.2)        65.6     (1.8)        66.0     (2.9)        73.4     (2.4)         69.7     (2.0)
Colorado          66.3      (3.7)         69.6      (3.1)        68.0     (2.5)        65.9     (3.7)        70.2     (3.1)         68.1     (2.5)
Connecticut       68.9      (3.7)         73.2      (2.9)        71.2     (2.4)        70.3     (3.9)        73.9     (2.9)         72.2     (2.4)
Delaware          65.1      (4.1)         66.3      (3.3)        65.7     (2.7)        66.8     (3.5)        68.4     (2.9)         67.7     (2.4)
District
  of Columbia     64.5      (4.7)         75.2      (3.5)        70.3     (2.9)        61.2     (4.7)        67.5     (3.7)         64.6     (2.9)
Florida           68.9      (3.1)         76.2      (2.4)        72.7     (2.0)        69.8     (2.7)        75.9     (2.2)         73.0     (1.8)
Georgia           65.2      (3.7)         68.2      (3.3)        66.8     (2.5)        62.6     (3.7)        70.1     (3.1)         66.5     (2.4)
Hawaii            68.8      (3.9)         66.7      (3.7)        67.7     (2.7)        70.8     (3.9)        69.3     (3.1)         70.1     (2.5)
Idaho             56.8      (3.7)         65.3      (3.3)        61.1     (2.5)        63.1     (4.3)        68.0     (3.1)         65.5     (2.7)
Illinois          63.6      (3.9)         69.8      (2.7)        66.8     (2.4)        61.8     (3.7)        66.1     (2.9)         64.0     (2.4)
Indiana           64.8      (3.3)         63.8      (2.7)        64.3     (2.2)        59.9     (3.5)        67.0     (2.9)         63.6     (2.4)
Iowa              63.2      (3.7)         71.3      (3.1)        67.5     (2.5)        67.1     (3.5)        73.0     (3.1)         70.2     (2.4)
Kansas            67.2      (3.9)         66.8      (3.7)        67.0     (2.7)        61.3     (4.1)        70.5     (3.3)         66.1     (2.7)
Kentucky          57.8      (3.9)         63.4      (2.9)        60.8     (2.4)        60.5     (3.3)        67.0     (2.7)         63.9     (2.2)
Louisiana         59.2      (4.3)         67.8      (3.3)        63.7     (2.7)        64.4     (4.3)        68.5     (3.1)         66.6     (2.5)
Maine             64.2      (4.3)         73.4      (3.7)        69.0     (2.9)        67.2     (4.3)        70.9     (3.7)         69.1     (2.9)
Maryland          68.8      (3.5)         69.7      (2.9)        69.3     (2.2)        69.0     (2.5)        73.5     (2.0)         71.4     (1.6)
Massachusetts     72.3      (3.9)         74.8      (3.3)        73.7     (2.5)        74.6     (3.7)        76.4     (3.1)         75.6     (2.4)
Michigan          67.6      (3.1)         71.6      (2.7)        69.7     (2.2)        68.0     (3.3)        74.3     (2.5)         71.3     (2.2)
Minnesota         65.6      (2.7)         75.2      (2.2)        70.6     (1.8)        66.9     (2.5)        75.1     (2.0)         71.2     (1.6)
Mississippi       57.4      (4.5)         66.4      (3.3)        62.2     (2.7)        58.4     (4.3)        60.4     (3.5)         59.5     (2.9)
Missouri          63.1      (4.3)         69.9      (3.3)        66.7     (2.7)        64.5     (4.3)        69.3     (3.3)         67.0     (2.5)
Montana           64.7      (4.7)         67.5      (3.9)        66.1     (3.1)        62.6     (4.7)        70.4     (4.1)         66.6     (3.1)
Nebraska          61.9      (3.9)         67.4      (3.3)        64.8     (2.5)        63.4     (3.7)        68.8     (3.1)         66.2     (2.4)
Nevada            63.9      (4.3)         68.5      (3.3)        66.1     (2.7)        61.9     (3.9)        67.1     (3.1)         64.5     (2.5)
New Hampshire     67.8      (4.1)         74.5      (3.7)        71.2     (2.7)        67.3     (4.1)        74.9     (3.3)         71.2     (2.5)
New Jersey        66.9      (4.3)         69.8      (3.5)        68.4     (2.7)        70.6     (3.9)        74.3     (3.3)         72.6     (2.5)
New Mexico        65.7      (4.5)         64.2      (3.9)        64.9     (3.1)        60.5     (4.7)        64.3     (3.9)         62.5     (3.1)
New York          65.6      (3.3)         70.3      (2.7)        68.0     (2.2)        65.3     (3.5)        71.4     (2.7)         68.5     (2.4)
North Carolina    68.5      (3.5)         72.5      (2.9)        70.6     (2.4)        67.1     (3.3)        71.4     (2.7)         69.3     (2.2)
North Dakota      66.5      (3.7)         68.0      (3.1)        67.3     (2.4)        67.3     (3.5)        70.6     (3.1)         69.0     (2.4)
Ohio              62.2      (4.3)         67.3      (3.9)        64.9     (2.9)        59.1     (4.7)        66.0     (3.5)         62.7     (2.9)
Oklahoma          66.0      (4.3)         71.2      (3.3)        68.7     (2.7)        60.7     (4.3)        67.8     (3.5)         64.4     (2.7)
Oregon            66.1      (2.7)         71.5      (2.4)        68.9     (1.8)        66.2     (2.7)        74.4     (2.4)         70.4     (1.8)
Pennsylvania      66.8      (3.3)         70.7      (2.7)        68.9     (2.2)        66.2     (3.1)        71.5     (2.7)         69.0     (2.2)
Rhode Island      70.3      (3.9)         72.5      (2.9)        71.5     (2.4)        68.6     (3.7)        76.2     (3.1)         72.6     (2.4)
South Carolina    66.5      (3.9)         73.6      (3.1)        70.2     (2.5)        67.5     (3.9)        71.2     (2.9)         69.4     (2.5)
South Dakota      62.8      (3.7)         68.8      (3.1)        65.9     (2.5)        60.9     (3.9)        65.8     (3.1)         63.4     (2.5)
Tennessee         65.4      (2.9)         68.4      (2.5)        67.0     (2.0)        64.5     (2.9)        69.4     (2.5)         67.1     (2.0)
Texas             62.9      (3.5)         70.4      (2.7)        66.8     (2.2)        65.8     (3.3)        70.9     (2.7)         68.4     (2.2)
Utah              56.6      (3.9)         62.1      (3.5)        59.4     (2.7)        63.3     (3.7)        62.3     (3.3)         62.8     (2.5)
Vermont           65.0      (3.7)         73.3      (3.1)        69.3     (2.4)        72.8     (3.7)        72.9     (2.9)         72.8     (2.4)
Virginia          68.4      (3.9)         68.6      (3.1)        68.5     (2.4)        67.9     (3.7)        74.4     (2.9)         71.2     (2.5)
Washington        68.5      (3.1)         73.1      (2.5)        70.8     (2.0)        66.7     (2.9)        75.9     (2.5)         71.4     (2.0)
West Virginia     65.3      (3.1)         67.7      (2.5)        66.6     (2.0)        60.3     (3.5)        67.9     (2.7)         64.3     (2.2)
Wisconsin         67.3      (3.9)         76.6      (3.3)        72.2     (2.5)        62.4     (3.9)        72.3     (3.5)         67.5     (2.5)

Median            65.3                    69.6                   67.3                  65.5                  70.3                   67.9
Low               56.6                    62.1                   59.4                  58.4                  60.4                   59.5
High              72.3                    76.6                   73.7                  74.6                  76.4                   75.6
-----------------------------------------------------------------------------------------------------------------------------------------------------
* Confidence interval.
=======================================================================================================================================================
Return to top. Table_14 Note: To print large tables and graphs users may have to change their printer settings to landscape and use a small font size.
TABLE 14. Percentage of adults who reported having their blood cholesterol tested in the
past 5 years, by sex -- Behavioral Risk Factor Surveillance System, 1992 and 1993
======================================================================================================================================================
                                                1992                                                                1993
                  ---------------------------------------------------------------     --------------------------------------------------------------
                           Men                  Women                  Total                   Men                 Women                  Total
                  -------------------    ------------------     -----------------     -----------------     ------------------     -----------------
State              %    (+/-95% CI *)     %     (+/-95% CI)      %    (+/-95% CI)      %    (+/-95% CI)      %     (+/-95% CI)      %    (+/-95% CI)
----------------------------------------------------------------------------------------------------------------------------------------------------
Alabama           62.9      (3.3)        68.2      (2.9)        65.7     (2.2)        60.4     (3.5)        63.8      (2.9)        62.2     (2.4)
Alaska            58.4      (5.7)        65.1      (4.7)        61.6     (3.7)        61.3     (5.1)        63.0      (4.9)        62.1     (3.5)
Arizona           59.1      (4.9)        65.6      (4.1)        62.5     (3.3)        63.6     (4.9)        66.1      (4.3)        64.9     (3.3)
Arkansas                                                                              59.1     (4.1)        61.7      (3.1)        60.5     (2.5)
California        59.9      (2.5)        67.6      (2.2)        63.8     (1.8)        63.0     (2.9)        71.1      (2.4)        67.1     (2.0)
Colorado          63.9      (3.7)        68.1      (3.1)        66.1     (2.5)        62.9     (3.7)        66.7      (3.3)        64.8     (2.5)
Connecticut       66.9      (3.7)        70.8      (3.1)        68.9     (2.4)        68.2     (3.9)        72.3      (2.9)        70.3     (2.4)
Delaware          63.6      (4.3)        65.2      (3.3)        64.5     (2.7)        64.7     (3.7)        66.2      (2.9)        65.5     (2.4)
District
  of Columbia     63.1      (4.7)        74.5      (3.5)        69.3     (2.9)        60.3     (4.7)        66.6      (3.7)        63.7     (2.9)
Florida           67.0      (3.1)        74.6      (2.5)        71.0     (2.0)        66.6     (2.9)        72.6      (2.4)        69.8     (1.8)
Georgia           63.4      (3.7)        67.5      (3.3)        65.6     (2.5)        60.1     (3.7)        68.1      (3.1)        64.3     (2.4)
Hawaii            66.9      (3.9)        65.8      (3.7)        66.4     (2.7)        68.7     (3.9)        67.8      (3.3)        68.2     (2.5)
Idaho             55.2      (3.7)        64.4      (3.3)        59.9     (2.5)        60.9     (4.3)        65.4      (3.3)        63.2     (2.7)
Illinois          62.1      (3.7)        69.0      (2.7)        65.8     (2.4)        60.5     (3.7)        64.0      (2.9)        62.3     (2.4)
Indiana           63.5      (3.3)        61.9      (2.7)        62.6     (2.2)        57.7     (3.5)        63.7      (2.9)        60.9     (2.4)
Iowa              62.9      (3.7)        70.6      (3.1)        67.0     (2.5)        64.6     (3.5)        70.6      (3.1)        67.8     (2.5)
Kansas            65.1      (3.9)        65.8      (3.7)        65.5     (2.7)        60.5     (4.1)        67.1      (3.5)        63.9     (2.7)
Kentucky          56.3      (3.9)        61.5      (2.9)        59.0     (2.4)        58.2     (3.3)        64.6      (2.7)        61.6     (2.4)
Louisiana         57.4      (4.3)        66.6      (3.3)        62.3     (2.7)        60.9     (4.3)        65.8      (3.3)        63.5     (2.7)
Maine             62.8      (4.3)        72.1      (3.7)        67.7     (2.9)        64.0     (4.3)        69.3      (3.7)        66.7     (2.9)
Maryland          67.7      (3.5)        68.6      (2.9)        68.2     (2.4)        67.3     (2.5)        71.6      (2.0)        69.6     (1.6)
Massachusetts     71.3      (3.9)        73.8      (3.3)        72.6     (2.5)        72.6     (3.7)        74.2      (3.1)        73.4     (2.4)
Michigan          65.8      (3.1)        70.6      (2.7)        68.3     (2.2)        65.8     (3.3)        72.3      (2.7)        69.2     (2.2)
Minnesota         64.3      (2.7)        73.8      (2.2)        69.2     (1.8)        62.6     (2.5)        72.0      (2.2)        67.5     (1.8)
Mississippi       55.4      (4.5)        64.6      (3.5)        60.3     (2.7)        56.2     (4.3)        57.8      (3.5)        57.0     (2.9)
Missouri          61.6      (4.3)        68.7      (3.5)        65.4     (2.7)        61.5     (4.3)        67.0      (3.3)        64.4     (2.7)
Montana           61.9      (4.7)        65.0      (4.1)        63.5     (3.1)        61.2     (4.7)        67.5      (4.1)        64.5     (3.1)
Nebraska          58.7      (4.1)        65.4      (3.3)        62.2     (2.5)        58.0     (3.7)        65.7      (3.1)        62.0     (2.5)
Nevada            60.8      (4.3)        67.1      (3.3)        63.9     (2.7)        57.6     (4.1)        63.9      (3.3)        60.7     (2.5)
New Hampshire     66.2      (4.1)        73.4      (3.7)        69.9     (2.7)        64.3     (4.1)        72.1      (3.3)        68.3     (2.7)
New Jersey        64.9      (4.3)        68.0      (3.5)        66.5     (2.7)        67.5     (4.1)        71.7      (3.3)        69.7     (2.7)
New Mexico        62.3      (4.5)        63.1      (3.9)        62.7     (2.9)        56.7     (4.7)        61.5      (3.9)        59.2     (3.1)
New York          64.9      (3.3)        69.2      (2.7)        67.2     (2.2)        63.2     (3.5)        69.9      (2.9)        66.7     (2.4)
North Carolina    65.7      (3.5)        70.5      (2.9)        68.2     (2.4)        64.2     (3.3)        68.6      (2.7)        66.5     (2.2)
North Dakota      64.0      (3.7)        65.7      (3.1)        64.8     (2.4)        63.7     (3.5)        66.6      (3.1)        65.2     (2.4)
Ohio              60.8      (4.5)        66.5      (3.9)        63.8     (2.9)        57.1     (4.7)        64.9      (3.5)        61.2     (2.9)
Oklahoma          64.5      (4.5)        69.7      (3.3)        67.2     (2.7)        58.9     (4.3)        66.3      (3.5)        62.8     (2.7)
Oregon            63.1      (2.7)        69.1      (2.4)        66.2     (1.8)        61.5     (2.7)        70.8      (2.5)        66.3     (2.0)
Pennsylvania      64.0      (3.3)        69.0      (2.7)        66.7     (2.2)        63.8     (3.3)        68.7      (2.7)        66.4     (2.2)
Rhode Island      68.7      (3.9)        71.8      (3.1)        70.3     (2.4)        66.9     (3.9)        74.8      (3.3)        71.1     (2.5)
South Carolina    64.9      (3.9)        71.9      (3.1)        68.6     (2.5)        65.2     (4.1)        68.5      (2.9)        67.0     (2.5)
South Dakota      61.7      (3.7)        67.2      (3.1)        64.5     (2.5)        59.0     (3.9)        63.9      (3.1)        61.5     (2.5)
Tennessee         64.3      (3.1)        67.3      (2.5)        65.9     (2.0)        62.9     (2.9)        67.7      (2.5)        65.4     (2.0)
Texas             61.0      (3.5)        68.4      (2.7)        64.8     (2.4)        62.9     (3.3)        68.7      (2.7)        65.9     (2.2)
Utah              55.4      (3.9)        61.3      (3.5)        58.4     (2.7)        60.1     (3.9)        60.0      (3.3)        60.1     (2.5)
Vermont           62.3      (3.7)        71.9      (3.1)        67.3     (2.4)        69.2     (3.7)        70.1      (2.9)        69.6     (2.4)
Virginia          67.3      (3.9)        67.6      (3.1)        67.5     (2.4)        64.9     (3.9)        72.3      (2.9)        68.7     (2.5)
Washington        65.9      (3.1)        72.0      (2.5)        69.0     (2.0)        63.1     (2.9)        72.6      (2.5)        68.0     (2.0)
West Virginia     63.8      (3.3)        66.8      (2.5)        65.4     (2.2)        57.8     (3.5)        65.6      (2.7)        61.9     (2.2)
Wisconsin         65.8      (3.9)        74.6      (3.3)        70.4     (2.5)        58.9     (4.1)        69.5      (3.5)        64.4     (2.7)

Median            63.5                   68.1                   65.9                  62.7                  67.6                   65.0
Low               55.2                   61.3                   58.4                  56.2                  57.8                   57.0
High              71.3                   74.6                   72.6                  72.6                  74.8                   73.4
----------------------------------------------------------------------------------------------------------------------------------------------------
* Confidence interval.
======================================================================================================================================================
Return to top. Table_15 Note: To print large tables and graphs users may have to change their printer settings to landscape and use a small font size.
TABLE 15. Percentage of women with an intact uterine cervix who reported having had a
Papanicolaou (Pap) smear -- Behavioral Risk Factor Surveillance System, 1992 and 1993
=====================================================================================================================================================

                                                                                      Had a Pap smear in the past 3 years
                                                               ------------------------------------------------------------------------------------
                                                                                1992                                         1993
                            Ever had a Pap smear               ----------------------------------------     ---------------------------------------
                  ----------------------------------------                                Routine                                      Routine
                          1992                 1993 *           For any reason            checkup            For any reason            checkup
                  -------------------    -----------------     -----------------     ------------------     -----------------     -----------------
State              %    (+/-95% CI +)     %    (+/-95% CI)      %    (+/-95% CI)      %     (+/-95% CI)      %    (+/-95% CI)      %    (+/-95% CI)
---------------------------------------------------------------------------------------------------------------------------------------------------
Alabama           94.9      (1.8)        95.2     (1.8)        86.8     (2.4)        83.4      (2.7)        90.2     (2.4)        87.4     (2.5)
Alaska            97.0      (1.8)        95.9     (2.5)        89.8     (3.1)        79.4      (4.5)        89.5     (3.9)        85.7     (4.1)
Arizona           96.1      (2.0)        94.4     (2.7)        89.3     (2.9)        83.9      (3.5)        86.3     (3.7)        81.1     (3.9)
Arkansas                                 93.0     (2.2)                                                     79.7     (3.3)        77.0     (3.3)
California        91.7      (1.6)        91.7     (1.8)        84.1     (2.0)        75.2      (2.4)        84.7     (2.2)        75.4     (2.5)
Colorado          97.1      (1.4)        95.4     (1.8)        88.0     (2.4)        80.9      (2.9)        85.1     (2.7)        79.4     (3.1)
Connecticut       90.1      (2.5)        88.9     (2.4)        81.4     (2.9)        79.6      (2.9)        81.7     (2.9)        79.0     (2.9)
Delaware          94.7      (2.0)        95.1     (1.6)        85.2     (2.9)        83.5      (2.9)        86.3     (2.4)        84.3     (2.5)
District
  of Columbia     88.3      (3.7)        84.3     (3.1)        85.8     (3.7)        79.5      (4.1)        79.0     (3.3)        76.5     (3.5)
Florida           93.0      (1.6)        93.0     (1.8)        83.2     (2.4)        79.2      (2.5)        82.4     (2.4)        79.0     (2.5)
Georgia           94.4      (2.4)        94.6     (2.0)        87.2     (2.9)        84.2      (3.1)        88.2     (2.4)        85.9     (2.5)
Hawaii            90.2      (2.7)        92.2     (2.4)        82.5     (3.1)        66.7      (3.9)        84.3     (2.9)        80.5     (2.9)
Idaho             90.6      (2.9)        93.6     (2.4)        79.6     (3.5)        76.0      (3.7)        82.9     (3.3)        77.6     (3.5)
Illinois          87.6      (2.5)        88.8     (2.4)        81.1     (2.7)        78.5      (2.9)        80.9     (2.9)        79.1     (2.9)
Indiana           94.6      (1.8)        94.2     (2.0)        80.5     (2.7)        74.4      (2.9)        80.8     (2.9)        75.5     (3.1)
Iowa              90.6      (2.4)        93.9     (2.2)        81.5     (2.9)        78.1      (3.3)        84.3     (2.9)        82.9     (3.1)
Kansas            96.6      (2.0)        96.2     (1.8)        87.8     (3.1)        84.0      (3.5)        86.9     (2.9)        84.6     (3.1)
Kentucky          90.7      (2.2)        92.2     (2.0)        78.3     (2.9)        75.4      (2.9)        78.4     (2.7)        76.6     (2.7)
Louisiana         91.5      (2.5)        93.5     (2.0)        81.0     (3.3)        77.6      (3.5)        85.3     (2.7)        82.1     (2.9)
Maine             95.6      (2.0)        95.3     (2.2)        84.7     (3.3)        83.2      (3.3)        85.9     (3.1)        84.6     (3.3)
Maryland          93.5      (2.0)        91.6     (1.6)        86.2     (2.5)        84.5      (2.5)        85.8     (1.8)        84.1     (1.8)
Massachusetts     92.1      (2.4)        92.2     (2.4)        83.4     (3.1)        77.7      (3.5)        84.2     (2.9)        80.5     (3.1)
Michigan          93.6      (2.0)        93.8     (1.6)        84.0     (2.5)        77.5      (2.7)        83.3     (2.4)        77.5     (2.7)
Minnesota         95.0      (1.2)        94.9     (1.4)        86.2     (2.0)        79.3      (2.2)        84.6     (2.0)        80.1     (2.2)
Mississippi       91.3      (2.5)        92.8     (2.2)        80.9     (3.7)        75.3      (3.9)        79.4     (3.5)        74.6     (3.7)
Missouri          94.1      (2.0)        95.7     (1.6)        83.8     (3.3)        81.5      (3.3)        85.5     (2.9)        83.0     (3.1)
Montana           94.7      (2.2)        94.2     (2.4)        81.8     (3.7)        78.2      (3.9)        82.3     (3.7)        78.5     (3.9)
Nebraska          92.1      (2.4)        93.8     (1.8)        79.8     (3.3)        76.2      (3.5)        84.9     (2.5)        80.3     (2.9)
Nevada            94.1      (2.4)        94.6     (2.2)        80.9     (3.3)        75.3      (3.7)        84.0     (2.9)        78.2     (3.3)
New Hampshire     95.1      (2.2)        90.9     (2.7)        84.4     (3.3)        78.7      (3.7)        84.3     (3.1)        78.9     (3.5)
New Jersey        86.6      (2.9)        86.4     (3.3)        76.2     (3.5)        74.7      (3.7)        79.1     (3.5)        76.1     (3.7)
New Mexico        92.9      (3.1)        95.0     (2.0)        83.2     (3.9)        79.6      (4.1)        84.6     (3.5)        80.0     (3.7)
New York          89.0      (2.2)        90.4     (2.2)        79.1     (2.7)        76.4      (2.7)        81.6     (2.7)        78.5     (2.7)
North Carolina    94.8      (1.8)        94.5     (1.8)        87.0     (2.5)        84.6      (2.7)        85.0     (2.4)        83.3     (2.5)
North Dakota      95.0      (1.8)        94.2     (2.0)        81.2     (2.9)        75.7      (3.3)        83.4     (2.9)        79.6     (3.1)
Ohio              93.9      (2.4)        93.1     (2.4)        81.7     (3.5)        78.4      (3.7)        84.2     (3.1)        81.9     (3.3)
Oklahoma          96.0      (1.8)        94.4     (2.5)        84.5     (2.9)        81.1      (3.3)        83.4     (3.5)        81.7     (3.9)
Oregon            93.1      (1.6)        96.6     (1.2)        83.2     (2.2)        76.9      (2.5)        86.0     (2.2)        81.6     (2.4)
Pennsylvania      92.9      (2.0)        89.4     (2.4)        81.7     (2.5)        74.9      (2.9)        77.3     (2.7)        73.5     (2.9)
Rhode Island      92.2      (2.4)        92.6     (2.0)        78.9     (2.9)        74.5      (3.3)        83.5     (2.7)        78.6     (3.1)
South Carolina    93.5      (2.4)        95.8     (1.6)        84.6     (2.9)        77.3      (3.7)        87.3     (2.4)        83.8     (2.7)
South Dakota      95.8      (1.8)        95.3     (1.8)        83.6     (2.7)        79.9      (2.9)        82.4     (2.9)        80.4     (2.9)
Tennessee         90.2      (2.0)        91.7     (1.8)        82.6     (2.5)        80.1      (2.5)        83.8     (2.4)        81.7     (2.4)
Texas             90.3      (2.2)        91.0     (2.2)        81.3     (2.9)        75.0      (3.1)        86.1     (2.5)        81.8     (2.7)
Utah              90.5      (3.1)        89.3     (3.1)        80.7     (4.1)        76.9      (4.1)        79.7     (3.5)        75.2     (3.5)
Vermont           96.0      (1.8)        94.7     (1.8)        87.9     (2.4)        83.1      (2.9)        84.7     (2.5)        82.2     (2.7)
Virginia          91.7      (2.4)        92.9     (2.2)        83.9     (2.9)        79.4      (3.3)        84.7     (2.9)        81.9     (3.1)
Washington        95.6      (1.4)        96.5     (1.4)        86.2     (2.2)        79.3      (2.5)        88.4     (2.2)        82.9     (2.5)
West Virginia     90.9      (2.0)        93.2     (1.8)        76.5     (2.7)        73.2      (2.9)        79.1     (2.5)        73.1     (2.9)
Wisconsin         93.9      (2.5)        93.2     (2.4)        82.9     (3.3)        76.4      (3.7)        80.1     (3.5)        74.8     (3.7)

Median            93.5                   93.7                  83.2                  78.4                   84.2                  80.2
Low               86.6                   84.3                  76.2                  66.7                   77.3                  73.1
High              97.1                   96.6                  89.8                  84.6                   90.2                  87.4
---------------------------------------------------------------------------------------------------------------------------------------------------
* The description of a Pap smear was different in 1992 and 1993 (see Methods).
+ Confidence interval.
=====================================================================================================================================================
Return to top. Table_16 Note: To print large tables and graphs users may have to change their printer settings to landscape and use a small font size.
TABLE 16. Percentage of women who reported having had a mammogram -- Behavioral
Risk Factor Surveillance System, 1992 and 1993
=======================================================================================================================================================
                                                                                         Had a mammogram in the past 2 years
                                                                                            (women >= 50 years of age)
                                                                 ------------------------------------------------------------------------------------
                             Ever had a mammogram                                 1992                                        1993
                           (women >=40 years of age)             ---------------------------------------     ----------------------------------------
                    ----------------------------------------                                Routine                                      Routine
                           1992                 1993 *            For any reason            checkup           For any reason             checkup
                    -------------------    -----------------     -----------------     -----------------     -----------------     ------------------
State                %    (+/-95% CI +)     %    (+/-95% CI)      %    (+/-95% CI)      %    (+/-95% CI)      %    (+/-95% CI)      %     (+/-95% CI)
-----------------------------------------------------------------------------------------------------------------------------------------------------
Alabama             74.3      (3.3)        78.0     (3.3)        65.5      (4.3)       57.6      (4.9)       68.9      (4.5)       63.6       (4.7)
Alaska              75.2      (6.1)        81.1     (6.7)        64.6     (10.2)       60.0     (10.4)       63.4     (12.2)       57.9      (12.2)
Arizona             75.2      (4.9)        73.5     (4.9)        65.2      (5.9)       55.1      (6.7)       67.9      (6.1)       61.7       (6.3)
Arkansas                                   70.7     (3.9)                                                    58.2      (4.9)       52.7       (4.9)
California          79.9      (2.7)        85.0     (2.4)        71.8      (3.5)       65.0      (3.7)       74.0      (3.5)       67.6       (3.7)
Colorado            80.2      (3.5)        81.9     (3.3)        70.9      (4.9)       62.8      (5.5)       71.5      (5.1)       64.8       (5.3)
Connecticut         81.9      (3.3)        82.9     (3.1)        69.5      (4.7)       63.5      (5.1)       72.2      (4.7)       64.9       (5.1)
Delaware            78.0      (4.1)        81.2     (3.3)        66.1      (5.3)       61.8      (5.5)       71.5      (4.5)       66.5       (4.7)
District
  of Columbia       81.0      (3.7)        68.5     (4.9)        75.8      (5.1)       72.5      (5.3)       56.6      (6.9)       53.7       (6.9)
Florida             73.0      (3.1)        77.8     (2.5)        63.4      (3.9)       57.9      (3.9)       66.2      (3.5)       60.5       (3.7)
Georgia             71.4      (4.1)        78.6     (3.3)        57.7      (5.1)       53.3      (5.1)       65.6      (4.7)       60.6       (4.9)
Hawaii &            75.9      (4.3)        81.8     (3.7)        69.4      (6.1)                             72.4      (6.3)       69.8       (6.5)
Idaho               72.0      (4.1)        76.3     (3.7)        53.2      (5.5)       44.5      (5.5)       59.3      (5.5)       52.4       (5.5)
Illinois            73.8      (3.5)        74.2     (3.5)        64.3      (4.5)       55.8      (4.7)       63.6      (4.9)       56.9       (4.9)
Indiana             71.9      (3.3)        75.2     (3.3)        57.0      (4.5)       48.6      (4.3)       61.5      (4.5)       53.0       (4.7)
Iowa                73.5      (3.9)        75.1     (3.3)        59.4      (5.1)       54.0      (5.1)       65.0      (4.5)       57.9       (4.7)
Kansas              69.4      (4.7)        74.8     (4.3)        57.3      (5.9)       50.6      (5.9)       66.3      (5.7)       60.4       (5.9)
Kentucky            67.0      (3.5)        69.1     (3.3)        49.9      (4.7)       43.5      (4.5)       55.2      (4.1)       48.2       (4.1)
Louisiana           65.4      (4.3)        69.3     (4.1)        56.4      (5.7)       48.8      (5.7)       58.8      (5.1)       53.9       (5.3)
Maine               79.7      (4.1)        78.8     (4.1)        66.7      (5.9)       58.5      (6.3)       70.7      (5.3)       68.0       (5.3)
Maryland            80.2      (3.5)        80.8     (2.4)        72.8      (4.9)       63.9      (5.1)       72.6      (3.3)       67.7       (3.5)
Massachusetts       78.9      (4.5)        83.6     (3.5)        65.9      (6.3)       58.6      (6.5)       73.7      (5.1)       65.0       (5.5)
Michigan            82.3      (2.7)        80.4     (3.1)        69.4      (4.1)       62.1      (4.3)       70.3      (4.3)       64.0       (4.5)
Minnesota           80.6      (2.5)        82.7     (2.4)        69.5      (3.5)       63.1      (3.5)       68.2      (3.5)       63.1       (3.7)
Mississippi         57.3      (4.5)        68.8     (4.5)        44.3      (5.5)       41.5      (5.3)       55.6      (5.3)       50.3       (5.5)
Missouri            70.9      (4.3)        76.6     (3.9)        60.7      (5.7)       53.3      (5.9)       60.3      (5.7)       52.3       (5.9)
Montana             74.3      (4.9)        76.6     (4.5)        62.7      (6.3)       53.8      (6.5)       64.7      (6.1)       60.1       (6.3)
Nebraska            65.8      (4.3)        72.6     (3.7)        50.3      (5.3)       43.7      (5.3)       59.4      (4.9)       54.3       (4.9)
Nevada              72.0      (4.3)        76.0     (3.7)        58.8      (5.9)       51.3      (5.9)       64.2      (5.1)       58.2       (5.3)
New Hampshire       78.7      (4.3)        83.0     (3.5)        66.9      (5.9)       58.7      (6.1)       72.0      (5.5)       67.3       (5.9)
New Jersey          69.2      (4.9)        78.7     (4.1)        56.5      (6.1)       49.4      (5.9)       65.8      (5.7)       60.3       (5.9)
New Mexico          76.4      (4.9)        79.1     (4.1)        64.8      (6.3)       59.2      (6.5)       68.4      (6.1)       61.4       (6.1)
New York            75.6      (3.7)        80.2     (3.1)        61.6      (4.9)       55.0      (5.1)       70.9      (4.3)       64.2       (4.5)
North Carolina      73.2      (3.7)        78.3     (3.1)        61.7      (4.9)       55.9      (4.9)       66.3      (4.3)       62.0       (4.5)
North Dakota        73.5      (3.9)        79.4     (3.5)        55.9      (5.5)       51.5      (5.3)       69.7      (4.9)       63.5       (5.1)
Ohio                71.6      (4.7)        78.9     (3.7)        56.9      (5.9)       51.8      (5.9)       64.3      (5.3)       55.3       (5.5)
Oklahoma            71.4      (3.9)        73.4     (4.1)        54.0      (4.9)       48.8      (5.1)       60.1      (5.1)       55.8       (5.3)
Oregon              81.9      (2.4)        84.8     (2.4)        68.7      (3.5)       61.9      (3.5)       70.9      (3.7)       64.8       (4.1)
Pennsylvania        72.8      (3.3)        77.8     (2.9)        60.7      (4.5)       56.1      (4.5)       63.4      (4.1)       57.8       (4.3)
Rhode Island        79.7      (3.5)        82.6     (3.3)        67.5      (4.9)       61.1      (5.1)       72.9      (4.7)       64.9       (4.7)
South Carolina      71.1      (3.9)        76.2     (3.7)        58.4      (5.1)       52.5      (5.3)       67.1      (4.7)       60.2       (4.9)
South Dakota        74.0      (3.7)        78.4     (3.5)        59.9      (4.9)       51.1      (5.1)       64.3      (4.7)       59.8       (4.7)
Tennessee           68.1      (3.5)        70.0     (3.1)        54.5      (4.5)       48.8      (4.3)       58.1      (4.1)       51.1       (4.1)
Texas               69.9      (3.7)        76.7     (3.5)        59.4      (4.9)       54.8      (4.9)       65.2      (4.7)       59.9       (4.9)
Utah                78.1      (3.7)        75.9     (4.3)        62.0      (5.3)       52.8      (5.5)       66.1      (5.5)       61.7       (5.7)
Vermont             77.4      (3.5)        76.8     (3.5)        65.0      (5.1)       58.8      (5.1)       66.2      (4.9)       59.4       (5.1)
Virginia            73.5      (4.1)        77.0     (3.9)        64.7      (5.3)       59.6      (5.5)       61.0      (5.3)       54.6       (5.5)
Washington          80.9      (2.9)        85.7     (2.7)        68.8      (4.3)       60.7      (4.5)       74.6      (4.3)       68.3       (4.5)
West Virginia       67.2      (3.3)        75.8     (2.9)        50.8      (3.9)       43.9      (3.9)       62.9      (4.1)       52.7       (4.1)
Wisconsin           76.9      (4.1)        79.6     (4.1)        62.4      (6.1)       57.2      (6.3)       62.2      (5.9)       56.9       (5.9)

Median              74.0                   77.9                  62.4                  55.4                  65.9                  60.2
Low                 57.3                   68.5                  44.3                  41.5                  55.2                  48.2
High                82.3                   85.7                  75.8                  72.5                  74.6                  69.8
-----------------------------------------------------------------------------------------------------------------------------------------------------
* The description of a mammogram was different in 1992 and 1993 (see Methods).
+ Confidence interval.
& Some data for Hawaii were excluded because of data collection errors.
=======================================================================================================================================================
Return to top. Table_17 Note: To print large tables and graphs users may have to change their printer settings to landscape and use a small font size.
TABLE 17. Percentage of women who reported having had a clinical breast examination
(CBE) -- Behavioral Risk Factor Surveillance System, 1992 and 1993
=======================================================================================================================================================
                                                                                           Had a CBE in the past 2 years
                                                                                             (women >=50 years of age)
                                                                 ------------------------------------------------------------------------------------
                               Ever had a CBE                                     1992                                         1993
                          (women >=40 years of age)              ----------------------------------------    ----------------------------------------
                  ------------------------------------------                                Routine                                      Routine
                         1992                   1993 *            For any reason            checkup           For any reason             checkup
                  -------------------      -----------------     -----------------     ------------------    -----------------      -----------------
State              %    (+/-95% CI +)       %    (+/-95% CI)      %    (+/-95% CI)      %     (+/-95% CI)     %    (+/-95% CI)       %    (+/-95% CI)
-----------------------------------------------------------------------------------------------------------------------------------------------------
Alabama           88.7      (2.5)          85.6     (2.9)        75.9     (4.1)        68.3      (4.5)       74.0      (4.3)        71.5      (4.3)
Alaska            94.8      (2.7)          95.0     (2.7)        78.6     (8.8)        74.9      (9.0)       78.2     (11.2)        73.2     (11.6)
Arizona           89.7      (3.1)          89.3     (3.7)        74.4     (5.9)        65.9      (6.5)       79.0      (5.3)        73.1      (5.9)
Arkansas                                   86.3     (2.9)                                                    64.8      (4.9)        61.8      (4.9)
California        88.1      (2.2)          88.6     (2.2)        74.2     (3.5)        68.0      (3.7)       76.1      (3.5)        70.8      (3.7)
Colorado          96.0      (1.8)          93.0     (2.4)        82.4     (4.3)        75.8      (4.9)       78.9      (4.7)        74.2      (5.1)
Connecticut       90.7      (2.4)          90.8     (2.4)        78.8     (4.1)        74.2      (4.5)       79.2      (4.1)        73.3      (4.7)
Delaware          92.5      (2.5)          90.5     (2.2)        74.9     (4.9)        71.7      (5.1)       75.5      (4.1)        71.4      (4.3)
District
  of Columbia     86.2      (3.3)          81.6     (4.1)        81.2     (4.5)        79.3      (4.7)       61.4      (6.9)        59.0      (7.1)
Florida           86.3      (2.5)          87.3     (2.2)        71.7     (3.7)        67.7      (3.7)       69.6      (3.3)        65.5      (3.5)
Georgia           90.1      (2.9)          89.6     (2.5)        72.5     (4.9)        67.7      (5.1)       78.2      (4.1)        75.3      (4.3)
Hawaii &          85.1      (3.7)          90.6     (2.7)        72.0     (5.9)                              78.0      (4.9)        75.9      (5.1)
Idaho             93.3      (2.2)          92.4     (2.4)        73.7     (4.3)        67.2      (4.9)       71.2      (5.1)        66.1      (5.3)
Illinois          86.1      (2.9)          86.7     (2.5)        76.6     (4.1)        72.4      (4.3)       75.8      (3.9)        70.1      (4.3)
Indiana           87.9      (2.4)          88.9     (2.5)        66.2     (4.3)        57.0      (4.5)       70.0      (4.3)        63.7      (4.5)
Iowa              90.4      (2.5)          90.8     (2.7)        72.3     (4.5)        67.0      (4.7)       73.4      (4.5)        69.0      (4.5)
Kansas            85.4      (3.5)          91.5     (2.7)        69.3     (5.5)        65.1      (5.7)       72.5      (5.3)        68.6      (5.5)
Kentucky          84.6      (2.7)          85.5     (2.4)        62.7     (4.5)        57.1      (4.5)       63.3      (3.7)        57.2      (3.9)
Louisiana         81.5      (3.7)          82.9     (3.5)        60.5     (5.7)        52.8      (5.7)       68.5      (4.7)        64.4      (5.1)
Maine             90.7      (3.1)          92.6     (2.5)        80.4     (4.9)        75.5      (5.7)       77.9      (4.9)        76.3      (5.1)
Maryland          93.2      (2.2)          90.5     (1.8)        83.2     (4.1)        77.1      (4.9)       79.1      (3.1)        76.2      (3.1)
Massachusetts     86.3      (3.7)          90.5     (2.7)        70.8     (5.9)        66.4      (6.1)       74.9      (4.9)        68.5      (5.3)
Michigan          86.8      (2.5)          88.3     (2.5)        70.5     (3.9)        65.2      (4.1)       68.7      (4.3)        64.8      (4.5)
Minnesota         92.5      (1.6)          92.9     (1.6)        75.0     (3.3)        69.1      (3.5)       73.8      (3.5)        67.8      (3.7)
Mississippi       86.3      (3.1)          86.7     (3.1)        61.3     (5.5)        58.6      (5.5)       65.7      (5.3)        61.7      (5.5)
Missouri          87.1      (2.9)          93.1     (2.4)        69.7     (4.9)        65.7      (5.1)       70.5      (5.5)        65.6      (5.5)
Montana           90.1      (3.1)          91.0     (2.9)        76.1     (5.3)        70.1      (5.9)       73.4      (5.7)        66.2      (6.1)
Nebraska          84.9      (3.1)          89.7     (2.5)        64.0     (5.1)        58.1      (5.3)       70.0      (4.5)        65.4      (4.7)
Nevada            83.0      (3.7)          90.3     (2.5)        61.6     (5.9)        55.6      (5.9)       70.9      (4.9)        65.8      (5.1)
New Hampshire     84.9      (3.7)          87.7     (3.3)        64.8     (6.1)        59.7      (6.1)       71.5      (5.5)        67.3      (5.9)
New Jersey        85.8      (3.9)          86.4     (3.5)        72.9     (5.3)        66.7      (5.7)       72.2      (5.3)        67.8      (5.7)
New Mexico        84.0      (3.7)          88.4     (3.1)        65.0     (6.7)        61.6      (6.7)       71.3      (5.5)        66.9      (6.1)
New York          87.4      (2.7)          91.7     (2.2)        73.0     (4.3)        67.7      (4.5)       82.0      (3.5)        77.5      (3.7)
North Carolina    91.0      (2.4)          91.4     (2.2)        77.0     (3.9)        72.5      (4.1)       81.0      (3.5)        77.0      (3.7)
North Dakota      93.2      (2.2)          92.8     (2.4)        65.5     (5.3)        62.3      (5.3)       76.2      (4.3)        71.7      (4.5)
Ohio              86.0      (3.5)          88.2     (2.9)        71.0     (5.5)        67.0      (5.7)       73.9      (4.7)        67.0      (5.1)
Oklahoma          91.1      (2.5)          93.7     (2.2)        73.0     (4.3)        69.7      (4.7)       66.1      (5.1)        62.6      (5.1)
Oregon            92.3      (1.6)          91.9     (1.8)        74.6     (3.1)        70.9      (3.3)       75.6      (3.5)        70.2      (3.9)
Pennsylvania      84.7      (2.7)          83.2     (2.5)        64.8     (4.3)        61.3      (4.5)       60.2      (4.1)        57.1      (4.3)
Rhode Island      88.0      (3.1)          87.4     (3.1)        76.3     (4.5)        70.8      (5.1)       76.9      (4.5)        71.7      (4.7)
South Carolina    87.5      (2.7)          90.8     (2.5)        67.6     (4.7)        63.4      (4.9)       75.1      (4.5)        69.6      (4.7)
South Dakota      90.8      (2.5)          89.8     (2.7)        72.4     (4.3)        67.2      (4.7)       71.3      (4.7)        68.0      (4.7)
Tennessee         86.0      (2.5)          86.5     (2.4)        72.4     (4.1)        68.4      (4.1)       72.7      (3.5)        67.5      (3.7)
Texas             85.2      (2.9)          90.6     (2.4)        67.8     (4.9)        63.4      (5.1)       75.5      (4.1)        71.3      (4.3)
Utah              91.4      (2.5)          91.5     (2.7)        68.4     (5.3)        62.9      (5.7)       73.5      (4.9)        70.0      (5.1)
Vermont           92.5      (2.2)          89.8     (2.5)        77.1     (4.3)        73.9      (4.5)       73.6      (4.5)        68.7      (4.7)
Virginia          84.3      (3.3)          87.2     (3.1)        66.0     (5.3)        61.6      (5.5)       65.8      (5.3)        61.3      (5.5)
Washington        91.1      (2.2)          92.8     (2.0)        74.3     (3.9)        68.8      (4.3)       79.0      (3.9)        75.1      (4.1)
West Virginia     83.1      (2.7)          86.6     (2.4)        66.1     (4.1)        58.9      (4.1)       68.8      (3.7)        61.6      (3.9)
Wisconsin         88.6      (3.3)          88.7     (3.3)        70.4     (5.7)        65.7      (5.9)       67.2      (5.7)        63.3      (5.9)

Median            87.9                     89.8                  72.4                  67.1                  73.4                   68.3
Low               81.5                     81.6                  60.5                  52.8                  60.2                   57.1
High              96.0                     95.0                  83.2                  79.3                  82.0                   77.5
-----------------------------------------------------------------------------------------------------------------------------------------------------
* The description of a CBE was different in 1992 and 1993 (see Methods).
+ Confidence interval.
& Some data for Hawaii were excluded because of data collection errors.
=======================================================================================================================================================
Return to top. Table_18 Note: To print large tables and graphs users may have to change their printer settings to landscape and use a small font size.
TABLE 18. Percentage of women who reported having had both a mammogram and a
clinical breast examination (CBE) -- Behavioral Risk Factor Surveillance System,
1992 and 1993
=======================================================================================================================================================
                                                                                     Had a mammogram and CBE in the past 2 years
                                                                                             (women >=50 years of age)
                                                                -------------------------------------------------------------------------------------
                          Ever had a mammogram and CBE                            1992                                        1993
                           (women >=40 years of age)            ----------------------------------------     ----------------------------------------
                    ----------------------------------------                                Routine                                      Routine
                           1992                 1993 *           For any reason             checkup           For any reason             checkup
                    ------------------     -----------------    ------------------     -----------------     -----------------     ------------------
State                %   (+/-95% CI +)      %    (+/-95% CI)     %     (+/-95% CI)      %    (+/-95% CI)      %    (+/-95% CI)      %     (+/-95% CI)
-----------------------------------------------------------------------------------------------------------------------------------------------------
Alabama             68.5      (3.7)        71.9     (3.5)       58.8      (4.7)        50.0     (4.9)        61.8     (4.7)        56.4      (4.7)
Alaska              74.3      (6.1)        78.9     (6.9)       62.4     (10.4)        58.4    (10.4)        60.4    (12.2)        53.9     (12.2)
Arizona             71.9      (4.9)        68.6     (5.1)       59.3      (6.3)        49.3     (6.7)        64.0     (6.1)        57.5      (6.3)
Arkansas                                   65.7     (4.1)                                                    52.2     (4.9)        47.2      (4.9)
California          74.4      (2.9)        79.6     (2.7)       64.7      (3.7)        56.7     (3.9)        67.3     (3.7)        59.6      (3.9)
Colorado            78.9      (3.7)        79.1     (3.5)       66.5      (5.1)        56.0     (5.7)        66.6     (5.3)        58.6      (5.7)
Connecticut         77.4      (3.5)        77.2     (3.5)       63.7      (5.1)        56.5     (5.3)        66.7     (4.9)        59.9      (5.1)
Delaware            76.1      (4.3)        77.7     (3.5)       61.6      (5.5)        57.0     (5.5)        64.9     (4.5)        59.6      (4.7)
District
  of Columbia       74.6      (4.3)        63.6     (5.3)       70.2      (5.3)        67.3     (5.5)        52.2     (7.1)        49.0      (7.1)
Florida             67.6      (3.3)        71.1     (2.9)       56.2      (3.9)        49.9     (3.9)        57.4     (3.5)        51.6      (3.7)
Georgia             68.7      (4.1)        74.9     (3.5)       54.4      (5.1)        49.2     (5.1)        61.7     (4.9)        56.9      (4.9)
Hawaii &            69.4      (4.7)        77.7     (4.1)       59.9      (6.3)                              65.8     (6.5)        62.4      (6.5)
Idaho               71.0      (4.1)        72.7     (3.9)       50.6      (5.3)        42.0     (5.5)        53.2     (5.7)        46.0      (5.5)
Illinois            70.5      (3.7)        69.5     (3.5)       60.4      (4.5)        52.6     (4.7)        58.5     (4.9)        51.9      (4.9)
Indiana             68.0      (3.5)        70.1     (3.7)       51.2      (4.3)        41.3     (4.3)        55.0     (4.7)        46.7      (4.7)
Iowa                71.1      (4.1)        72.4     (3.7)       56.9      (5.1)        51.0     (5.1)        61.7     (4.7)        54.3      (4.9)
Kansas              65.5      (4.9)        71.8     (4.5)       52.8      (5.9)        46.0     (5.9)        58.3     (5.9)        52.0      (5.9)
Kentucky            64.2      (3.5)        65.9     (3.5)       45.8      (4.5)        39.2     (4.3)        52.0     (3.9)        45.3      (4.1)
Louisiana           59.4      (4.5)        64.5     (4.3)       48.5      (5.9)        41.2     (5.7)        53.5     (5.3)        48.4      (5.3)
Maine               76.8      (4.3)        76.2     (4.3)       64.6      (6.1)        55.9     (6.3)        66.7     (5.5)        63.5      (5.5)
Maryland            80.2      (3.5)        80.8     (2.4)       68.5      (5.1)        58.4     (5.3)        67.2     (3.5)        62.2      (3.7)
Massachusetts       72.3      (4.7)        78.9     (3.9)       57.4      (6.5)        49.7     (6.5)        66.7     (5.5)        57.3      (5.7)
Michigan            75.4      (3.1)        73.1     (3.5)       61.6      (4.3)        53.7     (4.5)        59.3     (4.5)        53.2      (4.9)
Minnesota           77.9      (2.5)        80.3     (2.5)       63.4      (3.7)        56.1     (3.7)        63.6     (3.7)        56.1      (3.9)
Mississippi         54.6      (4.5)        63.8     (4.7)       39.2      (5.3)        36.2     (5.3)        49.8     (5.5)        44.5      (5.5)
Missouri            64.7      (4.3)        74.0     (4.1)       53.0      (5.7)        46.5     (5.7)        54.6     (5.9)        46.1      (5.9)
Montana             71.1      (5.1)        73.8     (4.7)       57.7      (6.5)        48.4     (6.5)        59.3     (6.5)        52.1      (6.5)
Nebraska            59.4      (4.5)        69.6     (3.9)       44.3      (5.3)        37.2     (5.1)        54.0     (4.9)        48.8      (4.9)
Nevada              62.2      (4.7)        72.8     (3.9)       47.8      (5.9)        39.4     (5.7)        59.4     (5.3)        52.6      (5.3)
New Hampshire       72.6      (4.7)        78.0     (4.1)       56.5      (6.3)        48.4     (6.3)        66.6     (5.7)        60.2      (6.1)
New Jersey          64.8      (4.9)        72.6     (4.5)       52.7      (6.1)        45.7     (5.9)        60.3     (5.9)        55.1      (5.9)
New Mexico          68.6      (5.1)        73.6     (4.5)       53.9      (6.9)        48.8     (6.9)        61.0     (6.3)        53.9      (6.1)
New York            71.2      (3.7)        76.5     (3.3)       55.9      (4.9)        49.4     (4.9)        65.3     (4.5)        58.4      (4.7)
North Carolina      70.5      (3.7)        74.2     (3.3)       57.7      (4.9)        51.9     (4.7)        62.5     (4.5)        56.9      (4.5)
North Dakota        71.8      (3.9)        76.9     (3.7)       50.4      (5.5)        46.2     (5.3)        65.4     (5.1)        58.9      (5.1)
Ohio                66.8      (4.9)        73.5     (4.1)       51.7      (5.9)        46.2     (5.9)        58.2     (5.5)        49.2      (5.5)
Oklahoma            69.2      (3.9)        72.0     (4.1)       51.4      (4.9)        46.5     (5.1)        53.7     (5.3)        49.5      (5.3)
Oregon              78.2      (2.5)        80.1     (2.7)       61.4      (3.5)        54.6     (3.7)        63.2     (3.9)        55.9      (4.1)
Pennsylvania        65.3      (3.5)        68.5     (3.3)       50.5      (4.5)        45.0     (4.5)        50.9     (4.3)        44.8      (4.3)
Rhode Island        74.6      (4.1)        75.3     (3.9)       60.2      (5.3)        51.5     (5.3)        65.2     (5.1)        56.8      (4.9)
South Carolina      66.5      (4.1)        73.5     (3.9)       51.8      (5.1)        46.3     (5.3)        61.2     (5.1)        53.7      (5.1)
South Dakota        69.4      (3.9)        74.4     (3.7)       52.5      (4.7)        44.0     (4.9)        57.1     (4.9)        51.9      (4.9)
Tennessee           64.6      (3.7)        66.0     (3.3)       50.7      (4.5)        44.1     (4.3)        55.2     (4.1)        47.9      (4.1)
Texas               65.7      (3.7)        72.4     (3.7)       53.3      (4.9)        48.2     (4.9)        60.0     (4.7)        53.7      (4.9)
Utah                75.0      (3.9)        73.2     (4.5)       55.5      (5.3)        46.4     (5.5)        60.2     (5.7)        56.1      (5.7)
Vermont             75.4      (3.7)        73.3     (3.7)       61.5      (5.1)        55.1     (5.1)        62.2     (5.1)        55.0      (5.1)
Virginia            66.0      (4.5)        70.3     (4.1)       53.0      (5.7)        46.5     (5.9)        51.3     (5.5)        45.1      (5.3)
Washington          75.7      (3.1)        81.7     (2.9)       61.1      (4.5)        53.1     (4.5)        68.0     (4.5)        61.0      (4.7)
West Virginia       62.5      (3.5)        70.4     (3.1)       46.1      (4.1)        38.6     (3.9)        56.3     (4.1)        46.5      (4.1)
Wisconsin           72.1      (4.5)        74.5     (4.5)       54.1      (6.3)        48.8     (6.3)        55.7     (5.9)        49.1      (6.1)

Median              70.5                   73.4                 55.9                   48.4                  60.2                  53.8
Low                 54.6                   63.6                 39.2                   36.2                  49.8                  44.5
High                78.9                   81.7                 70.2                   67.3                  68.0                  63.5
-----------------------------------------------------------------------------------------------------------------------------------------------------
* The descriptions of a mammogram and CBE were different in 1992 and 1993 (see Methods).
+ Confidence interval.
& Some data for Hawaii were excluded because of data collection errors.
=======================================================================================================================================================
Return to top. Table_19 Note: To print large tables and graphs users may have to change their printer settings to landscape and use a small font size.
TABLE 19. Percentage of adults >=40 years of age who reported having had a digital rectal
examination (DRE) -- Behavioral Risk Factor Surveillance System, 1993
======================================================================================================================================================
                                           Ever had a DRE                                              Had a DRE in the past 2 years
                  ---------------------------------------------------------------     --------------------------------------------------------------
                          Men                  Women                  Total                   Men                 Women                  Total
                  -------------------    ------------------     -----------------     -----------------     -------------------    -----------------
State              %    (+/-95% CI *)     %     (+/-95% CI)      %    (+/-95% CI)      %    (+/-95% CI)      %      (+/-95% CI)     %    (+/-95% CI)
----------------------------------------------------------------------------------------------------------------------------------------------------
Alabama           63.7      (4.7)        57.9      (3.7)        60.5     (2.9)        55.1     (4.9)        47.4          (3.9)    50.9     (3.1)
Alaska            85.4      (5.1)        78.0      (6.7)        81.9     (4.1)        60.1     (8.2)        63.4          (7.4)    61.7     (5.5)
Arizona           51.9      (7.3)        52.6      (5.5)        52.2     (4.7)        33.2     (7.1)        33.9          (5.1)    33.5     (4.5)
Arkansas          69.9      (4.9)        61.5      (4.3)        65.3     (3.3)        49.6     (5.3)        42.7          (4.3)    45.8     (3.3)
California        67.2      (3.7)        68.2      (3.1)        67.7     (2.4)        45.7     (3.9)        51.7          (3.1)    48.9     (2.5)
Colorado          77.4      (4.5)        78.0      (3.7)        77.7     (2.9)        56.7     (5.3)        54.3          (4.5)    55.4     (3.5)
Connecticut       75.6      (4.5)        61.1      (4.1)        67.7     (3.1)        62.6     (5.1)        49.6          (4.3)    55.5     (3.3)
Delaware          78.3      (4.5)        72.8      (3.7)        75.3     (2.9)        63.5     (4.9)        58.2          (4.1)    60.6     (3.1)
District
  of Columbia     58.7      (6.1)        49.2      (5.5)        53.4     (4.3)        43.9     (6.5)        36.4          (5.3)    39.7     (4.1)
Florida           74.1      (3.5)        68.9      (3.1)        71.3     (2.4)        54.6     (3.9)        48.1          (3.3)    51.1     (2.5)
Georgia           77.6      (4.3)        74.8      (3.7)        76.0     (2.7)        56.3     (5.1)        61.0          (4.1)    58.9     (3.1)
Hawaii            81.6      (4.5)        76.1      (4.1)        78.8     (3.1)        59.4     (5.5)        57.6          (4.9)    58.5     (3.7)
Idaho             88.4      (3.7)        70.8      (4.3)        79.2     (2.9)        58.6     (6.1)        48.3          (4.5)    53.3     (3.9)
Illinois          57.3      (4.9)        50.2      (3.9)        53.4     (3.1)        42.1     (4.9)        37.8          (3.7)    39.8     (3.1)
Indiana           79.3      (4.1)        72.6      (3.7)        75.7     (2.7)        49.9     (4.9)        48.4          (3.9)    49.1     (3.1)
Iowa              63.6      (4.7)        56.5      (4.3)        59.8     (3.1)        49.1     (4.7)        44.0          (4.5)    46.3     (3.1)
Kansas            69.3      (5.3)        64.1      (4.7)        66.5     (3.5)        54.4     (5.7)        48.4          (4.9)    51.2     (3.7)
Kentucky          42.0      (4.5)        54.3      (3.5)        48.6     (2.9)        27.5     (3.9)        37.6          (3.5)    32.9     (2.7)
Louisiana         65.3      (6.1)        52.3      (4.5)        58.2     (3.7)        44.5     (6.3)        35.0          (4.3)    39.3     (3.7)
Maine             62.9      (5.5)        66.9      (4.9)        65.0     (3.5)        46.0     (5.9)        53.9          (5.1)    50.2     (3.9)
Maryland          73.6      (3.1)        68.8      (2.7)        71.0     (2.2)        57.9     (3.5)        55.2          (2.9)    56.4     (2.4)
Massachusetts     80.8      (4.9)        77.8      (3.9)        79.1     (3.1)        61.2     (5.7)        60.1          (4.7)    60.6     (3.5)
Michigan          76.7      (3.5)        68.0      (3.7)        72.0     (2.5)        57.1     (4.1)        50.1          (3.9)    53.3     (2.9)
Minnesota         80.6      (3.1)        79.8      (2.5)        80.2     (2.0)        54.7     (3.9)        55.3          (3.3)    55.1     (2.5)
Mississippi       69.7      (5.3)        60.4      (4.5)        64.5     (3.5)        46.6     (5.7)        39.6          (4.3)    42.7     (3.3)
Missouri          75.5      (4.7)        58.5      (4.5)        66.2     (3.5)        55.3     (5.5)        36.6          (4.7)    45.1     (3.7)
Montana           77.2      (5.3)        69.1      (4.9)        73.0     (3.7)        55.4     (6.5)        47.9          (5.3)    51.5     (4.1)
Nebraska          76.0      (4.5)        69.4      (3.9)        72.5     (2.9)        49.0     (5.3)        46.7          (4.3)    47.8     (3.3)
Nevada            70.5      (5.5)        61.4      (4.3)        65.9     (3.5)        45.1     (5.9)        41.8          (4.3)    43.5     (3.5)
New Hampshire     70.2      (5.1)        66.6      (4.7)        68.3     (3.3)        54.0     (5.5)        50.2          (4.9)    52.0     (3.7)
New Jersey        71.9      (5.3)        52.6      (4.9)        61.6     (3.7)        51.3     (5.9)        39.1          (4.7)    44.8     (3.7)
New Mexico        79.1      (5.1)        67.8      (4.9)        73.1     (3.7)        56.9     (6.3)        45.1          (5.1)    50.6     (4.1)
New York          79.6      (3.7)        71.2      (3.7)        75.0     (2.7)        59.5     (4.7)        52.7          (3.9)    55.8     (2.9)
North Carolina    74.7      (3.9)        68.5      (3.7)        71.4     (2.7)        52.9     (4.5)        51.8          (3.9)    52.3     (3.1)
North Dakota      85.0      (3.5)        74.8      (3.9)        79.7     (2.7)        57.4     (5.1)        51.6          (4.5)    54.4     (3.3)
Ohio              69.6      (5.3)        61.3      (4.7)        65.2     (3.5)        52.2     (5.7)        41.2          (4.7)    46.3     (3.7)
Oklahoma          51.1      (5.7)        49.5      (4.7)        50.2     (3.7)        38.6     (5.5)        32.2          (4.1)    35.1     (3.5)
Oregon            79.5      (3.5)        75.9      (2.9)        77.6     (2.2)        55.3     (4.1)        56.8          (3.5)    56.1     (2.5)
Pennsylvania      75.8      (3.9)        69.7      (3.3)        72.4     (2.5)        56.3     (4.3)        47.4          (3.7)    51.4     (2.7)
Rhode Island      83.5      (3.7)        76.1      (4.1)        79.4     (2.7)        64.5     (5.1)        60.2          (4.5)    62.1     (3.5)
South Carolina    76.3      (4.3)        73.5      (3.5)        74.8     (2.7)        53.4     (5.1)        54.2          (4.3)    53.8     (3.3)
South Dakota      67.2      (4.7)        57.5      (4.3)        62.0     (3.1)        51.2     (4.9)        44.3          (4.3)    47.5     (3.3)
Tennessee         55.9      (4.1)        62.9      (3.3)        59.7     (2.5)        45.0     (4.1)        48.5          (3.3)    46.9     (2.7)
Texas             77.7      (4.1)        70.6      (3.7)        74.0     (2.7)        55.3     (5.1)        52.4          (4.1)    53.8     (3.3)
Utah              74.9      (5.1)        61.5      (4.9)        67.8     (3.5)        59.9     (5.5)        39.0          (4.7)    48.8     (3.7)
Vermont           77.1      (4.3)        72.1      (3.7)        74.4     (2.7)        59.6     (4.9)        51.9          (4.1)    55.4     (3.1)
Virginia          84.4      (3.9)        70.5      (4.3)        76.9     (3.1)        63.5     (5.3)        52.6          (4.7)    57.6     (3.5)
Washington        85.0      (2.9)        78.4      (3.1)        81.5     (2.2)        64.2     (4.1)        58.8          (3.7)    61.4     (2.7)
West Virginia     75.3      (3.7)        69.4      (3.1)        72.2     (2.4)        51.5     (4.3)        49.8          (3.3)    50.6     (2.7)
Wisconsin         79.7      (4.3)        73.8      (4.5)        76.6     (3.1)        52.5     (5.5)        52.0          (5.1)    52.2     (3.7)

Median            75.5                   68.6                   71.7                  54.6                  49.0                   51.3
Low               42.0                   49.2                   48.6                  27.5                  32.2                   32.9
High              88.4                   79.8                   81.9                  64.5                  63.4                   62.1
----------------------------------------------------------------------------------------------------------------------------------------------------
* Confidence interval.
======================================================================================================================================================
Return to top. Table_20 Note: To print large tables and graphs users may have to change their printer settings to landscape and use a small font size.
TABLE 20. Percentage of adults >=50 years of age who reported having had a
proctoscopic examination -- Behavioral Risk Factor Surveillance System, 1993
===================================================================================
                          Men                  Women                  Total
                  -------------------    ------------------     -----------------
State              %    (+/-95% CI *)     %     (+/-95% CI)      %    (+/-95% CI)
---------------------------------------------------------------------------------
Alabama           40.0      (6.3)        35.1      (4.5)        37.1     (3.7)
Alaska            34.4     (13.1)        39.8     (11.4)        36.8     (8.8)
Arizona           33.0      (9.4)        30.1      (5.9)        31.4     (5.1)
Arkansas          28.6      (6.3)        28.8      (4.5)        28.7     (3.7)
California        41.1      (4.7)        39.1      (3.9)        40.0     (3.1)
Colorado          45.2      (6.7)        40.9      (5.5)        42.9     (4.3)
Connecticut       42.7      (6.9)        35.2      (5.1)        38.6     (4.1)
Delaware          43.1      (6.3)        35.3      (4.3)        38.7     (3.7)
District
  of Columbia     34.5      (7.6)        25.6      (5.9)        29.2     (4.9)
Florida           48.0      (4.5)        33.3      (3.5)        39.9     (2.9)
Georgia           46.4      (6.7)        34.9      (4.7)        39.8     (3.9)
Hawaii            50.9      (7.6)        37.0      (5.7)        43.7     (5.1)
Idaho             37.5      (7.4)        27.9      (4.9)        32.4     (4.5)
Illinois          43.4      (6.1)        32.2      (4.1)        37.1     (3.5)
Indiana           36.5      (5.7)        34.1      (4.5)        35.1     (3.5)
Iowa              41.7      (5.7)        29.5      (4.7)        34.9     (3.7)
Kansas            31.4      (6.7)        30.8      (5.5)        31.0     (4.3)
Kentucky          31.7      (4.9)        30.3      (3.9)        30.9     (3.1)
Louisiana         35.0      (7.4)        34.7      (5.3)        34.8     (4.3)
Maine             29.9      (6.9)        27.2      (4.9)        28.4     (4.1)
Maryland          39.6      (4.3)        28.3      (3.1)        33.3     (2.5)
Massachusetts     37.3      (6.9)        34.5      (5.7)        35.7     (4.3)
Michigan          43.2      (5.9)        37.8      (4.5)        40.2     (3.5)
Minnesota         52.4      (4.9)        50.7      (3.9)        51.5     (3.1)
Mississippi       38.1      (6.7)        28.6      (4.9)        32.7     (4.1)
Missouri          34.4      (6.7)        31.6      (5.3)        32.8     (4.3)
Montana           37.8      (7.6)        36.8      (6.1)        37.3     (4.7)
Nebraska          43.9      (6.5)        34.2      (4.7)        38.4     (3.9)
Nevada            38.1      (7.3)        35.1      (5.1)        36.6     (4.3)
New Hampshire     38.3      (6.9)        30.0      (5.7)        33.7     (4.5)
New Jersey        48.8      (7.6)        29.3      (5.3)        37.7     (4.5)
New Mexico        45.4      (7.4)        33.9      (5.7)        39.2     (4.5)
New York          39.9      (5.5)        34.4      (4.7)        36.9     (3.7)
North Carolina    40.2      (5.9)        29.0      (4.1)        33.8     (3.5)
North Dakota      37.4      (5.9)        46.2      (5.3)        42.2     (3.9)
Ohio              34.6      (6.9)        35.2      (5.3)        34.9     (4.1)
Oklahoma          29.5      (5.7)        27.4      (4.9)        28.3     (3.7)
Oregon            42.6      (4.7)        41.4      (4.1)        42.0     (3.1)
Pennsylvania      44.7      (5.3)        32.6      (4.1)        37.8     (3.3)
Rhode Island      40.7      (6.3)        30.0      (5.1)        34.6     (3.9)
South Carolina    37.2      (6.3)        33.4      (4.9)        35.1     (3.9)
South Dakota      40.7      (6.1)        34.1      (4.9)        37.0     (3.9)
Tennessee         27.5      (4.3)        24.1      (3.1)        25.6     (2.5)
Texas             40.2      (6.3)        39.5      (4.9)        39.8     (3.9)
Utah              41.4      (7.3)        36.7      (5.5)        38.9     (4.5)
Vermont           37.2      (6.5)        32.0      (4.7)        34.3     (3.9)
Virginia          45.4      (6.7)        32.3      (5.1)        38.2     (4.1)
Washington        44.2      (5.7)        41.5      (4.7)        42.8     (3.5)
West Virginia     28.1      (4.9)        28.3      (3.7)        28.2     (3.1)
Wisconsin         47.4      (6.9)        46.0      (5.9)        46.6     (4.5)

Median            39.9                   34.0                   36.8
Low               27.5                   24.1                   25.6
High              52.4                   50.7                   51.5
---------------------------------------------------------------------------------
* Confidence interval.
===================================================================================
Return to top. Table_21 Note: To print large tables and graphs users may have to change their printer settings to landscape and use a small font size.
TABLE 21. Percentage of adults >=65 years of age who reported ever having a pneumococcal
vaccination or having an influenza vaccination in the past 1 year -- Behavioral Risk Factor
Surveillance System, 1993
======================================================================================================================================================
                                Ever had a pneumococcal vaccination                          Had an influenza vaccination in the past 1 year
                  ---------------------------------------------------------------     --------------------------------------------------------------
                         Men                   Women                  Total                   Men                 Women                  Total
                  -----------------      ------------------     -----------------     -----------------     ------------------     -----------------
State              %  (+/-95% CI *)       %     (+/-95% CI)      %    (+/-95% CI)      %    (+/-95% CI)      %     (+/-95% CI)      %    (+/-95% CI)
----------------------------------------------------------------------------------------------------------------------------------------------------
Alabama           23.0      (6.3)        26.4      (5.5)        25.0     (4.1)        38.9     (7.8)        40.8      (5.9)        40.0     (4.7)
Alaska            29.2     (14.7)        32.9     (13.5)        31.1    (10.0)        55.3    (16.9)        51.5     (14.7)        53.3    (11.2)
Arizona           31.1     (11.4)        30.4      (7.1)        30.7     (6.1)        70.6    (10.4)        63.0      (7.6)        66.2     (6.5)
Arkansas          28.9      (8.0)        25.9      (5.3)        27.2     (4.5)        52.9     (9.0)        51.0      (6.5)        51.8     (5.5)
California        29.6      (6.3)        39.9      (5.5)        35.6     (4.3)        48.0     (6.7)        59.0      (5.5)        54.4     (4.3)
Colorado          51.7     (10.6)        31.7      (7.3)        40.0     (6.7)        68.2    (10.4)        61.0      (8.0)        64.0     (6.5)
Connecticut       17.0      (7.3)        20.1      (5.3)        18.8     (4.3)        55.8     (9.8)        51.7      (7.1)        53.3     (5.7)
Delaware          31.2      (8.2)        38.7      (6.5)        35.6     (5.1)        55.4     (9.2)        54.6      (6.7)        54.9     (5.3)
District
  of Columbia     24.9      (9.4)        20.6     (10.0)        22.1     (7.3)        27.0    (10.8)        29.8      (9.0)        28.7     (6.9)
Florida           23.0      (4.9)        26.8      (4.3)        25.2     (3.3)        46.7     (5.9)        46.1      (4.9)        46.3     (3.7)
Georgia           24.2      (8.0)        30.1      (5.9)        27.8     (4.9)        38.8     (9.2)        47.9      (6.9)        44.4     (5.5)
Hawaii            35.1     (10.6)        40.3      (9.0)        37.8     (6.9)        52.1    (11.6)        60.8      (9.2)        56.6     (7.4)
Idaho             30.1      (9.4)        35.4      (7.1)        33.1     (5.9)        65.6    (10.2)        63.5      (6.9)        64.4     (5.9)
Illinois          25.7      (7.3)        21.4      (5.3)        23.1     (4.3)        39.5     (8.2)        48.9      (6.5)        45.2     (5.1)
Indiana           22.2      (7.3)        29.7      (5.9)        26.7     (4.5)        38.7     (8.4)        52.4      (6.5)        47.0     (5.1)
Iowa              33.0      (7.6)        31.9      (5.9)        32.3     (4.7)        53.6     (8.0)        47.1      (6.7)        49.7     (5.1)
Kansas            21.3      (8.6)        24.4      (6.9)        23.1     (5.3)        54.2    (10.8)        51.3      (8.0)        52.4     (6.5)
Kentucky          29.5      (7.3)        20.7      (4.3)        24.2     (3.9)        47.0     (7.4)        42.8      (5.3)        44.5     (4.3)
Louisiana         16.0      (8.2)        20.1      (5.7)        18.5     (4.7)        33.1     (9.6)        38.1      (7.3)        36.1     (5.9)
Maine             13.7      (6.7)        24.8      (6.9)        20.3     (5.1)        48.2    (10.2)        49.9      (8.2)        49.2     (6.3)
Maryland          35.9      (6.7)        32.4      (4.5)        33.8     (3.7)        50.0     (6.9)        47.7      (4.9)        48.6     (4.1)
Massachusetts     17.1      (7.4)        24.2      (6.9)        21.5     (5.1)        49.3    (10.4)        50.0      (7.8)        49.7     (6.3)
Michigan          25.2      (7.4)        24.3      (5.5)        24.7     (4.5)        45.6     (8.8)        49.3      (6.7)        47.8     (5.3)
Minnesota         29.4      (6.1)        23.9      (4.3)        26.1     (3.5)        53.1     (6.5)        49.4      (5.1)        50.9     (3.9)
Mississippi       23.5      (9.0)        30.2      (6.9)        27.6     (5.5)        37.2    (10.2)        45.7      (7.6)        42.4     (6.5)
Missouri          30.0     (10.0)        31.0      (6.9)        30.6     (5.7)        58.2     (9.8)        52.6      (7.3)        54.8     (5.9)
Montana           34.4     (10.2)        33.3      (8.4)        33.8     (6.7)        59.5    (10.8)        64.6      (8.0)        62.4     (6.7)
Nebraska          24.2      (7.4)        29.5      (5.7)        27.4     (4.5)        50.7     (8.6)        54.8      (6.1)        53.2     (5.1)
Nevada            31.0     (10.8)        31.7      (7.6)        31.4     (6.5)        37.9    (10.4)        48.3      (8.0)        43.5     (6.7)
New Hampshire     21.2      (8.4)        17.7      (6.9)        19.1     (5.3)        52.9    (10.6)        47.3      (8.6)        49.6     (6.7)
New Jersey        19.4      (8.2)        23.6      (7.1)        21.9     (5.5)        50.5    (11.2)        55.1      (8.2)        53.2     (6.7)
New Mexico        35.5     (10.2)        28.9      (7.8)        31.8     (6.3)        62.9    (11.4)        59.4      (8.6)        60.9     (6.9)
New York          26.6      (7.4)        19.2      (4.9)        22.1     (4.1)        43.8     (8.6)        46.3      (6.1)        45.3     (5.3)
North Carolina    28.5      (7.8)        24.9      (5.5)        26.3     (4.5)        50.6     (8.4)        51.1      (6.3)        50.9     (5.1)
North Dakota      18.3      (6.3)        20.9      (5.3)        19.8     (3.9)        50.3     (7.8)        47.9      (6.7)        48.9     (5.1)
Ohio              29.3     (10.0)        27.0      (6.3)        27.9     (5.5)        51.4    (11.0)        49.2      (7.1)        50.1     (6.1)
Oklahoma          29.1      (8.6)        29.1      (6.1)        29.1     (4.7)        62.3     (9.2)        55.8      (7.1)        58.4     (5.7)
Oregon            33.8      (6.9)        35.4      (5.5)        34.7     (4.3)        55.4     (7.3)        56.1      (5.5)        55.8     (4.3)
Pennsylvania      26.0      (6.1)        24.3      (4.9)        25.0     (3.9)        51.1     (7.3)        47.1      (5.9)        48.7     (4.5)
Rhode Island      19.8      (7.8)        20.3      (5.3)        20.1     (4.3)        54.1     (9.8)        49.4      (6.5)        51.2     (5.7)
South Carolina    20.5      (7.8)        18.6      (5.1)        19.4     (4.5)        44.5     (9.2)        49.1      (7.1)        47.3     (5.7)
South Dakota      23.2      (7.4)        29.1      (5.9)        26.6     (4.5)        48.1     (8.6)        47.4      (6.5)        47.7     (5.1)
Tennessee         28.0      (6.9)        23.8      (4.5)        25.5     (3.9)        42.9     (7.4)        48.0      (5.3)        46.0     (4.3)
Texas             30.1      (9.6)        41.5      (6.7)        36.9     (5.5)        51.6    (10.4)        60.3      (6.5)        56.8     (5.9)
Utah              35.7     (11.2)        35.0      (7.4)        35.3     (6.7)        51.9    (11.0)        56.1      (7.6)        54.3     (6.7)
Vermont           33.4      (9.6)        25.5      (6.1)        28.7     (5.3)        62.2     (9.8)        53.5      (7.3)        57.0     (5.9)
Virginia          31.9      (9.6)        35.7      (7.6)        34.2     (6.3)        43.5    (11.2)        47.3      (7.8)        45.8     (6.5)
Washington        31.3      (7.6)        32.6      (6.3)        32.1     (4.9)        55.2     (8.2)        52.0      (6.9)        53.4     (5.3)
West Virginia     30.6      (7.4)        27.1      (4.5)        28.5     (4.1)        48.1     (7.6)        50.9      (5.3)        49.8     (4.5)
Wisconsin         26.7      (9.2)        27.8      (7.3)        27.4     (5.7)        45.2    (10.0)        51.7      (8.0)        49.1     (6.3)

Median            28.7                   27.4                   27.4                  50.6                  50.4                   49.9
Low               13.7                   17.7                   18.5                  27.0                  29.8                   28.7
High              51.7                   41.5                   40.0                  70.6                  64.6                   66.2
----------------------------------------------------------------------------------------------------------------------------------------------------
* Confidence interval.
======================================================================================================================================================
Return to top. Figure_1 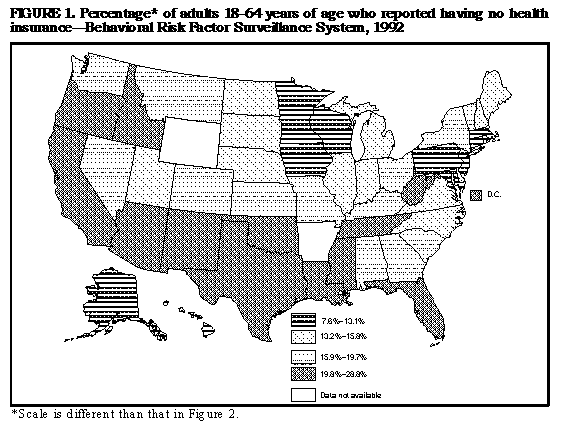 Return to top. Figure_2 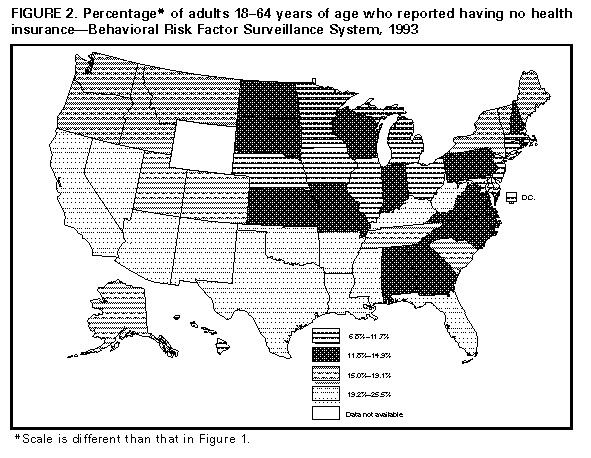 Return to top. Table_A Note: To print large tables and graphs users may have to change their printer settings to landscape and use a small font size. Appendix A: Behavioral Risk Factor Surveillance System State and Territorial Coordinators, 1996 State or Territory Coordinator Telephone Number Alabama Jamey Durham, MPA (334) 613-5300 Alaska Patricia Owen (907) 465-3140 Arizona Brian Bender (602) 542-7335 Arkansas John Senner, PhD (501) 661-2497 California Bonnie Davis, PhD (916) 327-2768 Colorado Marilyn Leff, MSPH (303) 692-2168 Connecticut Mary Adams, MPH (860) 509-7665 Delaware Fred Breukelman (302) 739-4724 District of Columbia Cynthia Mitchell (202) 645-5552 Florida Doris McTague, MS (904) 414-5654 Georgia Ed Pledger, MPA (404) 657-2553 Guam Cynthia Naval 011/671/7357307 Hawaii James Cooper, MA (808) 586-4733 Idaho Christopher Johnson, MPH (208) 334-6571 Illinois Bruce Steiner, MS (217) 785-1064 Indiana Nancy Costello, MPA (317) 383-6571 Iowa Patricia Busick (515) 281-3763 Kansas Michael Perry (913) 296-8918 Kentucky Karen Asher (502) 564-3418 Louisiana Rana Bayakly (504) 568-7210 Maine Dorean Maines (207) 287-5180 Maryland Alyse Weinstein, MA (410) 225-6807 Massachusetts Daniel Brooks, MPH (617) 624-5636 Michigan Harry McGee, MPH (517) 335-9081 Minnesota Nagi Salem, PhD (612) 296-9526 Mississippi Susan Loyd (601) 960-7827 Missouri Jeannette Jackson-Thompson, PhD (573) 876-3283 Montana Patrick Smith (406) 444-2555 Nebraska Sue Huffman (402) 471-3488 Nevada Emil DeJan, MPH (702) 687-4720 New Hampshire Kay Zaso, MPH (603) 271-4549 New Jersey Georgette Boeselager, MS (609) 984-6137 New Mexico Patrice Jaramillo, MPA (505) 827-2963 New York Chris Maylahn, MPH (518) 474-2460 North Carolina Gene Lengerich, VMD (919) 715-3131 North Dakota Jill Kaske, MPH (701) 328-2333 Ohio Robert Indian, MS (614) 466-2144 Oklahoma Neil Hann, MPH (405) 271-5601 Oregon Joyce Grant-Worley, MS (503) 731-4449 Pennsylvania Linda Mann (717) 783-2548 Puerto Rico Ken Barko, MD (787) 274-5654 Rhode Island Jana Hesser, PhD (401) 277-2550 South Carolina James Ferguson, PhD (803) 737-3937 South Dakota Mark Gildemaster (605) 773-6345 Tennessee David Ridings (615) 741-5246 Texas Roger Diamond, MPH (512) 458-7111 Utah Rebecca Giles (801) 538-6120 Vermont Robert McIntyre, PhD (802) 863-7393 Virgin Islands Julia Sheen (809) 773-1311 Virginia Jody Stones (804) 786-3551 Washington Katrina Wynkoop-Simmons, PhD (360) 664-9064 West Virginia Fred King (304) 558-9100 Wisconsin Eleanor Cautley, MS (608) 267-9545 Wyoming Menlo Futa, MA (307) 777-6012 Return to top. Table_B Note: To print large tables and graphs users may have to change their printer settings to landscape and use a small font size.
Appendix B:
States and U.S. Territories Participating in the
Behavioral Risk Factor Surveillance System, 1984-1996
======================================================================================================================
                       1984   1985    1986   1987   1988    1989   1990    1991   1992   1993    1994   1995    1996
--------------------------------------------------------------------------------------------------------------------
Alabama                                S*      S      S       S      S      S       S      S       S      S      S
Alaska                                                               P+     S       S      S       S      S      S
Arizona                  S      S      S       S      S       S      S      S       S      S       S      S      S
Arkansas                                              P                     S              S       S      S      S
California               S      S      S       S      S       S      S      S       S      S       S      S      S
Colorado                                       P                     S      S       S      S       S      S      S
Connecticut                     S                     S       S      S      S       S      S       S      S      S
Delaware                                                             S      S       S      S       S      S      S
District of Columbia            S      S       S      S       S      S      S       S      S       S      S      S
Florida                         S      S       S      S       S      S      S       S      S       S      S      S
Georgia                         S      S       S      S       S      S      S       S      S       S      S      S
Guam                                                                        P                             P      P
Hawaii                   P             S       S      S       S      S      S       S      S       S      S      S
Idaho                    S      S      S       S      S       S      S      S       S      S       S      S      S
Illinois                 S      S      S       S      S       S      S      S       S      S       S      S      S
Indiana                  S      S      S       S      S       S      S      S       S      S       S      S      S
Iowa                                                  S       S      S      S       S      S       S      S      S
Kansas                                                               P              S      S       S      S      S
Kentucky                        S      S       S      S       S      S      S       S      S       S      S      S
Louisiana                                                     P      S      S       S      S       S      S      S
Maine                                  P       S      S       S      S      S       S      S       S      S      S
Maryland                               P       S      S       S      S      S       S      S       S      S      S
Massachusetts                          S       S      S       S      S      S       S      S       S      S      S
Michigan                                       S      S       S      S      S       S      S       S      S      S
Minnesota                S      S      S       S      S       S      S      S       S      S       S      S      S
Mississippi                     P                     P              S      S       S      S       S      S      S
Missouri                        P      S       S      S       S      S      S       S      S       S      S      S
Montana                  S      S      S       S      S       S      S      S       S      S       S      S      S
Nebraska                                       S      S       S      S      S       S      S       S      S      S
Nevada                                                P                     P       S      S       S      S      S
New Hampshire                                  S      S       S      S      S       S      S       S      S      S
New Jersey                                                           P      S       S      S       S      S      S
New Mexico                             S       S      S       S      S      S       S      S       S      S      S
New York                        S      S       S      S       S      S      S       S      S       S      S      S
North Carolina           S      S      S       S      S       S      S      S       S      S       S      S      S
North Dakota             P      S      S       S      S       S      S      S       S      S       S      S      S
Ohio                     S      S      S       S      S       S      S      S       S      S       S      S      S
Oklahoma                                              S       S      S      S       S      S       S      S      S
Oregon                                                P       S      S      S       S      S       S      S      S
Pennsylvania                                                  S      S      S       S      S       S      S      S
Puerto Rico                                                                                               P      P
Rhode Island             S      S      S       S      S       S      S      S       S      S       P      S      S
South Carolina           S      S      S       S      S       S      S      S       S      S       S      S      S
South Dakota             P                     S      S       S      S      S       S      S       S      S      S
Tennessee                S      S      S       S      S       S      S      S       S      S       S      S      S
Texas                    P                     S      S       S      S      S       S      S       S      S      S
Utah                     S      S      S       S      S       S      S      S       S      S       S      S      S
Vermont                                                              S      S       S      S       S      S      S
Virgin Islands                                                P             P                      P      P      P
Virginia                                                      S      S      S       S      S       S      S      S
Washington                                     S      S       S      S      S       S      S       S      S      S
West Virginia            S      S      S       S      S       S      S      S       S      S       S      S      S
Wisconsin                S      S      S       S      S       S      S      S       S      S       S      S      S
Wyoming                                                                     P                      S      S      S

Total P                  4      2       2      1      4       2      3       4      0      0       2      3      3
Total S                 15     22      26     34     37      40     45      48     49     50      50     51     51
Total surveys           19     24      28     35     41      42     48      52     49     50      52     54     54
--------------------------------------------------------------------------------------------------------------------
* Surveillance (monthly surveys conducted throughout the year).
+ Point-in-time survey conducted during one defined period.
======================================================================================================================
Return to top. Disclaimer All MMWR HTML versions of articles are electronic conversions from ASCII text into HTML. This conversion may have resulted in character translation or format errors in the HTML version. Users should not rely on this HTML document, but are referred to the electronic PDF version and/or the original MMWR paper copy for the official text, figures, and tables. An original paper copy of this issue can be obtained from the Superintendent of Documents, U.S. Government Printing Office (GPO), Washington, DC 20402-9371; telephone: (202) 512-1800. Contact GPO for current prices. **Questions or messages regarding errors in formatting should be addressed to mmwrq@cdc.gov.Page converted: 09/19/98 |
|||||||||
This page last reviewed 5/2/01
|