 |
|
|
|
|
|
|
| ||||||||||
|
|
|
|
|
|
|
||||
| ||||||||||
|
|
|
|
|
Persons using assistive technology might not be able to fully access information in this file. For assistance, please send e-mail to: mmwrq@cdc.gov. Type 508 Accommodation and the title of the report in the subject line of e-mail. State- and Sex-Specific Prevalence of Selected Characteristics -- Behavioral Risk Factor Surveillance System, 1996 and 1997Behavioral Risk Factor Surveillance System State Coordinators, March 2000
State- and Sex-Specific Prevalence of Selected Characteristics -- Behavioral Risk Factor Surveillance System, 1996 and 1997Deborah Holtzman, Ph.D. Division of Adult and Community Health Abstract Problem/Condition: High-risk behaviors (e.g., physical inactivity, cigarette smoking, and drinking and driving) and lack of preventive health care (e.g., screening for cancer) are associated with morbidity and mortality from chronic disease and injury. The Behavioral Risk Factor Surveillance System (BRFSS) collects state-specific information to determine the prevalence of such behaviors and preventive practices. By using the BRFSS, states can gain a better understanding of the factors that have a major affect on the health of their adult populations. The BRFSS is also used to monitor progress toward national health objectives. Reporting Period Covered: 1996 and 1997. Description of System: The BRFSS is a state-based telephone survey of the civilian, noninstitutionalized, adult (i.e., persons aged 18 years) population. In both 1996 and 1997, 50 states, the District of Columbia, and the Commonwealth of Puerto Rico participated in the BRFSS. Results: As in previous years, state- and sex-specific variations occurred in the prevalence of high-risk behaviors, awareness of certain medical conditions, use of preventive health services, and health-care coverage. For example, in 1997, the percentage of adults who reported being current cigarette smokers ranged from 13.8% to 30.7% among states (median: 23.2%), and the percentage of adults who reported driving after drinking too much alcohol ranged from 0.6% to 5.3% (median: 1.9%). Binge drinking varied substantially not only by state (range: 6.3%--23.3%; median: 14.5%) but also by sex (men: 22.3%; women: 6.7%). Similarly, the prevalence of overweight varied considerably by sex: 62.2% of men and 44.5% of women were overweight in 1997. Interpretation: The 1996 and 1997 BRFSS data demonstrate that U.S. adults engage in behaviors that are detrimental to their health. The data also demonstrate that many adults are making efforts to prevent chronic disease and injury. The prevalence of certain behaviors and health practices differs between states and between men and women. The reasons for these differences by state and sex are subjects for further analysis, but only through continued surveillance can the areas that need further study be identified. Public Health Actions: Data from the BRFSS are useful in developing and guiding public health programs and policies. For many states, the BRFSS is the only source of state-level data on behaviors and practices related to chronic disease and injury; therefore, BRFSS data are vital for effective decision-making at the local level. States will continue to use these data to help prevent premature morbidity and mortality among their adult population and to assess progress toward national health objectives. INTRODUCTIONCertain behaviors (e.g., physical inactivity, cigarette smoking, and excessive alcohol consumption) contribute substantially to chronic disease and injury morbidity and mortality in the United States. Preventive health practices (e.g., screening for cholesterol, mammography, and proctoscopy) can help identify early stages of chronic diseases (e.g., heart disease, breast cancer, and colorectal cancer), reducing death rates from these leading causes of death among adults. Increasing the use of screening for chronic diseases and reducing high-risk behaviors were among the goals of the year 2000 national health objectives (1). The Behavioral Risk Factor Surveillance System (BRFSS) is an ongoing, state-based surveillance system that collects information monthly about modifiable risk factors for chronic diseases and other leading causes of death. This system is used to measure achievement toward both specific state objectives and the national health objectives (1). This report, the latest in a series that summarizes yearly BRFSS data, presents state- and sex-specific data for 1996 and 1997 concerning a) risk factors for chronic diseases; b) factors that place persons at risk for injury; c) awareness of certain medical conditions that place persons at risk for developing chronic diseases; d) screening practices related to cardiovascular diseases and cancer of the cervix, breast, and colon; e) vaccinations; and f) lack of health-care coverage, which is often a prerequisite for access to clinical preventive health services. The history, rationale, and use of the BRFSS have been previously described (2--5). In 1996 and 1997, all states* participated in the BRFSS. Except for current cigarette smoking among young adults, data collected in 1996 and 1997 are presented separately; statistical comparisons between the 2 years of data were not made. METHODSSamplingEach state health department used random-digit--dialing to select samples of adults in households with telephones. The samples represented each state's civilian, noninstitutionalized, adult (i.e., persons aged >18 years) population. States used three-stage cluster sampling based on the Waksberg method (6), simple random sampling, stratified random sampling, or other sampling designs. QuestionnaireThe 1996 and 1997 BRFSS questionnaire was composed of a) a core set of questions asked in all participating states, b) optional questions about selected topics developed by CDC and asked at the discretion of each state, c) questions developed and asked in a particular state to meet a specific need, d) a rotating set of core questions asked every other year, and e) questions addressing emerging health-care concerns and requiring timely data collection. The rotating core question regarding leisure-time physical activity was asked by all participating states in 1996 only. Rotating core questions asked in 1997 concerned alcohol use, drinking and driving, safety-belt use, awareness of hypertension and high blood cholesterol, testing for blood cholesterol, colorectal cancer screening, and two types of vaccinations. During 1995--1997, the wording of the rotating core question regarding proctoscopic examinations changed. In 1995, respondents were asked, "A proctoscopic exam is when a tube is inserted in the rectum to check for cancer and other health problems. Have you ever had this exam?" In 1997, respondents were asked, "A sigmoidoscopy or proctoscopy is when a tube is inserted in the rectum to view the bowel for signs of cancer and other health problems. Have you ever had this exam?" Because of the different wording of some survey questions, California data on chronic drinking, Papanicolaou (Pap) smears, and mammograms were not comparable with data from other states. Data Collection and ProcessingDuring the interview period in each month, BRFSS data were collected in each state from randomly selected adults. The data were sent to CDC after the monthly interviewing cycle ended. CDC edited and checked the reliability of the data collected. A computer-assisted telephone interviewing (CATI) system, which permits direct entry of data into a computer file during an interview, was used in 48 states in 1996 and in 49 states in 1997. The CATI system helps reduce errors in data collection by facilitating data coding and entry and by enabling interview monitoring. Data Weighting and AnalysisCDC aggregated the edited monthly data files to create a yearly sample for each state. Each state's yearly data file was weighted to both the respondent's probability of selection and the age- and sex-specific or the race-, age-, and sex-specific population from the most current census data (or intercensal estimates) for each state (2,5). By using these weighted data, prevalence estimates of risk behaviors and preventive health practices for each state's population were assessed. SUDAAN, a software package for analyzing complex survey data, was used to calculate 95% confidence intervals around the prevalence estimates (7). In 1996, the number of interviews completed in each state ranged from 1,094 to 4,475 (men: 434--1,956; women: 660--2,558). In 1997, the number of interviews completed ranged from 1,502 to 4,790 (men: 52,196; women: 824--2,855). According to the Council of American Survey Research Organizations (8), state response rates for completed interviews ranged from 54.1% to 94.4% in 1996 and from 62.3% to 92.7% in 1997. RESULTSRisk Factors for Chronic DiseasesOverweight BRFSS participants were asked their height and weight. A body mass index (BMI) of >25.0 kg/m2 is considered overweight (9). To calculate BMI, weight in kilograms is divided by height in meters squared (weight [kg]/[height squared [m2]). In 1996, the prevalence of overweight adults ranged from 42.6% in Colorado to 56.4% in Michigan (median: 52.2%) (Table 1). In 1997, the prevalence of overweight adults ranged from 46.4% in Colorado to 58.2% in Georgia (median: 53.6%). In both years, men were more likely than women to be overweight (1996: 60.7% versus 44.0%; 1997: 62.2% versus 44.5%). No Leisure-Time Physical Activity In 1996, the percentage of adults who did not engage in any leisure-time physical activity (i.e., no exercise, recreation, or physical activities [other than regular job duties]) during the previous month varied threefold among states, from 17.1% in Utah to 51.4% in Georgia (median: 27.8%) (Table 2). The percentage of adults who reported no leisure-time physical activity was lower for men than for women (26.0% versus 30.8%). Cigarette SmokingSmoking Among All Adults The prevalence of adults who reported being current cigarette smokers (i.e., ever smoked >100 cigarettes and currently smoke) varied more than twofold among states (Table 3). In 1996, the prevalence ranged from 14.5% in Puerto Rico to 31.7% in Kentucky (median: 23.4%), and in 1997, the prevalence ranged from 13.8% in Utah to 30.7% in Kentucky (median: 23.2%). The prevalence of smoking was slightly higher for men than for women in both years (1996: 25.5% versus 21.9%; 1997: 25.3% versus 21.1%). Smoking Among Young Adults CDC's Office of Smoking and Health has used smoking prevalence among persons aged 20--24 years as an indicator of smoking initiation in the general U.S. population. Because sample sizes for this narrow age range were likely to be small at the state level, an age range of 18--29 years was used for the BRFSS estimate. The data from states that participated in the BRFSS in both 1996 and 1997 were aggregated to further increase sample size and, consequently, the stability of the estimate. The percentage of young adults who reported having ever smoked >100 cigarettes and being current smokers ranged from 15.9% in Puerto Rico to 35.6% in Ohio (median: 27.3%) (Table 4). The smoking rate was slightly higher for young men than for young women (28.8% versus 26.6%). In most states, the smoking rate for adults aged 18--29 years was higher than that for all adults. High Alcohol ConsumptionDrinking Pattern I In 1997, the percentage of adults who reported binge drinking (i.e., consumption of >5 alcoholic beverages on at least one occasion) during the previous month varied nearly fourfold among states (Table 5). The percentage ranged from 6.3% in Maryland to 23.3% in Wisconsin (median: 14.5%). More than three times as many men as women reported binge drinking (22.3% versus 6.7%). Drinking Pattern II In 1997, the percentage of adults who reported chronic drinking (i.e., consumption of >60 alcoholic beverages) during the previous month ranged from 1.2% in Maryland to 5.1% in Hawaii (median: 3.0%) (Table 6). Men were nearly seven times as likely as women to report chronic drinking (5.4% versus 0.8%). Risk Factors for Personal InjuryDrinking and Driving In 1997, the percentage of adults who reported operating a motor vehicle at least once in the previous month after drinking too much alcohol ranged from 0.6% in Kentucky to 5.3% in Wisconsin (median: 1.9%) (Table 7). More than three times as many men as women reported this behavior (3.0% versus 0.9%). Safety-Belt Use In 1997, the percentage of adults who reported that they always wore a safety belt while driving or riding in a car varied more than twofold among states, from 40.2% in North Dakota to 87.2% in California (median: 69.3%) (Table 8). Men were less likely than women to report always wearing a safety belt (61.9% versus 74.8%). Awareness of Certain Medical ConditionsHypertension In 1997, the percentage of adults who reported ever having been told by a health professional that they had high blood pressure varied from 16.3% in Arizona to 34.4% in Mississippi (median: 23.0%) (Table 9). The percentage of men and women who reported hypertension awareness was about the same (22.3% versus 23.6%). Diabetes In 1996, the percentage of adults who reported ever having been told by a health professional that they had diabetes ranged from 3.0% in Colorado to 10.8% in Puerto Rico (median: 4.5%) (Table 10). In 1997, the percentage ranged from 3.0% in Kansas and Wyoming to 10.5% in Puerto Rico (median: 4.8%). In both years, the difference in diabetes awareness between men and women was minimal (1996: 4.2% versus 4.7%; 1997: 4.9% for both sexes). High Blood Cholesterol In 1997, among the BRFSS participants who reported ever having had their blood cholesterol level tested, the percentage who reported ever having been told by a health professional that they had high blood cholesterol ranged from 18.2% in the District of Columbia to 34.3% in Illinois (median: 28.7%) (Table 11). Awareness of high blood cholesterol was about the same for men and women (27.9% versus 28.8%). Screening for Chronic DiseasesCholesterol In 1997, the percentage of adults who reported ever having had their blood cholesterol tested ranged from 58.4% in Kansas to 81.3% in the District of Columbia (median: 74.0%) (Table 12). The percentage was lower for men than for women (70.8% versus 76.7%). In the same year, the percentage of adults who reported that they had had their blood cholesterol tested within the preceding 5 years varied from 54.9% in Kansas to 79.4% in the District of Columbia (median: 69.1%) (Table 12). Again, the percentage was lower for men than for women (65.9% versus 71.2%). Cervical Cancer In 1996 and 1997, the percentage of women with an intact uterine cervix who had ever had a Pap smear was >90% in all states except Arizona and Puerto Rico (Table 13). The percentage varied from 79.9% in Puerto Rico to 97.0% in Alaska (median: 94.6%) in 1996 and from 81.8% in Puerto Rico to 96.5% in Delaware and Georgia (median: 94.9%) in 1997. In both years, the percentage of women who reported having had a Pap smear in the preceding 3 years was >70% in all states (Table 13). The percentage ranged from 70.2% in Puerto Rico to 92.8% in Alaska (median: 84.5%) in 1996 and from 71.8% in Puerto Rico to 92.3% in Georgia (median: 84.7%) in 1997. Breast Cancer Mammogram. In 1996, the percentage of women aged >40 years who reported ever having had a mammogram varied from 71.8% in Oklahoma to 91.7% in Alaska (median: 84.0%) (Table 14). In 1997, the percentage varied from 74.4% in Oklahoma to 89.3% in Delaware (median: 84.4%). In 1996, the percentage of women aged >50 years who reported that they had had a mammogram in the preceding 2 years ranged from 59.9% in Arkansas to 82.6% in the District of Columbia (median: 70.4%) (Table 14). In 1997, the percentage ranged from 55.9% in Arkansas to 83.6% in the District of Columbia (median: 73.7%). Clinical Breast Examination. In both 1996 and 1997, 91% of women aged >40 years reported ever having had a clinical breast examination (CBE) (Table 15). In 1996, the percentage ranged from 77.6% in Puerto Rico to 96.0% in Montana (median: 90.7%). In 1997, the percentage varied from 81.2% in Arizona to 95.8% in Maryland and Utah (median: 91.1%). In both years, approximately 76% of women aged >50 years reported that they had had a CBE in the preceding 2 years (Table 15). In 1996, the percentage ranged from 64.3% in Iowa to 87.1% in Georgia (median: 75.1%). In 1997, the percentage ranged from 63.4% in Arkansas to 86.4% in New York (median: 77.0%). Mammogram and CBE. In 1996, the percentage of women aged >40 years who had ever had both a mammogram and a CBE ranged from 64.4% in Puerto Rico to 88.0% in Alaska (median: 78.9%) (Table 16). In 1997, the percentage ranged from 67.7% in Arkansas to 86.3% in South Carolina (median: 79.6%). In 1996, the combined use of mammography and CBE in the previous 2 years among women aged >50 years varied from 53.4% in Puerto Rico to 76.6% in the District of Columbia (median: 65.3%) (Table 16). In 1997, the percentage ranged from 48.3% in Arkansas to 76.0% in Maryland (median: 66.4%). Colorectal Cancer Proctoscopic Examination. In 1997, the percentage of adults aged >50 years who reported that they had ever had a sigmoidoscopy or proctoscopy ranged from 22.3% in Oklahoma to 51.6% in Hawaii (median: 40.8%) (Table 17). The rate was higher for men than for women (45.3% verus 37.7%). In 1997, the percentage of adults aged >50 years who reported having had a sigmoidoscopy or proctoscopy in the preceding 5 years ranged from 15.6% in Oklahoma to 41.5% in the District of Columbia (median: 30.0%) (Table 17). Again, the rate was higher for men than for women (34.8% versus 25.8%). The prevalence of screening was substantially lower when respondents were asked whether they had had either procedure within the preceding 2 years (median: 20.7%). Fecal Occult Blood Test. In 1997, the percentage of adults aged >50 years who reported having had a fecal occult blood test in the preceding year ranged from 9.2% in Mississippi to 28.4% in Maine (median: 18.0%) (Table 18). Men were slightly less likely than women to report having had the test (16.8% versus 19.5%). Vaccination Pneumococcal Vaccination In 1997, the percentage of adults aged >65 years who reported that they had ever had a pneumococcal vaccination ranged from 32.2% in Louisiana to 59.4% in Arizona (median: 45.8%) (Table 19). The percentage was slightly lower for men than for women (44.3% versus 46.9%). Influenza Vaccination In 1997, the percentage of adults aged >65 years who reported that they had had an influenza vaccination in the preceding year ranged from 41.5% in Puerto Rico to 74.4% in Colorado (median: 65.9%) (Table 19). The prevalence was slightly higher for men than for women (67.9% versus 65.5%). Access to Health Care Lack of Health-Care Coverage In 1996, the percentage of adults aged 18--64 years who reported that they did not have any health-care coverage varied 3.5-fold. The percentage ranged from 8.0% in Minnesota to 28.3% in Texas (median: 15.2%). In 1997, the percentage who reported that they lacked health-care coverage varied nearly fourfold, from 7.4% in Hawaii to 28.2% in Texas (median: 14.3%) (Figure 1). The greatest prevalence of uninsured persons aged 18--64 years was in the southern and southwestern states. Men were slightly more likely than women to report having had no health insurance (15.2% versus 13.5% in 1997). Cost as a Barrier to Obtaining Health Care The percentage of adults aged 18--64 years who reported at least one time in the preceding year when they could not visit a physician because of the cost varied more than twofold in 1996, from 7.6% in Wisconsin to 16.7% in Texas (median: 12.6%). In 1997, the percentage varied 3.6-fold, from 7.3% in Wisconsin to 26.1% in Arizona (median: 11.2%) (Figure 2). In contrast to health-care coverage, men were less likely than women to report cost as a barrier to obtaining health care (9.1% versus 13.4% in 1997). DISCUSSIONThe BRFSS data in this report demonstrate substantial variation in the prevalence of many health-risk behaviors and preventive health practices among U.S. adults. For example, in 1997, 3% of adults reported engaging in chronic drinking, but 23% reported cigarette smoking. In 1997, 74% of women aged >50 years reported having had a mammogram in the preceding 2 years, whereas only 17% of women in this age group reported having had a sigmoidoscopy or proctoscopy in the preceding 2 years. Variations among states in health-risk behaviors and preventive practices were also substantial, notably for leisure-time physical activity, binge drinking, safety-belt use, influenza vaccination, and health-care coverage. Sex differences were particularly evident for overweight, alcohol-related behaviors, and safety-belt use. The definition of overweight has recently changed from BMI >27.8 kg/m2 for men and >27.3 kg/m2 for women (these values approximate the sex-specific 85th percentile of BMI estimated from the second National Health and Nutrition Examination Survey for persons aged 2029 years in the United States) to BMI >25.0 kg/m2 for both men and women (9). The current definition conforms to World Health Organization guidelines (10). Using the current definition, in 1996 and 1997, approximately 53% of adults in the United States were overweight. If the current criterion were applied to the 1995 BRFSS data, 52% of adults would have been considered overweight in that year. In 1996 and 1997, the prevalence of overweight tended to be highest in the mid-Atlantic and midwestern states, and men were more likely than women to be overweight. Overweight might be underreported, especially among women (11); however, the data indicate that overweight is a substantial problem among U.S. adults. Both overweight and lack of physical activity increase the risk for chronic health problems, including high blood pressure, diabetes, heart disease, and some cancers (12--14). In 1996, the prevalence of no leisure-time physical activity varied threefold among states; the prevalence tended to be highest in southeastern states and lowest in western states. The prevalence of no leisure-time physical activity --- approximately 25% --- has been nearly constant since 1990. Estimates of leisure-time physical activity do not account for work-related physical activity; thus, the BRFSS data likely underestimate the total amount of physical activity engaged in by the adult population (15). Tobacco use, particularly cigarette smoking, is a major cause of morbidity and mortality in the United States (16). In 1996, cigarette smoking became the first health behavior to be added to the list of nationally notifiable conditions reported to CDC (17). The prevalence of cigarette smoking among adults, approximately 25%, has been slightly consistent since 1991 (4,18,19). In most states, the percentage of young adults who smoked during 1996--1997 (aggregated data) was higher than the percentage of all adults who smoked in 1996 or 1997. In both groups of adults, the prevalence varied twofold among states, and the differences between men and women were small. The BRFSS findings suggest that for states that had a smoking rate substantially higher than the median (e.g., Kentucky, Missouri, and Nevada), tobacco-control efforts are particularly important. The data also suggest that such efforts be directed to young adults, whose smoking rate was higher than that of all adults in most states. Alcohol abuse can lead to serious health consequences. The leading cause of liver-related mortality in the United States, alcohol abuse, is also associated with hypertension, heart disease, and stroke (20). Furthermore, drinking and driving can result in personal injury and in injury to others through motor-vehicle accidents. In 1997, the prevalence of binge drinking and chronic drinking varied widely among states and especially by sex. Adults were more likely to report binge drinking (median: 14.5%) than chronic drinking (median: 3.0%) or drinking and driving (median: 1.9%). All three behaviors were substantially more prevalent among men than women. The prevalence of safety-belt use varied more than twofold among states. States with the highest rates of safety-belt use all had laws for primary enforcement, whereby a motor-vehicle operator might be stopped by a law enforcement officer for an observed violation of safety-belt--use laws. Such primary enforcement laws are associated with greater and more rapid increases in safety-belt use than secondary enforcement laws, which require a vehicle to be stopped first for some other violation (21). The BRFSS data on awareness of certain medical conditions (i.e., hypertension, diabetes, and high blood cholesterol) provide estimates only of the percentages of adults who know that they have these conditions; the data do not necessarily reflect the number of adults who are being treated for these conditions. Moreover, the percentage of adults who actually have hypertension, diabetes, or high blood cholesterol is likely higher because, in many cases, the respondents are unaware of their health status regarding these health conditions (22). In 1999, an estimated 13,000 cases of invasive cervical cancer were diagnosed in U.S. women, and an estimated 5,000 women died from the disease in that year (23). Early detection of cervical dysplasia can help reduce mortality from cervical cancer through early treatment. In 1996 and 1997, the screening rate for cervical cancer was high among the general U.S. population of women. In all states except Arizona and Puerto Rico, >90% of women with an intact uterine cervix reported having ever been screened for cervical cancer with a Pap smear. At least 78% of women in all states except Puerto Rico reported having had a Pap smear in the preceding 3 years. Breast cancer is an important cause of morbidity and mortality among U.S. women. In 1999, an estimated 180,000 cases of breast cancer were diagnosed, and approximately 43,000 women died from the disease (23). As with cervical cancer, early detection of breast cancer can lead to early treatment of the disease and, consequently, reduced mortality. The rates of various breast cancer screening procedures were high in 1996 and 1997. Of women aged >40 years, 84% reported ever having had a mammogram; 91% reported ever having had a CBE; and 79% reported ever having had both screening procedures. Among women aged >50 years, 72% reported having had a mammogram in the preceding 2 years; 76% reported having had a CBE in the preceding 2 years; and 66% reported having had both screening procedures in the preceding 2 years. In contrast, the prevalence of colorectal cancer screening procedures was low, even though colorectal cancer causes 10% of cancer-related deaths in the United States (24). Of adults aged >50 years, 41% reported they had ever had a sigmoidoscopy or proctoscopy. The American Cancer Society recommends that adults aged >50 years have the procedure every 5 years (25), but only 30% reported having had the procedure in the preceding 5 years, and 21% reported having had it in the preceding 2 years. Of adults aged >50 years, 18% reported having had a fecal occult blood test in the preceding year. Men were more likely than women to report having had a sigmoidoscopy or proctoscopy, and women were slightly more likely than men to report having had the fecal occult blood test (26). Among older adults (i.e., persons aged >65 years) in the United States, pneumonia and influenza are important causes of death. In 1996, these infections were responsible for 75,000 deaths among persons in this age group (27). Of adults aged >65 years, 46% reported that they had ever been vaccinated for pneumonia, and 66% reported that they had been vaccinated for influenza in the preceding year. The year 2000 national health objective established for both pneumococcal and influenza vaccinations stated that >60% of persons at high risk for complications be vaccinated, including persons aged >65 years (objective 20.11) (28). Although some states met the objective for influenza vaccination, none met the objective established for pneumococcal vaccination. A lack of health insurance and cost concerns are barriers to seeking medical treatment and obtaining preventive health services (29,30). Furthermore, persons without health-care coverage are more likely than those who are insured to be in poor health and at increased risk for chronic disease (31). In 1997, 14% of adults aged 64 years reported that they did not have health-care coverage, and 11% reported that cost was a barrier to obtaining health care. Men were slightly more likely than women to report not having health-care coverage, and women were more likely than men to report not being able to afford health care. The validity of data from the BRFSS has been assessed, in part, through comparisons with data from similar surveys (32--37). For example, estimates of the prevalence of cigarette smoking from the BRFSS have been compared with those from the 1985, 1989, and 1992--1993 Current Population Surveys (CPS) (37). For most states in each period, the estimates of smoking prevalence were similar in the BRFSS and the CPS. Estimates from the BRFSS might differ from those derived from other surveys (e.g., the National Health Interview Survey or the National Health and Nutrition Examination Survey), however, because of differences in methodology, wording of questions, or survey periods. A summary of research on the validity and reliability of BRFSS data has been prepared (CDC, unpublished data, 2000). Policymakers use state-specific BRFSS data to address health problems in each state, develop state-specific health plans, and evaluate progress toward state health objectives. Reports on BRFSS data for 1984 through 1995 (5,18,19,38--42) and this CDC Surveillance Summary have demonstrated that the prevalence of many health-risk behaviors and the use of clinical preventive services vary substantially among states. The variations might be attributable to differences in population composition (e.g., age, race, ethnicity, and sex) (43), socioeconomic factors (e.g., per capita income, median number of years of education, and unemployment levels), different state laws enacted to discourage risky behaviors (e.g., driving under the influence of alcohol), different levels of efforts to screen for certain diseases and health conditions, and other factors. The BRFSS can provide the basis for developing or evaluating public health programs or policies designed to reduce the prevalence of health-risk factors at the national level as well. BRFSS data were frequently used to evaluate progress toward national year 2000 health objectives and to support national health campaigns and programs. References
* In this report, the term "states" includes the District of Columbia and the Commonwealth of Puerto Rico. Table 1   Return to top. Figure 1 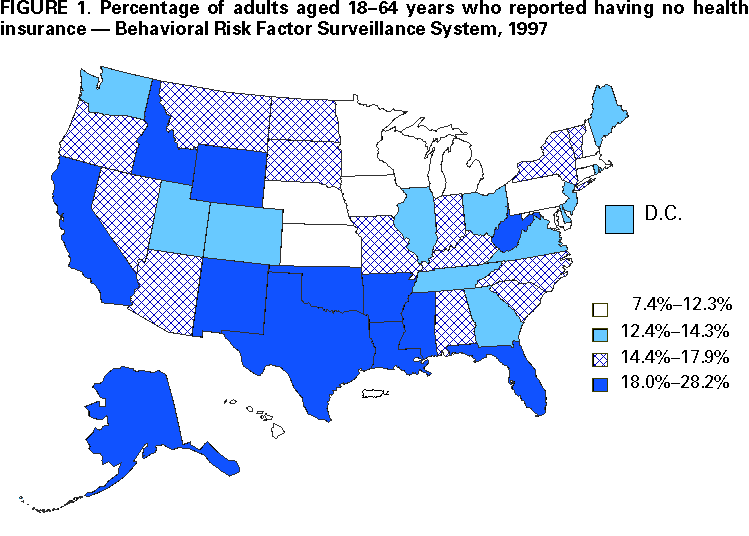 Return to top. Table 2  Return to top. Figure 2 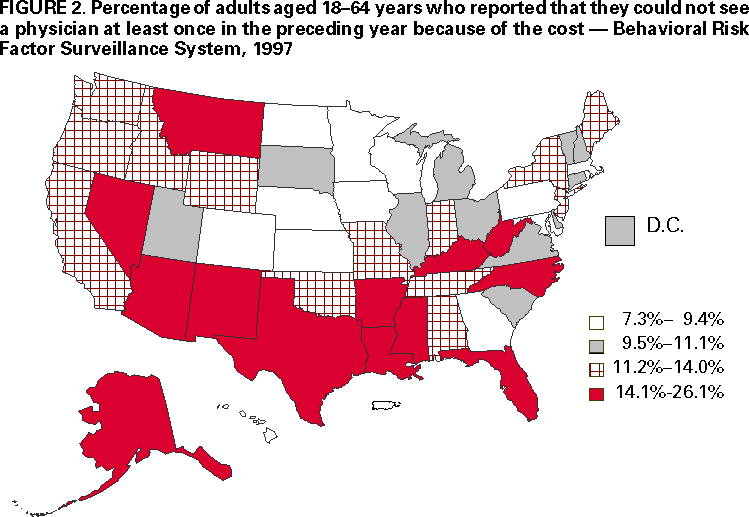 Return to top. Table 3   Return to top. Table 4  Return to top. Table 5  Return to top. Table 6  Return to top. Table 7  Return to top. Table 8  Return to top. Table 9  Return to top. Table 10   Return to top. Table 11  Return to top. Table 12   Return to top. Table 13  Return to top. Table 14  Return to top. Table 15  Return to top. Table 16  Return to top. Table 17   Return to top. Table 18  Return to top. Table 19   Return to top. Disclaimer All MMWR HTML versions of articles are electronic conversions from ASCII text into HTML. This conversion may have resulted in character translation or format errors in the HTML version. Users should not rely on this HTML document, but are referred to the electronic PDF version and/or the original MMWR paper copy for the official text, figures, and tables. An original paper copy of this issue can be obtained from the Superintendent of Documents, U.S. Government Printing Office (GPO), Washington, DC 20402-9371; telephone: (202) 512-1800. Contact GPO for current prices. **Questions or messages regarding errors in formatting should be addressed to mmwrq@cdc.gov.Page converted: 7/3/2000 |
||||||||||||||||||||||||||||||||||||||||||||||||||||||||||||||||||||||||||||||||||||||||||||||||||||||||||||||||
This page last reviewed 5/2/01
|