 |
|
|
|
|
|
|
| ||||||||||
|
|
|
|
|
|
|
||||
| ||||||||||
|
|
|
|
|
Persons using assistive technology might not be able to fully access information in this file. For assistance, please send e-mail to: mmwrq@cdc.gov. Type 508 Accommodation and the title of the report in the subject line of e-mail. Algorithm for Statistical Detection of Peaks --- Syndromic Surveillance System for the Athens 2004 Olympic GamesUrania G. Dafni,1,2 S.
Tsiodras,1,2 D.
Panagiotakos,1 K. Gkolfinopoulou,1,2 G. Kouvatseas,1 Z. Tsourti,1 G. Saroglou2
Corresponding author: Urania G. Dafni, Division of Public Health, Department of Nursing, University of Athens, 123 Papadiamantopoulou St., Athens 11527, Greece. Telephone: 30-210-746-1456; Fax: 30-210-746-1489; E-mail: dafni@cc.uoa.gr. AbstractIntroduction: No generally accepted procedure exists for detecting outbreaks in syndromic time series used in the surveillance of natural epidemics or biologic attacks. Objectives: This report evaluates the usefulness for syndromic surveillance of the Pulsar approach, which is based on removing long-term trends from an observed series and identifying peaks in the residual series of surveillance data with cutoffs determined by using a combination of peak height and width. Methods: Simulations were performed to evaluate the Pulsar method and compare it with other approaches. The daily syndromic counts in emergency departments of four major hospitals in the Athens area during August 2002--August 2003 were analyzed for two common syndromes. A standardized residual series was generated by omitting trends and noise in the original data series; this series was examined for the presence of peaks (i.e., points having magnitude higher than at least one of three probabilistically determined cutoffs). The whole process was iterated, and the baseline was recalculated by assigning reduced weight to the identified peaks. Results: For the specific simulation schema used, the Pulsar method fared well when compared with other approaches in meeting the performance criteria of sensitivity, specificity, and timeliness. Conclusions: Although the suggested algorithm needs further validation regarding the correspondence between detected peaks and true biologic alerts, the Pulsar technique appears effective for observing peaks in time series of syndromic events. The simplicity of the algorithm, its ability to detect peaks based not only on height but also on width, and its performance in the simulated data sets make it a promising candidate for further use in syndromic surveillance. IntroductionSyndromic time series are used in surveillance of natural epidemics or biologic attacks. CDC and the New York City Department of Health and Mental Hygiene used syndromic surveillance systems for detection of biologic terrorism after the September 2001 terrorist attacks (1--3). Almost simultaneously, other systems emerged (4), including those developed by the Boston Department of Health (5) and the University of Pittsburgh (4,6), CDC's drop-in surveillance systems (7), the Electronic Surveillance System for the Early Notification of Community-Based Epidemics (ESSENCE) (8,9), and others (10--12). The Athens 2004 Olympic Games (August 13--29, 2004) have made critical the need for a real-time surveillance system that can alert public health officials to unexpected communicable-disease outbreaks and likely clinical presentations of a biologic terrorist attack, as has been used for other major athletic events (13--17). Therefore, in July 2002, a drop-in syndromic surveillance system was established in Greece similar to that used during the Salt Lake 2002 Olympic Winter Games (13,18). Different outbreak-detection algorithms are used in operating syndromic surveillance systems (2,19--23). Ideally, all alert mechanisms generate an alert whenever the number of observed events exceeds the expected number of events while minimizing the frequency of false alerts. However, no generally accepted procedure exists for outbreak detection in syndromic surveillance (24). This paper proposes an algorithm for statistical detection of peaks. The method is based on removing long-term trends from the series of observations and identifying peaks in the residual series of data. This approach was developed for studying episodic hormonal secretion and has been used for other applications (25--27). An important feature of the proposed algorithm is that it generates alerts, taking into consideration both height and breadth of signals. The proposed method was applied in the Athens Olympic syndromic surveillance system database (18) and was compared through simulations with other methods currently applied in syndromic data series (19--23,28). MethodsData AcquisitionDrop-in syndromic surveillance in emergency departments (EDs) of major hospitals was first established in Greece by the Hellenic Center for Infectious Diseases Control in July 2002. The project's primary aims were to assess system feasibility and data-collection timeliness, establish a 2-year background database, and enhance collaboration with and sensitization of ED personnel of major hospitals (18). During August 2002--August 2003, the syndromic surveillance system operated in eight hospitals and one major health-care center in the greater Athens area. Surveillance was conducted for the following 10 syndromes: 1) respiratory infection with fever; 2) bloody diarrhea; 3) gastroenteritis (diarrhea, vomit) without blood; 4) febrile illness with rash; 5) meningitis, encephalitis, or unexplained acute encephalopathy/delirium; 6) suspected acute viral hepatitis; 7) botulism-like syndrome; 8) lymphadenitis with fever; 9) sepsis or unexplained shock; and 10) unexplained death with history of fever. These syndrome categories were used by the Salt Lake City Department of Health for syndromic surveillance during the 2002 winter Olympics (13). Trained personnel visited EDs and identified syndromic cases from chief complaints as recorded in ED visit books. All syndromes identified daily in the ED were recorded, as were the total number of visits. Data were entered into a database, and data management and analysis were performed centrally. In the work presented here, the time series for the two most commonly encountered syndromes (respiratory infection with fever and gastroenteritis [diarrhea, vomit] without blood) are used. Algorithm DescriptionThe Pulsar method is based on identifying peaks in the syndromic time series that exceed a specified threshold. Long-term changes are first screened out, and then peaks are identified in the screened series. This approach has been previously suggested for studying episodic hormonal secretion (25). First, a baseline is defined for the original syndromic series by using the locally weighted smoothing scatterplots method (LOWESS) (29), in which a fixed proportion of observations (the smoothing parameter) is used, and a baseline value is calculated from the observations closest in time to the point. Weights are assigned to the observations, depending on their distance from the point. The fraction of observations in the window is selected so that the window's average width minimizes the bias-corrected Akaike's information criterion (AIC), which incorporates both the tightness of the fit and the model complexity. This criterion often selects better models than AIC in small samples (30). Then, a weighted nonparametric regression of syndromic counts versus time within the window provides the initial baseline value estimate for that time point. After the initial estimation of baseline values, new weights giving less influence to observations far from the corresponding baseline values are assigned, and the weighted regression is repeated. This procedure produces baseline estimates that are not influenced by extreme outlier observations. A residual series, containing short-term variations but not trends, is obtained by subtracting the smoothed data from the original counts and is standardized by dividing the residuals by an estimate of the noise level, to yield a scaled residual series, expressed in signal-to-noise units. The peaks in the standardized residual series are identified on the basis of a combination of height and width, with no assumption for the shape of the peak. To be classified as a peak, an elevation should either be substantially high, even if it is narrow, or span multiple points in width, even if it is moderately high. For a point in the signal-to-noise series to be considered part of a peak, it should exceed a certain cutoff value G(1); or it should exceed a lower cut-off value G(2) along with one adjacent point; or it should exceed an even lower cut-off value G(3) along with two adjacent points; and so forth. The specific choices of n and G(n)s depend on the time series used for calibration purposes, the relative choice between higher but narrow peaks as opposed to lower but broad ones, and the desired false-alert rate. After the initial identification of peaks, the baseline is recalculated. Reduced weight is assigned to observations previously identified as part of a peak. Iterations of the whole process are performed until the same assignment of points to peaks is achieved. Algorithm CustomizationIn the 13-month syndromic series, LOWESS smoothing was applied with optimal smoothing parameter equal to 15% for respiratory infection with fever and 52% for gastroenteritis (diarrhea, vomit) without blood. Alternative estimates were used for the standardization, including the standard deviation and the mean absolute deviation in the original series, as well as the 7-day moving standard deviation and the 7-day mean absolute deviation in the simulated series. The latter were based either on the seven most recent observations to the current time point or on the tenth to fourth most recent observations (i.e., not taking into account the three most recent ones). The procedure is performed iteratively to weigh down extreme values and detect outliers appearing in clusters. In this data set, extreme clustered observations do not appear to exist, and two iterations were sufficient to obtain a smoothed series (the resulting detected peaks of the two iterations differ by <2.5%). G(1), G(2), and G(3) cutoffs were chosen under the assumption of normality for the standardized residual series to derive 97% specificity in the whole series and take into account the effect of multiple testing on the significance level. The threshold is given by G(n) = probit(1-α*[n/6]/d) where d = number of days that a false alert occurs with probability a = 0.10 and n = 1 or 2 or 3, whereas the factor n/6 provides the necessary adjustment for multiple testing (25). Alternative MethodsThe Pulsar approach was evaluated by comparison through simulations with other commonly used syndromic surveillance methods (19--23,28). All parameters for each model used in the comparisons were set so that the specificity (true nonalerts/nonoutbreaks) in the original time series was fixed at 97%, assuming no outbreak condition (20,21). For each method, the day of an outbreak on which an alert was first generated was recorded. Sensitivity (true alerts/outbreaks) across all simulated series for each syndrome and the timeliness for each method (i.e., the percentage of the first alert per day of outbreak) were compared among the alternative approaches. The three performance criteria (sensitivity, specificity, and timeliness) were reported and compared through the Wilcoxon signed rank or Friedman nonparametric tests. Bonferroni-adjusted α* are reported. The methods mentioned here have been used in syndromic surveillance and were evaluated in this syndromic data series. The temporal aberration detection (TAD) approach used by the Early Aberration Reporting System (EARS), a program provided by CDC to all interested health departments, uses cumulative sum (CUSUM) methods from th,e quality-control literature. CUSUM compares the proportion of syndrome counts to total visits on each of the most recent 3 days to the mean proportion plus 1 standard deviation, during a 7-day moving baseline. CUSUM of positive differences is calculated based on a 3-day interval, and an alert is considered to occur if it exceeds 2 standard deviations (2,22,23). Time-series methods (e.g., autoregressive integrated moving average [ARIMA] time-series models) were proposed for describing 10-year syndromic data from a major Boston-area hospital (20,21). Different filters were evaluated in data sets with simulated outbreaks, using a fixed specificity rate of 97%. The linear 7-day filter proved superior in simulations (20). Standard one-sided CUSUM methods have also been proposed for detecting outbreaks in surveillance data (19,28). Simulation SchemaFor evaluation of the performance of the proposed methodology, 100 simulated series were created. The original time series of counts is considered to include no outbreaks. A scenario involving a terrorist attack depends on the biologic agent, quality, and quantity released; the method of dispersion; and population characteristics. A 4-day outbreak was chosen to represent a probable period between symptom presentation and diagnosis (i.e., the window of opportunity for possible earlier detection because of syndromic surveillance) (31). However, different durations of that window are also possible. Each simulated time series was produced by randomly injecting 4-day--long outbreaks to the original time series of daily counts for each syndrome of interest with probability of 15% per day (leading to 18.5 4-day outbreaks on average among simulated series). An outbreak led to duplication of the observed counts of the syndrome for that day (respiratory infection: median size = 27; 5th and 95th percentiles: 24, 29 and gastroenteritis: median size = 15; 5th and 95th percentiles: 14, 16). Two adjacent outbreaks were forced to be >15 days apart to ensure that a previous outbreak did not adversely affect the alert-detection mechanism of the next (20). The detection algorithms should detect an outbreak as if it is the first one that occurs in the original time series. An outbreak was considered successfully detected if an alert was generated on >1 day of the outbreak. Alternative patterns of outbreaks were also examined, including 1) constant increase for all 4 days, equal to the median counts of the syndrome (23.5 for respiratory infection with fever and 15.5 for gastroenteritis) or 2) constant increase for all 4 days, equal to the 75th percentile of the counts of the syndrome (35 for respiratory infection with fever and 22 for gastroenteritis); 3) linear increase for the 4 days: (increase of one median/day); 4) exponential increase for the 4 days: increase of 1, 1.5, 2.5, and 4 medians for day 1--4, respectively; or 5) exponential increase for the first 3 days (1, 1.5, 2.5 medians) and subsequent decrease on day 4. All statistical computations were performed by using SAS® software, version 8.2 (32). ResultsThe original 13-month time series for four major hospitals in metropolitan Athens sharing the same catchment area for the respiratory infection with fever and gastroenteritis (diarrhea, vomit) without blood syndromes were used to illustrate and evaluate the proposed method. A total of 305,039 ED visits (mean: 770/day) were recorded during August 2002--August 2003 in these hospitals. The corresponding mean total syndrome counts were 26 and 15 per day for each syndrome, respectively. The six different standardization estimates already described for the Pulsar algorithm, leading to different threshold specifications, were compared. The best approach for both syndromes with respect to the achieved sensitivity was the one that used the standard deviation in the original series (Table 1; see Model 1). The corresponding parameter d to the G(1), G(2), and G(3) thresholds was 0.5 and 1 for respiratory infection with fever and gastroenteritis (diarrhea, vomit) without blood syndromic series, respectively, whereas a was set equal to 0.10 for both syndromes. The standardized residuals from the original time series and from a sample simulated series (number 10) for each syndrome along with the thresholds are illustrated (Figure 1). The TAD approach was used both on the count series and on the proportion of counts of syndromes to total ED visits (2,22,23). The results for the count series were superior to those for the proportion series. The fixed specificity of 97% in the original time series of counts, for both syndromes, was reached by using 3 standard deviations for the alert mechanism (Model 1) instead of the 2 used in EARS (Model 2) (2,22,23) (Table 2). ARIMA models were used for describing the 13-month original series of syndromic data (20,21). For respiratory infection with fever, the autoregressive (AR) order, the moving average (MA) order, and the integration (I) order were all equal to 4 days. Weekend was also statistically significant and used as an explanatory variable in the model. For gastroenteritis (diarrhea, vomit) without blood, AR = 4 days, MA = 2 days, and I = 4 days. The filters evaluated were seventh-order MA (Model 1), seventh-order linear average (Model 2), and seventh-order exponential average (Model 3). The threshold was again set so that specificity of 97% was achieved in the original time series, and the best filter regarding sensitivity was the seventh-order MA filter (Model 1). The corresponding thresholds are equal to probit(1-α/7) and probit(1-α/8) for each syndrome, respectively, with α equal to 0.10. For the one-sided CUSUM method used here, a 7-day moving average and standard deviation used for standardization proved superior to the standard approach (19,28). The cumulative sum was calculated by St = max{0,(S(t-1)+zt-k)}, where k = 0.5. The specified threshold h was set so that specificity 97% was achieved in the original time series, and the corresponding values for the two syndromes were set to 3.5 and 2.75, respectively (Model 1). A second approach employing values from the literature that actually minimize the average run length (ARL) of the process was also used (k = 0.5 and h = 2.5) (19) (Table 2). The sensitivity and specificity of the alternative methods (TAD, the time-series approach, and CUSUM) were compared (Table 2). Performance criteria for the best models with respect to sensitivity for each approach, among the ones using a set specificity of 97% in the original time series, are directly compared (Figures 2 and 3). Box-plots of the model's sensitivity and specificity (Figure 2) and timeliness (Figure 3) are presented. The Pulsar approach fared well in comparison with the other methods for each evaluation criterion. In particular, mean sensitivity was statistically significantly higher (Bonferroni α* = 0.0056) for the Pulsar approach when compared with the other approaches for both syndromes (Wilcoxon signed rank, p<0.001 for all comparisons). Furthermore, mean specificity for the Pulsar method was significantly higher (Bonferroni α* = 0.0056) than the specificity of the one-sided CUSUM method (Wilcoxon signed rank, p<0.001). This finding holds for both syndromes examined. In addition, in the case of respiratory infection with fever, the specificity of Pulsar was significantly higher than the specificity of TAD (Wilcoxon signed rank, p<0.001), whereas in the case of gastroenteritis, the specificity of Pulsar was higher than the specificity of the ARIMA approach (Wilcoxon signed rank, p<0.001). No other significant differences regarding specificity between the Pulsar method and the others were identified for either syndrome. Timeliness for the first day (proportion of alerts at the first day of an outbreak) differed significantly among the four approaches (Friedman test, p<0.001) for both syndromes. Timeliness of the Pulsar method was lower than the timeliness of the ARIMA model (Wilcoxon signed rank, p<0.001; Bonferroni α* = 0.0056). However, for respiratory infection with fever, Pulsar's timeliness was higher than TAD and CUSUM (p<0.001), and for gastroenteritis, Pulsar's timeliness was higher than TAD's (p<0.001). Results were similar when the mentioned alternative patterns of outbreaks were used. DiscussionThis paper proposes an algorithm for outbreak detection in the context of syndromic surveillance time-series data, based on alert criteria for both height and breadth of signals (25). The performance of the Pulsar approach and other suggested methods for outbreak detection (19--23,28) were assessed through simulations on the basis of direct comparison of sensitivity, specificity, and timeliness. For these performance criteria, Pulsar appears to be at least as effective as the other methods. The Pulsar approach, first suggested for studying of episodic hormonal secretion, was successfully used in the context of syndromic surveillance data. Syndromic data are expressed initially in signal-to-noise units; then, through an iterative process, peaks are identified. Point elevations that are substantially high or elevations only moderately high but spanning multiple points in width are identified as peaks. The thresholds for peak detection are determined probabilistically on the assumption of normally distributed residuals. The idea of stochastically determining the thresholds is extended to the other methods under comparison. The thresholds are chosen so that a specificity of 97% is achieved in the original syndromic time series (20,21). In the simulated data sets, the 97% specificity was most closely reproduced when using the Pulsar method as compared with the other methods (Tables 1 and 2). Sensitivity for the chosen Pulsar model (Model 1) for respiratory infection with fever ranged from 67% to 100%, with a mean of 85%, whereas sensitivity for gastroenteritis (diarrhea, vomit) without blood ranged from 62.5% to 100%, with a mean of 81%. The mean sensitivity for the Pulsar approach was higher than the sensitivity for the other methods. This method compared well with the others as far as specificity. All methods held specificity close to the 97% benchmark, with the exception of the one-sided CUSUM. In all methods evaluated, the higher percentage of alerts was generated on the first day of the outbreak with the exception of the TAD model, for which alerts occurred with similar frequency on the first 3 days of the outbreak. The ARIMA model exhibited the best timeliness results, followed by the Pulsar approach. Of note, the performance evaluation criteria led to uniformly worse results for all methods when applied to the daily proportion of syndrome counts to total visits as opposed to syndrome counts. Methods adapted to proportion are under investigation and could be evaluated simultaneously. In addition, a specific simulation schema was used to compare methods, with varying outbreak sizes of fixed duration affecting the generalization of the comparison under other simulation settings. However, the critical comparison is always the one based on the detection performance of real outbreaks (33). Finally, this analysis did not consider other methods that have been proposed for analysis of syndromic data (34,35), including spatial statistical methods (e.g., spatial scan statistic, Bayesian approaches, and multivariate methods) (36--40). ConclusionThe performance results of the Pulsar method are overall comparable with the other methods examined for the specific simulation schema used. The simplicity of the algorithm, its ability to be modified regarding choice of standardization and distributional assumptions for the signal-to-noise ratio, and its ability to detect peaks based not only on height but also on width (which more closely addresses the epidemic shapes that one would expect to last for >1 day) make it a promising candidate for further use in syndromic surveillance. The abrupt increase in population anticipated for the Athens 2004 Olympic Games will provide an ideal prospective surveillance setting for comparing the behavior of all proposed methods regarding alert mechanisms. AcknowledgmentsThe authors thank the members of the syndromic surveillance team, Dimitris Papamihail, Aggeliki Lambrou, and Ioannis Karagiannis, as well as the >50 health professionals who made every effort to gather quality data from the EDs. References
Table 1 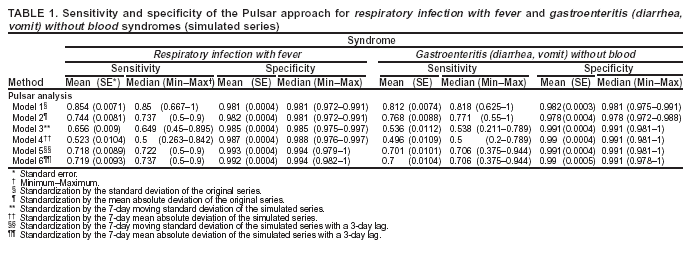 Return to top. Figure 1 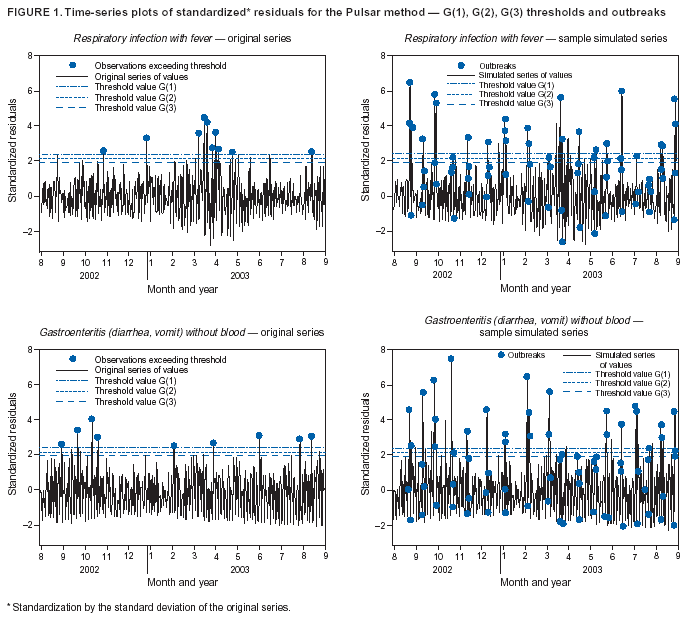 Return to top. Table 2 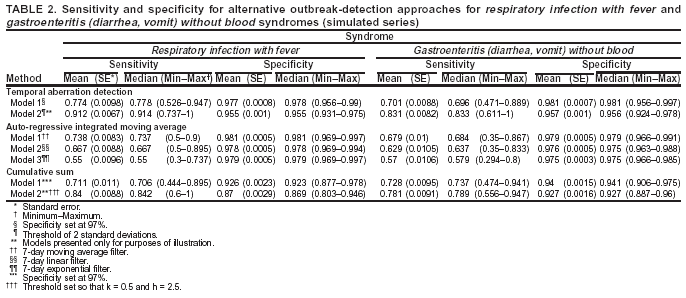 Return to top. Figure 2 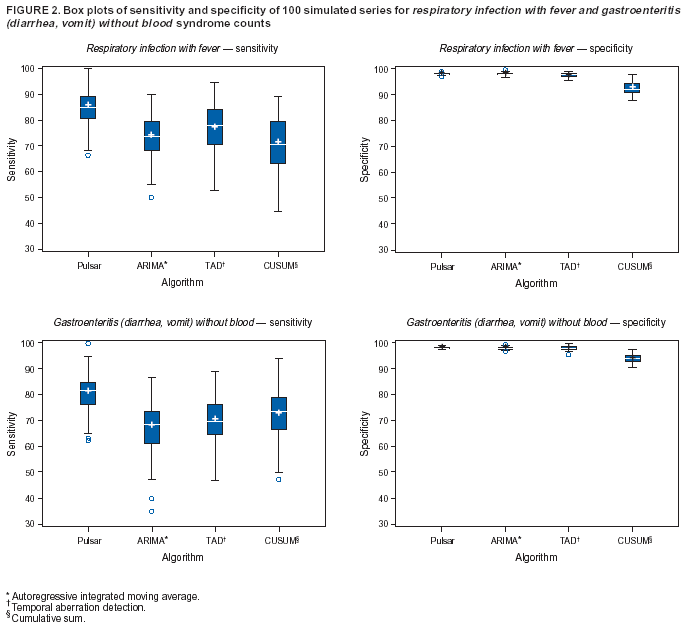 Return to top. Figure 3 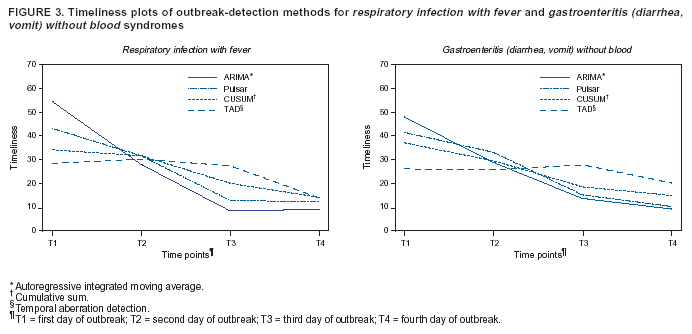 Return to top.
Disclaimer All MMWR HTML versions of articles are electronic conversions from ASCII text into HTML. This conversion may have resulted in character translation or format errors in the HTML version. Users should not rely on this HTML document, but are referred to the electronic PDF version and/or the original MMWR paper copy for the official text, figures, and tables. An original paper copy of this issue can be obtained from the Superintendent of Documents, U.S. Government Printing Office (GPO), Washington, DC 20402-9371; telephone: (202) 512-1800. Contact GPO for current prices. **Questions or messages regarding errors in formatting should be addressed to mmwrq@cdc.gov.Page converted: 9/14/2004 |
|||||||||
This page last reviewed 9/14/2004
|