 |
|
|
|
|
|
|
| ||||||||||
|
|
|
|
|
|
|
||||
| ||||||||||
|
|
|
|
|
Persons using assistive technology might not be able to fully access information in this file. For assistance, please send e-mail to: mmwrq@cdc.gov. Type 508 Accommodation and the title of the report in the subject line of e-mail. Surveillance for Acute Viral Hepatitis --- United States, 2005Annemarie Wasley, ScD
Corresponding author: Annemarie Wasley, ScD, Division of Viral Hepatitis, National Center for HIV/AIDS, Viral Hepatitis, STD, and TB Prevention (proposed), 1600 Clifton Rd., N.E., MS G-37, Atlanta, GA 30333. Telephone: 404-718-8500; Fax: 404-718-8585; E-mail: acw5@cdc.gov. AbstractProblem/Condition: In the United States, acute viral hepatitis most frequently is caused by infection with hepatitis A virus (HAV), hepatitis B virus (HBV), or hepatitis C virus (HCV). These unrelated viruses are transmitted through different routes and have different epidemiologic profiles. Safe and effective vaccines have been available for hepatitis B since 1981 and, for hepatitis A, since 1995. Reporting Period: Cases in 2005, the most recent for which data are available, are compared with those from previous years. Description of the System: Cases of acute viral hepatitis are reported to CDC via the National Notifiable Diseases Surveillance System. Results: Since 1995, the incidence of reported acute hepatitis A has declined by 88%, to the lowest rate ever recorded (2005: 1.5/100,000 population). Declines were greater among children and in states where routine vaccination of children was recommended beginning in 1999, compared with the remaining states. The proportion of cases among adults has increased. Since 1990, reported acute hepatitis B incidence has declined by 79%, to the lowest rate ever recorded (2005: 1.8/100,000 population). Declines occurred among all age groups but were greatest among children aged <15 years. Since the late 1980s, acute hepatitis C incidence also has declined. In 2005, as in previous years, the majority of these cases occurred among adults, and injection-drug use was the most common risk factor. Interpretation: The greater declines in hepatitis A rates among the states and age groups included in the 1999 recommendations for routine childhood hepatitis A vaccination suggest that this strategy reduced rates. Universal hepatitis B vaccination of children has resulted in substantially lower rates among younger age groups. Higher rates of hepatitis B continue among adults, particularly males aged 25--44 years, which emphasize the need to vaccinate adults at risk for HBV infection. The decline in hepatitis C incidence is primarily attributed to a decrease in incidence among injection-drug users (IDUs). The reasons for this decrease are multifactorial and are probably related to risk-reduction practices among IDUs. Public Health Actions: The recent expansion of recommendations for routine hepatitis A vaccination to include all children in the United States aged 12--23 months is expected to further reduce hepatitis A rates. Ongoing hepatitis B vaccination programs will ultimately eliminate domestic HBV transmission, and increased vaccination of adults who have risk factors will accelerate progress toward elimination. Prevention of hepatitis C relies on identifying and counseling uninfected persons at risk for hepatitis C (e.g., IDUs) regarding ways to protect themselves from infection. Introduction Viral hepatitis is caused by infection with any of at least five distinct viruses, of which the most commonly identified in the United States are hepatitis A virus (HAV), hepatitis B virus (HBV), and hepatitis C virus (HCV). All three viruses can cause an acute illness characterized by nausea, malaise, abdominal pain, and jaundice. HBV and HCV also can produce a chronic infection that is associated with an increased risk for chronic liver disease and hepatocellular carcinoma. HAV is transmitted through the fecal-oral route, spreading primarily through close personal contact with an HAV-infected person. Hepatitis A has been one of the most frequently reported notifiable diseases in the United States; during 1987--1997, an average of 28,000 cases of acute hepatitis A was reported for each year. However, effective vaccines to prevent HAV infection have been available in the United States since 1995. These vaccines have provided the opportunity to reduce substantially disease incidence and potentially eliminate transmission. Since 1996, hepatitis A vaccine has been recommended for persons at increased risk for infection, including international travelers, men who have sex with men (MSM), injection- and noninjection-drug users, and children living in communities with high rates of disease (1). In 1999, the Advisory Committee on Immunization Practices (ACIP) recommended that 1) routine hepatitis A vaccination be implemented for children living in 11 states (10 in the West and one in the South) where the average hepatitis A rates during 1987--1997 were at least 20/100,000 population (2) and that 2) hepatitis A vaccine be considered for children in six states where rates were at least 10/100,000 but less than 20/100,000. HBV is transmitted parenterally; therefore, the virus can only be transmitted through exposure to the blood or body fluids of an infected person. Transmission occurs through exposures such as injection-drug use, sexual contact with an infected person, and from an infected mother to her infant during delivery. Beginning in 1991, a comprehensive strategy for the elimination of HBV transmission was implemented in the United States (3). The four elements of this strategy are 1) universal vaccination of infants beginning at birth; 2) prevention of perinatal HBV infection through routine screening of all pregnant women for HBV infection and by providing immunoprophylaxis to infants born to infected women or to women of unknown infection status; 3) routine vaccination of previously unvaccinated children and adolescents; and 4) vaccination of adults at increased risk for infection, including health-care workers, dialysis patients, household contacts and sex partners of persons with chronic HBV infection, recipients of certain blood products, persons with a recent history of multiple sex partners or a sexually transmitted disease, MSM, and injection-drug users (IDUs). HCV, also transmitted parenterally, is the most prevalent bloodborne infection in the United States; approximately 3.2 million persons are chronically infected with HCV (4). No vaccine for this infection is available. National recommendations issued in 1998 for prevention and control of HCV infection (5) emphasize primary prevention activities to reduce the risk for HCV transmission. These activities include screening and testing blood donors, viral inactivation of plasma-derived products, risk-reduction counseling for persons at risk for HCV infection, and routine practice of infection-control precautions in health-care settings. This report describes the burden of acute hepatitis attributed to infection with HAV, HBV, or HCV and summarizes trends in the incidence of these diseases through 2005. MethodsConditions for Which Surveillance is ConductedNational surveillance is conducted for acute hepatitis A, B, and C viruses. Case definitions for these conditions are provided in this report. Data SourcesCases of acute viral hepatitis were reported to CDC by state and territorial health departments on a weekly basis via the National Notifiable Diseases Surveillance System (NNDSS). Since January 1, 2002, all reports have been submitted electronically by CDC via National Electronic Telecommunications System for Surveillance (NETSS). States' participation in reporting nationally notifiable diseases, including acute viral hepatitis, to CDC is voluntary. All states collect and report basic information (e.g., event date, source of report, and demographic characteristics) regarding cases of acute viral hepatitis. States also are asked to report additional information (e.g., laboratory test results, clinical information, and exposure history) regarding investigated cases, but completeness of reporting of these additional data varies among states. Approximately 40% of case reports received by CDC included any of these additional data. Information regarding state-specific reporting profiles is included in this report (Table 1). Case reports received through NNDSS represent a proportion of hepatitis virus infections that occur each year. For all three viruses, a substantial number of infections occur with few or no symptoms. For HAV infections, the likelihood of a person having symptomatic illness is age-dependent. The majority (>70%) of infections among young children are asymptomatic, but among adolescents and adults, the majority (>70%) are symptomatic (e.g., jaundice) (6,7). Similarly, for HBV, infections among infants and young children are typically asymptomatic, but among older children or adults, 30%--50% have clinical signs and symptoms (8). Among persons infected with HCV, 60%--70% are asymptomatic and another 10%--20% might have nonspecific symptoms (e.g., anorexia, malaise, or abdominal pain); 20%--30% of persons newly infected with HCV have jaundice (9--11). Surveillance for acute hepatitis does not identify persons with asymptomatic infections. In addition, some cases of acute hepatitis that do meet the case definition criteria are not captured by surveillance because they are not identified (e.g., the illness is mild and not recognized as hepatitis) or are not reported to local health departments. Evaluations of notifiable disease reporting suggest that for each case reported, two to three are not reported (12). For each of the viruses, the actual number of infections and acute cases are estimated by adjusting reported incidence for underreporting and asymptomatic infection; for these adjustments, factors are used from studies modeling the relation between the prevalence of hepatitis virus infections and the incidence of reported acute viral hepatitis (13--15). Case Definitions for Acute Viral HepatitisIn 2005, cases were required to meet the following clinical case definition for acute hepatitis and virus-specific laboratory criteria for diagnosis. Clinical Case Definition Acute hepatitis was defined as acute illness with 1) discrete onset of symptoms (e.g., nausea, anorexia, fever, malaise, or abdominal pain) and 2) jaundice or elevated serum aminotransferase levels. Laboratory Criteria for Diagnosis of Hepatitis Because the clinical characteristics are the same for all types of acute viral hepatitis, laboratory testing is needed to identify the specific viral cause of illness. The laboratory test requirements for confirming each type of acute viral hepatitis are listed below.
Case Classification For this analysis, a confirmed case was one that met the clinical case definition and was laboratory confirmed. For hepatitis A, a case also was considered confirmed if it met the clinical case definition and was diagnosed in a person who had an epidemiologic link to a person who had laboratory-confirmed hepatitis A (i.e., household or sexual contact with an infected person during the 15--50 days before the onset of symptoms). AnalysesIncidence Calculations For this analysis, crude rates (per 100,000 population) were calculated based on the U.S. Census Bureau. The following U.S. geographic regions were used: Midwest, West, Northeast, and South.* Frequency Analysis For this analysis, the percentage of persons who reported a specific risk factor was determined by using the number of persons who reported any information, positive or negative, regarding that exposure as the denominator. Depending on the type of hepatitis, the percentage of case reports that included any risk factor information ranged from 30%--40%. Multiple risk factors may be reported for a single person. Consequently, the percentages of persons with specific risk factors might total >100%. ResultsAcute Viral Hepatitis AOverall Incidence Historically, acute hepatitis A rates have varied cyclically, with nationwide increases every 10--15 years. The national rate of hepatitis A has declined steadily since the last peak in 1995. In 2005, a total of 4,488 acute symptomatic cases of hepatitis A were reported; the incidence was 1.5/100,000, the lowest rate ever recorded (Tables 2 and 3). After asymptomatic infection and underreporting were taken into account, an estimated 42,000 new infections occurred in 2005 (16). Rates by Region In addition to temporal variation, historically, hepatitis A rates have varied geographically, with the highest rates reported in the western region of the United States. However, incidence in the West has declined significantly (p<0.001), most notably after the 1999 issuance of recommendations for routine childhood vaccination in states with consistently elevated rates of hepatitis A. In 2005, rates in the West were approximately equal to those in other regions of the United States (Figures 2 and 3). Rates by Age The incidence of hepatitis A varies by age. Since the last nationwide increase in 1995, rates have declined among all age groups, but the greatest decreases have occurred among children. Historically, the highest rates have been observed among children and young adults; the lowest rates have been among persons aged >40 years. However, since 1997, rates among children have declined more rapidly than among adults, and in 2005, rates were similar across all age groups, ranging from 1.0/100,000 among children aged <5 years to 1.8/100,000 among persons aged 5--24 years (Figure 4). Since 2000, the lowest rates have occurred among children aged <5 years. However, asymptomatic infection is common among young children, and symptomatic cases in children aged <5 years represent only a limited proportion of infections that occur in this age group. Rates by Sex Rates of hepatitis A consistently have been higher among males than females, and during the late 1990s, the difference in the sex-specific rates increased until nearly two male cases were observed for every female case. However, beginning in 2001, rates declined more among males than females, and the difference in sex-specific rates decreased. In 2005, the rate of hepatitis A among males was 1.7/100,000 versus 1.3/100,000 among females. The difference in hepatitis A rates by sex occurred primarily among persons aged >19 years and was highest among persons aged 30--49 years (Figures 5 and 6). Rates by Race and Ethnicity Hepatitis A rates have differed by race; the highest rates have occurred among American Indians/Alaska Natives, and the lowest rates have occurred among Asians/Pacific Islanders. However, rates among American Indians/Alaska Natives, which were >60/100,000 before 1995, have decreased dramatically and, since 2001, have been approximately the same or lower than those for other races. Hepatitis A rates also have differed by ethnicity; rates among Hispanics have consistently been higher compared with non-Hispanics. Rates among Hispanics have decreased since 1997 but remain higher than those for non-Hispanics (Figure 7). Reported Risk Factors In 2005, the most frequently identified risk factor for hepatitis A was international travel. International travel was reported for 15% of hepatitis A cases overall and for 25% of cases among children aged <15 years. The majority of travel-related cases were, as in previous years, associated with travel to Mexico and Central/South America (81%). As HAV transmission in the United States has decreased, cases among travelers to countries where hepatitis is endemic have accounted for an increased proportion of all cases. Sexual and household contact with another person with hepatitis A has been among the most frequently identified risk factors; in 2005, it was reported for 12% of cases. During 1999--2002, the proportion (and the absolute number) of cases that occurred among MSM ranged from 14%--23%. However, this proportion has declined since 2003, and in 2005, was reported for 3% of all cases (and approximately 5% of cases that occurred among males). During 1997--2004, the proportion of persons who reported injection of street drugs ranged from 6% to 10%; in 2005, the proportion reported was 5% (Table 4; Figure 8). Clinical Characteristics In 2005, the clinical characteristics of reported hepatitis A cases were similar to previous years; 76% of persons had jaundice, 33% were hospitalized for hepatitis A, and 0.6% died from hepatitis A. The proportion of cases in which jaundice was reported was highest among persons aged 5--39 years (83%) and lowest among children aged <5 years (58%) and persons aged >60 years (58%). The proportion of persons hospitalized with hepatitis A increased with age, from 20% among children aged <5 years to 47% among persons aged >60 years (Table 5). Acute Hepatitis BOverall Incidence In 2005, a total of 5,494 acute, symptomatic cases of hepatitis B were reported; the overall incidence of acute hepatitis B was 1.8/100,000 and was the lowest ever recorded (Tables 2 and 6; Figure 9). After asymptomatic infection and underreporting were taken into account, an estimated 51,000 new infections occurred in 2005 (16). Rates by Region During 1995--2005, hepatitis B rates were similar for all U.S. regions (Figures 10 and 11). Since 2001, the highest rates have occurred in the South. Rates by Age Hepatitis B rates vary by age; the highest rates of hepatitis B consistently have occurred among persons aged 25--44 years (3.6/100,000), and the lowest rates occurred among persons aged <15 years (0.03/100,000). However, rates have declined among all age groups. Since 1990, the greatest percentage declines have occurred among children aged <15 years (98%) and young adults aged 15--24 years (90%). Although not as large as the declines in the younger age groups, substantial decreases in hepatitis B rates also have occurred among older persons; the rates observed for persons aged 25--44 and >45 years have decreased 74% and 58%, respectively (Figure 12). Rates by Sex As in previous years, in 2005, the rate of acute hepatitis B for males (2.3/100,000) was higher than that for females (1.4/100,000). Since 1990, the male:female ratio of cases has increased slightly. In 2005, the rate for males was approximately 1.6 times higher than that for females (Figure 13). This difference in hepatitis B rates by sex occurred primarily among persons aged >19 years and was highest among persons aged >35 years (Figure 14). Rates by Race and Ethnicity In 2005, rates of hepatitis B continued to decline among all racial/ethnic populations (Figure 15). Rates remained highest among non-Hispanic blacks (2.9/100,000) and were similar in all other groups. The downward trend in the rate for Asians/Pacific Islanders has continued, and in 2005, the rate for this population (1.2/100,000) was similar to Hispanics (1.1/100,000) and non-Hispanic whites (1.1/100,000). Reported Risk Factors for Infection Of persons for whom information regarding exposures was available, approximately one third reported at least one sexual risk factor (i.e., 10%, sexual contact with a person known to have hepatitis B; 32%, multiple sex partners; and 13%, MSM). Injection-drug use was reported for 15% of persons. The proportion of persons who reported receiving hemodialysis or blood transfusion (both of which historically were major sources of infection) or having had occupational exposure to blood were low (0.3%, 0.2%, and 0.8%, respectively). However, 9.3% of patients reported having had surgery during the 6 weeks--6 months before onset of illness (Table 7; Figure 16). Clinical Characteristics In 2005, of persons reported with hepatitis B, 77% had jaundice, 40% were hospitalized, and 1% died. The proportion of persons with jaundice ranged from 57% of children aged <15 years to 81% of persons aged 15--39 years. The proportion of persons hospitalized for hepatitis B increased with age, from 20% among children aged <15 years to 47% among persons aged >60 years (Table 8). Acute Hepatitis COverall Incidence In 2005, a total of 671 cases of confirmed acute hepatitis C were reported; the overall national rate was 0.2/100,000. After asymptomatic infection and underreporting were taken into account, approximately 20,000 new HCV infections occurred in 2005 (16) (Tables 2 and 9; Figure 17). Rates by Age Since the mid-1990s, hepatitis C rates have declined in all age groups. The greatest decline has occurred among persons aged 25--39 years, who have been the age group with the highest rates of disease. Among this age group, incidence has declined by 58% since 2000 and 92% since 1992; in 2005, the rate decreased to 0.4/100,000. Few cases are reported in persons aged <15 years (Figure 18). Rates by Sex In 2005, as in previous years, the rate of reported hepatitis C was higher for males (0.26/100,000 population) than for females (0.21/100,000 population). However, this difference in rates has declined over the decade. In 2005, the male:female ratio was the smallest since reporting began in 1966 (Figures 19 and 20). Rates by Race and Ethnicity Since 1995, the incidence of hepatitis C has declined in all racial populations. In 2005, rates were similar across racial/ethnic populations and ranged from 0.02/100,000 among Asians/Pacific Islanders to 0.36/100,000 among American Indians/Alaska Natives (Figure 21). Rates of hepatitis C were similar for Hispanics and non-Hispanics. Reported Risk Factors for Infection Of the cases reported in 2005 for which information concerning exposures during the incubation period was available, the most common risk factor identified for hepatitis C was injection-drug use (50%). During 1995--2005, injection-drug use was reported for an average of 39% of persons (range: 31%--50%). In 2005, 14% of persons with hepatitis C reported having had surgery, and 23% of persons reported having had multiple sex partners during the incubation period. A total of 8% of persons reported occupational exposure to blood (Table 10; Figure 22). Clinical Characteristics In 2005, 60% of persons with hepatitis C had jaundice, 42% were hospitalized, and 1.3% died (Table 11). DiscussionNational surveillance for acute viral hepatitis provides the information needed for developing prevention strategies
and monitoring their effectiveness. During >4 decades that
national surveillance for acute viral
hepatiti Hepatitis AHepatitis A rates have varied cyclically, with the last peak in morbidity occurring in 1995. The incidence of hepatitis A began to decline after the introduction of licensed hepatitis A vaccines in the United States in 1995 and the issuance in 1996 of the first public health recommendations for the use of vaccine to prevent transmission of HAV. The greatest declines have occurred since 1999, when recommendations were made for childhood vaccination. These recommendations called for 1) routine vaccination of children living in states and communities where the average hepatitis A rate during the baseline period (1987--1997) was >20/100,000 population (twice the national average) and for 2) consideration of vaccination of children in those states and communities where the average rate during the baseline period was at least 10/100,000 but not as high as 20/100,000 (2). The 2005 rate (1.5/100,000) was the lowest ever recorded in the United States and is >80% lower than any previously recorded nadir. After implementation of the 1999 recommendations, major changes occurred in the geographic distribution of hepatitis A. Relative to their pre-vaccine era rates, a substantially greater decline in incidence occurred for the 17 western and midwestern states that were included in the 1999 recommendation than for the remainder of the country (17). As a result, starting in 2001, hepatitis A rates were similar across all U.S. regions for the first time since surveillance began in 1966. In 2005, the majority of cases of hepatitis A cases were reported from states that historically have reported low rates and where hepatitis A vaccination of children has not been widely implemented. In 2005, approximately two thirds of the 4,488 cases reported originated from states without childhood vaccination recommendations. After the implementation of routine childhood vaccination, changes in the age distribution of cases also occurred. During the pre-vaccine era, the reported incidence of hepatitis A was highest among children aged 5--14 years; approximately one third of reported cases occurred among children aged <15 years. Since routine childhood vaccination, incidence has declined more sharply among the age group (2--18 years) covered by the recommendations than among older age groups. As a result, in 2005, rates were similar among all age groups (17). The highest rates of disease were among adults, particularly among males aged 20--34 years. The low and relatively stable rates reported among persons aged >40 years reflect the higher proportion of persons in this age group who had immunity as a result of previous infection. Data from the Third National Health and Nutrition Examination Survey (NHANES III) conducted during 1988--1994 indicated that approximately 30% of the U.S. population had serologic evidence of immunity to HAV; the highest percentage was 75% among persons aged >70 years (18). An investigation of an increased number of hepatitis A cases reported during 2002--2004 among older persons (i.e., >60 years) with no identified risk factors suggested that many reports in this age group did not represent acute hepatitis A; a high proportion of these reports had false-positive results for the IgM anti-HAV assay. The assay is highly specific and sensitive when used in persons with symptoms of acute hepatitis, but the assay does not perform as well when the prevalence of acute hepatitis A in the population is low. The high proportion of false positive results was a reflection of increased and largely inappropriate use of testing of persons without signs or symptoms of acute hepatitis (19). Disparities in rates among racial/ethnic populations also decreased after the introduction of hepatitis A vaccine. In particular, rates for American Indians/Alaska Natives, which were five times those of other racial/ethnic groups during the pre-vaccine era, were lower than those for other racial/ethnic groups in 2005. This decline occurred after the widespread use of hepatitis A vaccine in Native American communities beginning in 1996 (20). Hispanics also historically have had elevated hepatitis A rates, and although incidence in this group has declined by 87% compared with the pre-vaccine era, the 2005 rate for Hispanics (2.7/100,000) remained two to fourfold higher than the rate for non-Hispanics. In 2005, the highest rate of hepatitis A in any demographic subgroup occurred among Hispanics living in states without a recommendation for routine hepatitis A vaccination of children (17). The observed declines in the incidence of hepatitis A were accompanied by shifts in the epidemiologic profile of this disease. The large communitywide outbreaks that occurred as a result of person-to-person contact in households and extended family settings have become increasingly rare. The disappearance of these outbreaks can be attributed to declining rates of infection among children who, because they frequently have asymptomatic infection, have often played a key role in sustaining HAV transmission. As this type of transmission has decreased, the proportion of cases among persons in high-risk populations, specifically international travelers, illicit-drug users, and MSM, has increased. Although the absolute number of international travel-associated cases has remained nearly unchanged, the proportion of cases attributed to this exposure has increased, accounting for 15% of all cases in 2005. Outbreaks of hepatitis A among illicit-drug users and MSM also have continued to occur. Since 1996, hepatitis A vaccination has been recommended for MSM and illicit-drug users; however, in 2005, vaccine coverage among these groups appeared to be low, although precise data were lacking (21). In 2005, the licensing of hepatitis A vaccines was revised to allow vaccination of children aged 12--23 months (21), which has made incorporating hepatitis A vaccine into the routine childhood immunization schedule feasible. In late 2005, ACIP recommended that all U.S. children aged 12--23 months receive hepatitis A vaccine (21). Nationwide vaccination of children against hepatitis A will likely result in further reductions in current demographic disparities and in lower overall rates of infection. The new 2005 recommendations provide the foundation for eventual consideration of elimination of indigenous HAV transmission in the United States. Ongoing surveillance for acute hepatitis A will provide the data needed to measure the progress toward that goal. Hepatitis BThe decline in hepatitis B incidence began (in the mid-1980s) earlier than the decline in hepatitis A incidence and has coincided with the stepwise implementation of the four elements of the national strategy to eliminate HBV transmission (3). The 2005 rate of 1.8/100,000 was the lowest recorded since surveillance began in 1966 and represents an estimated 80% decline since the national strategy was implemented in 1991. The greatest declines have occurred among the cohort of children to whom the recommendations for routine infant and adolescent vaccination have applied. Incidence among children aged <15 years declined 98%, from 1.2/100,000 in 1990 to 0.03 in 2005. This decline correlates with high vaccination coverage rates among young children; the most recent (2005) vaccination coverage rate among children aged 19--35 months was >93% (22). As incidence of hepatitis B has decreased among U.S.-born children, an increasing proportion of infections among children have been among unvaccinated foreign-born children. During 2001--2002, eight (42%) of 19 children with acute hepatitis B who were born after 1991, the year universal vaccination of infants was introduced in the United States, were foreign-born (23). Since 1990, a decline in incidence also has occurred among persons aged 25--44 years, but rates in this age group, particularly among males, still remained substantially higher than any other age group. A high proportion of these cases occurred among persons with risk factors for HBV infection (e.g., IDUs, MSM, and persons with multiple sex partners). The male:female ratio of cases has increased gradually; in 2005, approximately 1.5 male cases were reported for every female case among persons aged 25--44-years, reflecting an increasing concentration of disease burden in adult males. In 2005, few cases occurred among previously high-risk populations, including dialysis patients and health-care workers, as a result of continued improvements in infection control and ongoing hepatitis B vaccination in these groups. A 2003 survey indicated that approximately 75% of health-care workers were vaccinated against hepatitis B (24). In 2002, vaccination coverage among dialysis patients was 56% (25). Transmission associated with transfusions is rare as a result of required screening of blood products. In contrast, the continued occurrence of cases among IDUs and persons with sexual risk factors indicates a need to strengthen efforts to vaccinate these populations. Since 1990, progress has been made in reducing racial/ethnic disparities in hepatitis B rates. Before 1990, Asians/Pacific Islanders had disproportionately higher rates of hepatitis B. The decrease in disparity between Asians/Pacific Islanders and other races/ethnicities was consistent with observed declines in the seroprevalence of HBV infection among high-risk Asian children after the successful implementation of routine hepatitis B vaccination (26,27). Although rates among non-Hispanic blacks have declined, they remain more than twofold higher than those among other racial/ethnic populations. Health-care--related transmission of hepatitis B is documented infrequently in the United States but should be considered when cases of acute viral hepatitis in persons without traditional risk factors for infection are identified. The declining incidence of hepatitis B has been associated with increasing recognition of sporadic cases associated with medical care (28,29). State and local health authorities should consider strategies to improve detection of health-care--associated cases, such as intensive investigation of cases that occur among persons who typically have low risk for infection (e.g., persons aged >60 years) or who have no recognized risk factors for infection. Surveillance data for acute hepatitis B are needed for measuring the effectiveness of the HBV-elimination strategy. However, to describe completely the burden of HBV infection in the United States and to better assess the effectiveness of certain components of the prevention strategy, other types of surveillance data also are needed. As the incidence of acute hepatitis B continues to decline, seroprevalence surveys are needed to validate incidence data and describe the burden of chronic HBV infection. Hepatitis CThe incidence of hepatitis C has declined steadily since peaking in the late 1980s. This decline is primarily the result of a decrease in cases among IDUs; the reasons are probably related to risk-reduction practices in this population, including declines in needle-sharing behaviors. In 2005, injection-drug use continued to be the most commonly identified risk factor for infection. Approximately 40% of persons who reported multiple sex partners, which was the next most frequently reported risk factor, also reported injection-drug use. The proportion of persons with hepatitis C who reported multiple sex partners was similar for persons who reported drug use and those who did not. Surveillance data are not intended to assess causality; however, other studies conducted to evaluate the role of sexual transmission of HCV have indicated that the virus is spread inefficiently through this route, although it does occur. Transmission of HCV associated with transfusion, an important risk factor for infection in previous years, was rare as a result of required blood screening. The investigation of persons without typical risk factors for infection will help to ensure the detection of transmission associated with medical care and other uncommon sources of infection. Since 1992, the greatest declines in incidence of acute hepatitis C have occurred among persons aged 25--39 years, the age group that has had the highest rates. In 2005, cases among children continued to be rare. Progress has been made in reducing disparities in race/ethnicity-specific rates; in 2005, the incidence of acute hepatitis C was similar across all racial/ethnic populations. However, previous racial/ethnic disparities in incidence were demonstrated by disparities in prevalence, with a higher rate of chronic infection among non-Hispanic blacks than among other racial/ethnic populations (4). Although the number of new cases of acute hepatitis C has declined, a substantial burden of disease as a result of chronic infection still persisted in 2005. Approximately 3.2 million persons in the United States were chronically infected with HCV; the peak prevalence occurred among persons aged 40--49 years, the majority of whom likely became infected during the 1970s and 1980s when rates were highest (4). Data on both the incidence of acute disease and the prevalence of chronic infection are needed to assess comprehensively the burden of disease caused by HCV infection in the United States. However, surveillance for acute hepatitis C remains critical as the best means to assess the effects of primary prevention strategies, determine where transmission continues to occur, and identify and control outbreaks. LimitationsThe analyses summarized in this report are based on cases of symptomatic, serologically confirmed acute viral hepatitis reported to NNDSS. NNDSS is a passive surveillance system and subject to several limitations. First, the cases reported represent only a portion of all infections. Surveillance for acute disease is not intended to identify asymptomatic infections, but some persons with symptomatic illness also are not identified and reported. Studies have estimated that for each hepatitis case reported to NNDSS, two to five cases that would meet the case definition are not reported (12,13). Second, completeness of case reports also can vary. However, available evidence suggests that no systematic changes have occurred in reporting patterns since 1990. The national trends in this report also are reflected in the Sentinel Counties Study of Acute Viral Hepatitis, an ongoing CDC study since the 1980s, in which the accuracy and completeness of reporting have been assessed and are known to be high (30). Rates based on NNDSS data represent a lower estimate of the incidence of acute viral hepatitis in the United States because not all cases of acute hepatitis are reported. However, because the proportion of cases not reported has not changed systematically over time, these estimates accurately reflect changing trends in these diseases in the United States. ConclusionSurveillance for acute viral hepatitis accomplishes multiple key public health objectives. Surveillance detects outbreaks and identifies persons in need of postexposure prophylaxis. It also provides information on trends in the incidence and risk factors for recent infection needed to develop and evaluate prevention strategies. For example, surveillance data have provided a basis for recommendations for the use of hepatitis A and hepatitis B vaccines to prevent and control these diseases in the United States and are now used to monitor the effectiveness of these strategies. The minimum data required to conduct surveillance for acute viral hepatitis are laboratory confirmation of cases to distinguish the types of acute hepatitis and clinical information to verify the case definition. The collection of risk factor data provides useful information for identifying modes of hepatitis transmission and for implementing and evaluating prevention strategies. References
* Midwest: Illinois, Indiana, Iowa, Kansas, Michigan, Minnesota, Missouri, Nebraska, North Dakota, Ohio, South Dakota, and Wisconsin; Northeast: Connecticut, Maine, Massachusetts, New Hampshire, New Jersey, New York, Pennsylvania, Rhode Island, and Vermont; South: Alabama, Arkansas, Delaware, District of Columbia, Florida, Georgia, Kentucky, Louisiana, Maryland, Mississippi, North Carolina, Oklahoma, South Carolina, Tennessee, Texas, Virginia, and West Virginia; West: Alaska, Arizona, California, Colorado, Hawaii, Idaho, Montana, Nevada, New Mexico, Oregon, Utah, Washington, and Wyoming. Table 1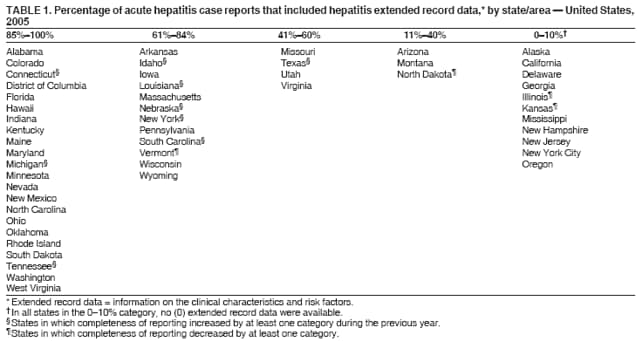 Return to top. Figure 1 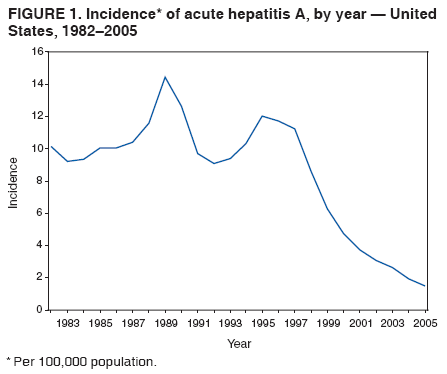 Return to top. Table 2 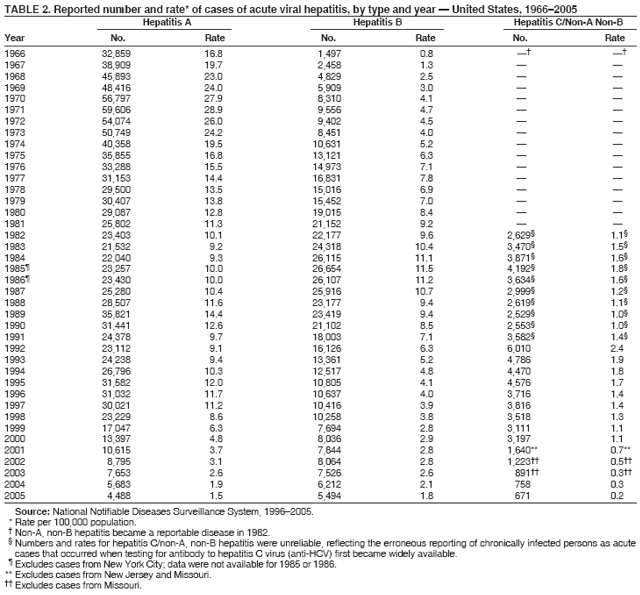 Return to top. Figure 2 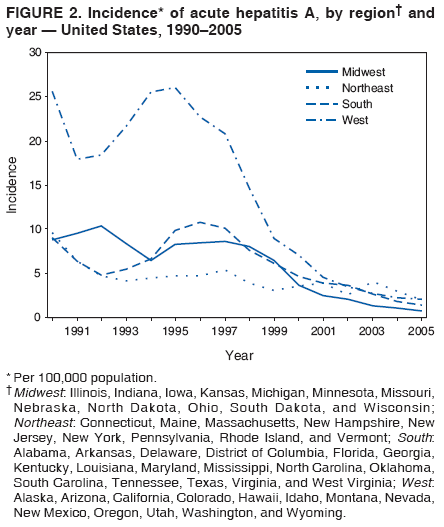 Return to top. Table 3 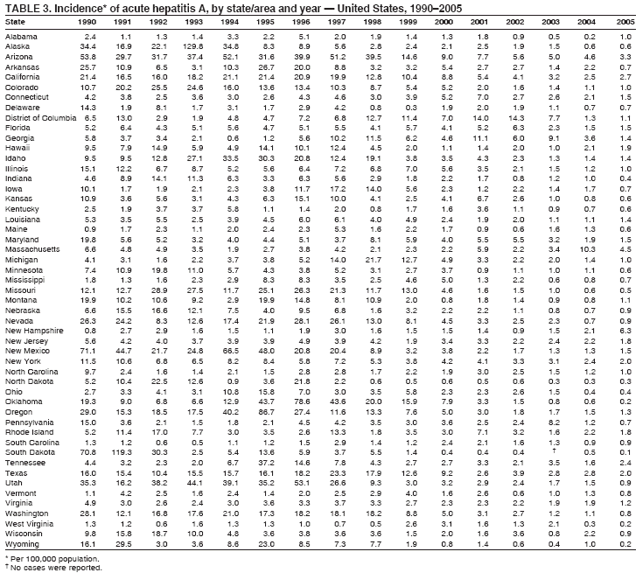 Return to top. Figure 3 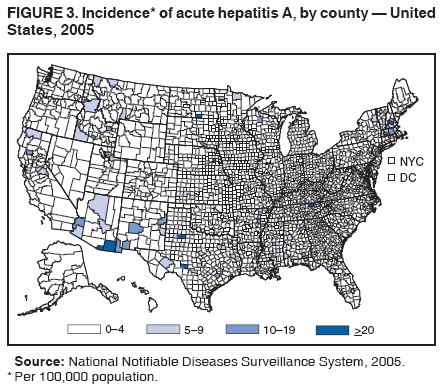 Return to top. Table 4 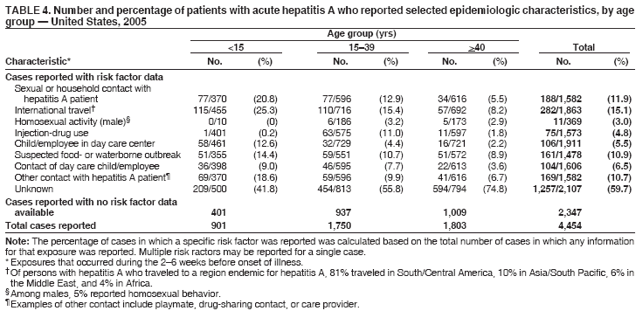 Return to top. Figure 4 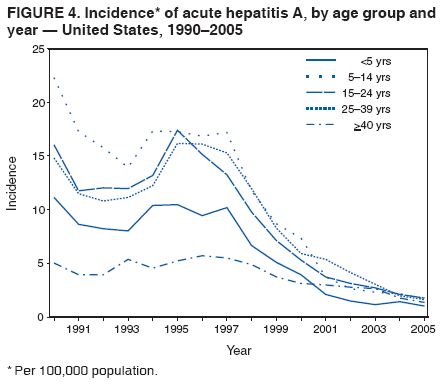 Return to top. Table 5 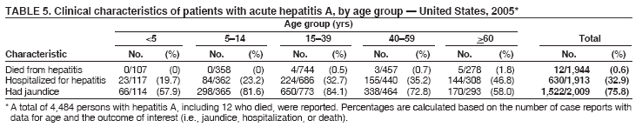 Return to top. Figure 5 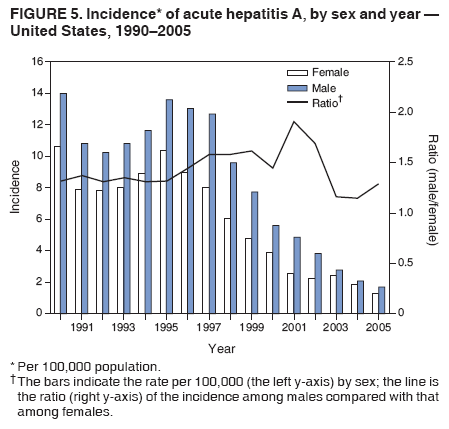 Return to top. Table 6 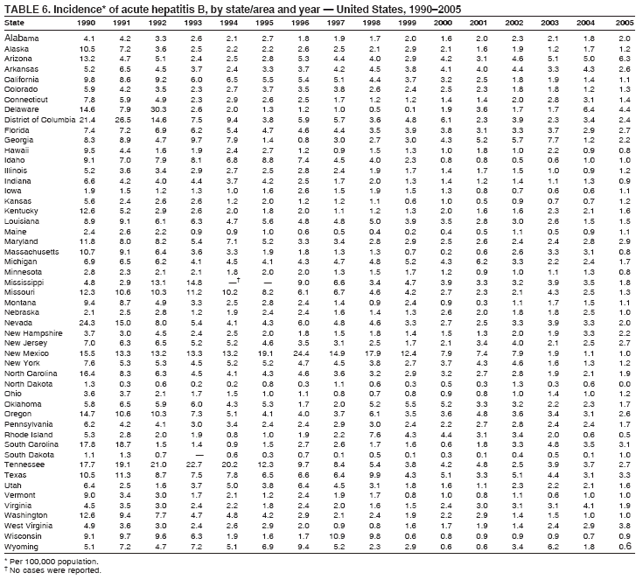 Return to top. Figure 6 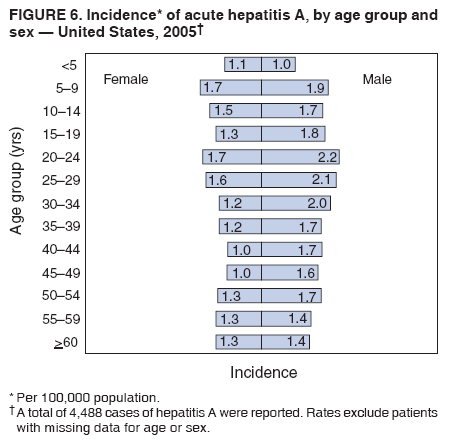 Return to top. Table 7 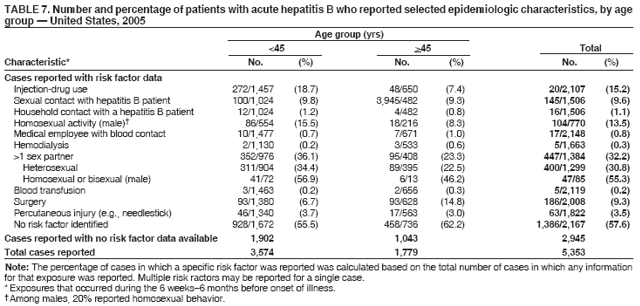 Return to top. Figure 7 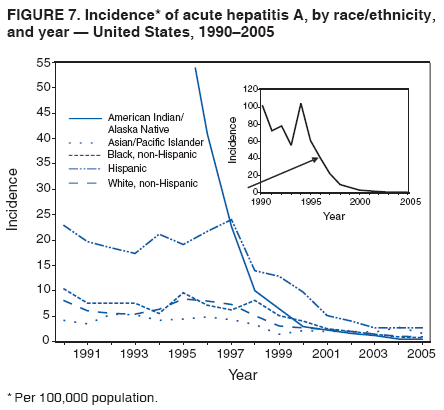 Return to top. Table 8 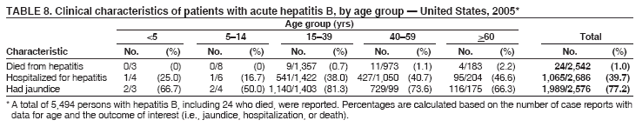 Return to top. Figure 8 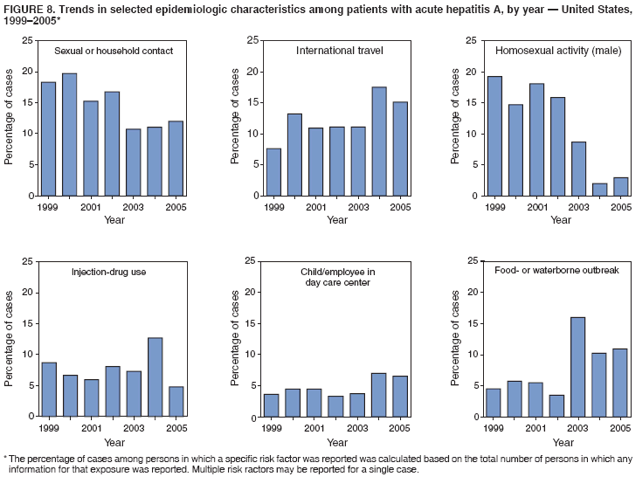 Return to top. Table 9 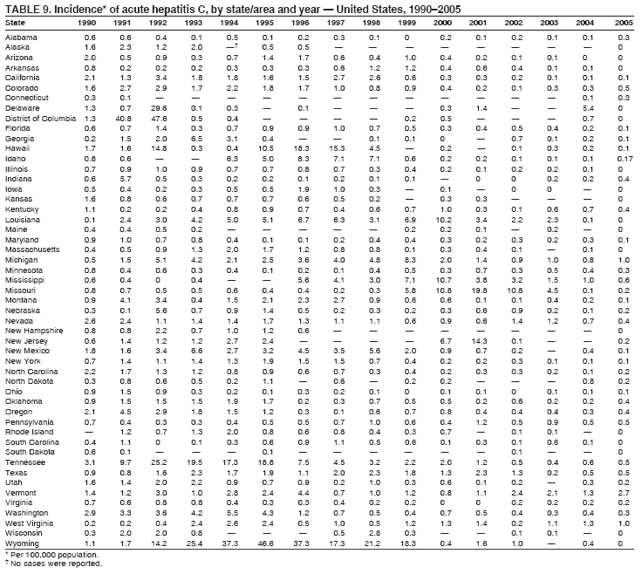 Return to top. Figure 9 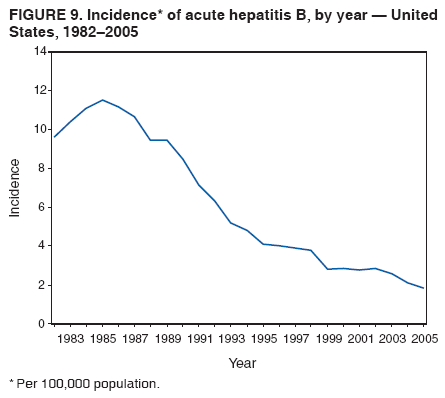 Return to top. Table 10 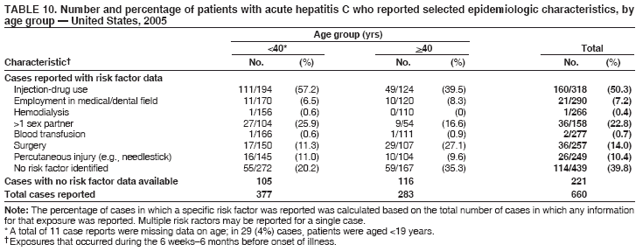 Return to top. Figure 10 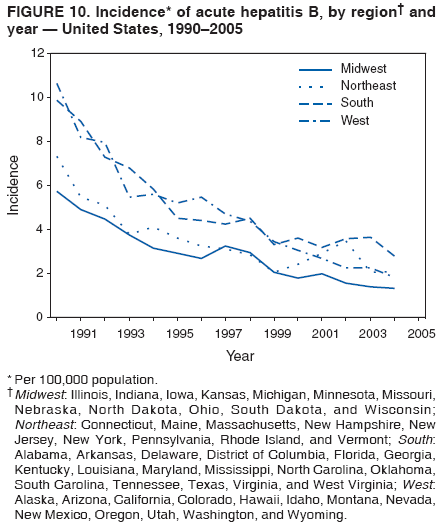 Return to top. Table 11 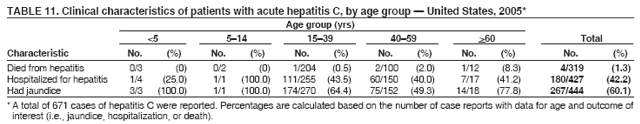 Return to top. Figure 11  Return to top. Figure 12 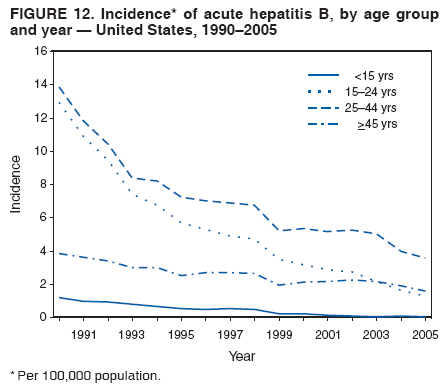 Return to top. Figure 13 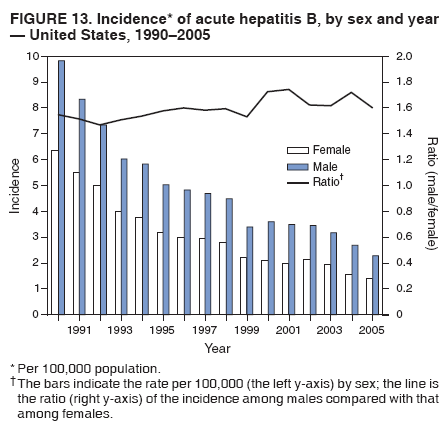 Return to top. Figure 14 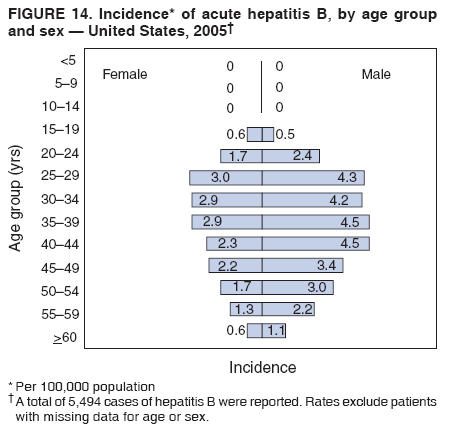 Return to top. Figure 15 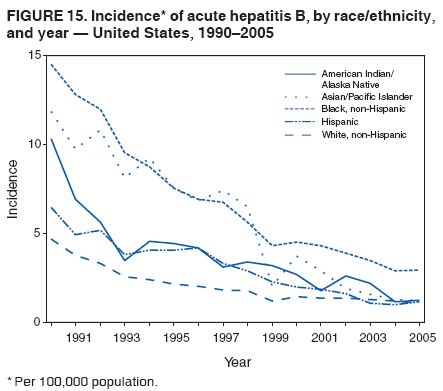 Return to top. Figure 16 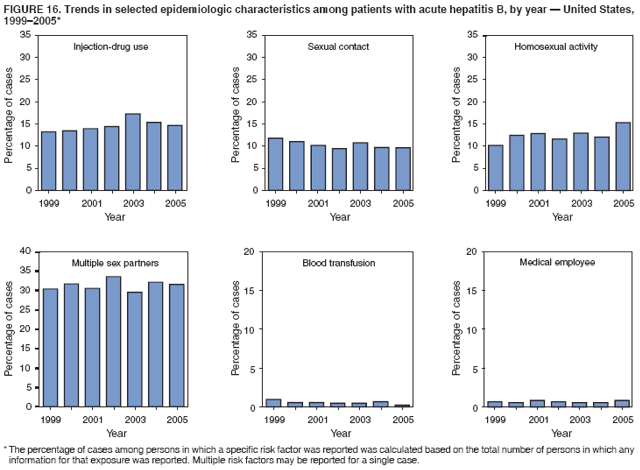 Return to top. Figure 17 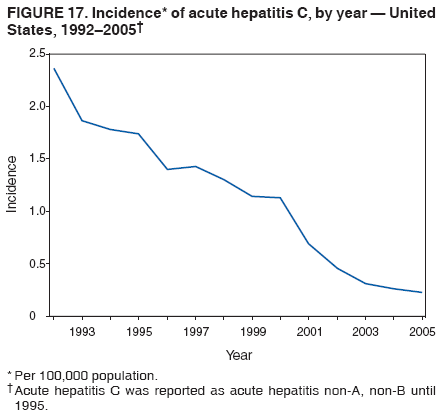 Return to top. Figure 18 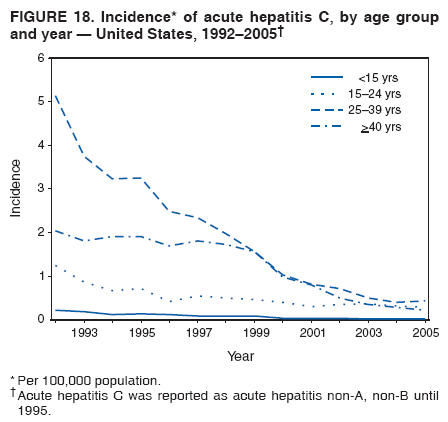 Return to top. Figure 19 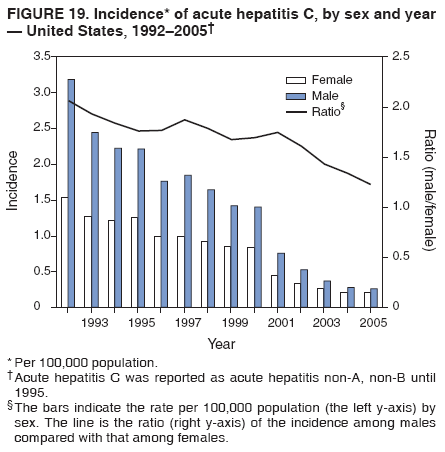 Return to top. Figure 20 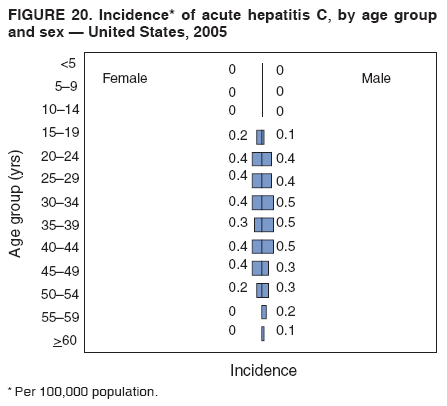 Return to top. Figure 21 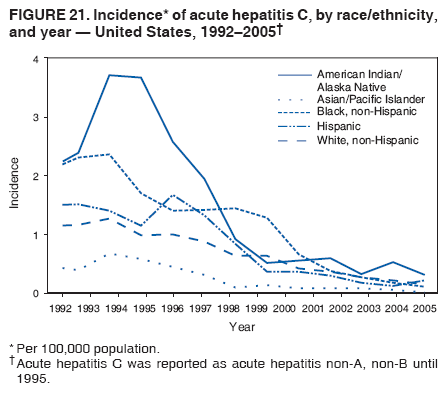 Return to top. Figure 22 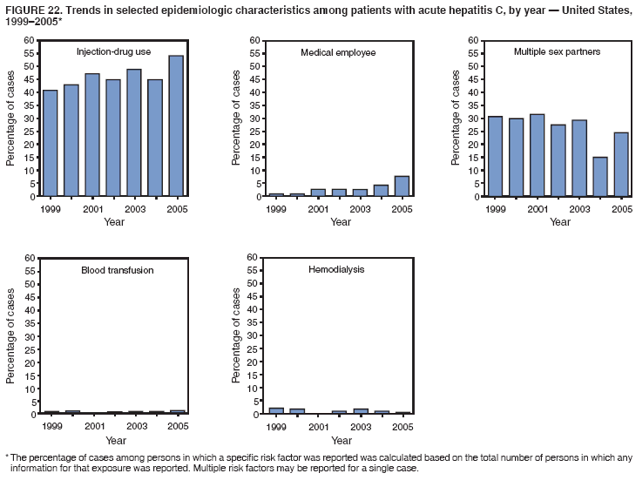 Return to top.
Disclaimer All MMWR HTML versions of articles are electronic conversions from ASCII text into HTML. This conversion may have resulted in character translation or format errors in the HTML version. Users should not rely on this HTML document, but are referred to the electronic PDF version and/or the original MMWR paper copy for the official text, figures, and tables. An original paper copy of this issue can be obtained from the Superintendent of Documents, U.S. Government Printing Office (GPO), Washington, DC 20402-9371; telephone: (202) 512-1800. Contact GPO for current prices. **Questions or messages regarding errors in formatting should be addressed to mmwrq@cdc.gov.Date last reviewed: 3/2/2007 |
|||||||||
|