
Persons using assistive technology might not be able to fully access information in this file. For assistance, please send e-mail to: mmwrq@cdc.gov. Type 508 Accommodation and the title of the report in the subject line of e-mail.
Adult Blood Lead Epidemiology and Surveillance --- United States, 2005--2007
Overexposure to inorganic lead continues to be an important health problem worldwide. Furthermore, recent research has caused increased concerns about the toxicity of lead at low doses (1,2). Lead can cause acute and chronic adverse effects in multiple organ systems, ranging from subclinical changes in function to symptomatic, life-threatening intoxication. Since 1992, CDC's state-based Adult Blood Lead Epidemiology and Surveillance (ABLES) program has tracked laboratory-reported elevated blood lead levels (BLLs) in U.S. adults. The vast majority (95%) of reported elevated BLLs have been work related. One of the Healthy People 2010 national public health objectives is to reduce to zero the prevalence of BLLs ≥25 µg/dL among adults (objective 20-7) (3). ABLES surveillance results through 2004 have been published previously (4--6). This report summarizes results for the period 2005--2007. An overall decline in national rates of elevated BLLs among state residents plus nonresidents from 14.0 in 1994 to 7.8 in 2007 has been observed. The national rate of state resident adults with BLLs ≥25 µg/dL was 7.2 per 100,000 employed adults in 2005 and 7.4 in 2006 and 2007. Industry subsectors with the highest numbers of lead-exposed workers were manufacturing of storage batteries, mining of lead and zinc ores, and painting and paper hanging. The most common nonoccupational exposures were shooting firearms; remodeling, renovating, or painting; retained bullets (gunshot wounds); and eating food containing lead. These findings indicate a need for increased preventive interventions to promote healthier workplaces and help move toward the Healthy People 2010 objective.
ABLES reporting benchmarks include BLLs ≥25 µg/dL and BLLs ≥40 µg/dL. State ABLES programs collect data on adult BLLs from laboratories and health-care providers through mandatory reporting requirements. ABLES states then intervene to prevent lead overexposures in worksites where elevated exposures occur. These interventions include 1) conducting follow-up interviews with physicians, employers, and workers; 2) investigating work sites; 3) providing technical assistance; 4) providing Occupational Safety and Health Administration (OSHA) referrals for consultation and enforcement; and 5) developing and disseminating educational materials and outreach programs.
A unique identifier is assigned to each person to account for multiple BLL reports. For BLLs ≥25 µg/dL, follow-up by telephone generally is conducted to ensure completeness of information on the industry where the person works, exposure source (occupational or nonoccupational), and other variables. The industry where the person worked is coded using the 1987 Standard Industrial Classification (SIC) or the 2002 North American Industry Classification System (NAICS). BLL reporting requirements vary among ABLES states, ranging from the reporting of all BLLs to BLLs ≥40 µg/dL.* Most ABLES states submit data on all BLLs to CDC's National Institute for Occupational Safety and Health (NIOSH), including reports from persons whose BLLs fall below the state reporting requirement.
For this report, adults were considered to be all persons aged ≥16 years. For adults with more than one BLL result in a given year, only the highest BLL was included in this report. Elevated BLLs were defined as blood lead concentrations ≥25µg/dL. Rate numerators were "state resident" adults with elevated BLLs (adults residing in the reporting state) or "state residents plus nonresidents" adults with elevated BLLs (all adults reported by a state). Denominators were the annual employed population aged ≥16 years for the period 2005--2007 from the Current Population Survey.† To calculate yearly state prevalence rates, the numbers of adults with elevated BLLs from each state were divided by the state's annual employed population. The combined state numerators and denominators for each year were then used to calculate the national prevalence rate.§
Data were provided by 37 states in 2005, 38 states in 2006, and 38 states in 2007.¶ Overall, national rates of elevated BLLs declined from 14.0 per 100,000 employed adults in 1994 to 7.8 in 2007 (Figure 1). ABLES states reported 8,902, 9,562, and 9,871 state resident adults with elevated BLLs in 2005, 2006, and 2007, respectively. The national rate per 100,000 state resident adults with elevated BLLs declined 4%, from 7.5 in 2004 to 7.2 in 2005, but increased 3%, from 7.2 in 2005 to 7.4 in 2006 and 2007. State annual prevalence for 2005 ranged from 0.5 (Hawaii) to 34.0 (Kansas); for 2006, from 0.2 (Montana) to 32.3 (Pennsylvania); and for 2007, from 0.8 (New Mexico) to 36.4 (Missouri). Prevalence rates in 2007 were <10 in 29 states and ≥20 in six states (Figure 2).
Rates per 100,000 state resident adults with BLLs ≥40 µg/dL, a second ABLES reporting benchmark, were 1.2 in 2004 and 2005, 1.1 in 2006, and 1.2 in 2007. In 2005, prevalence rates ranged from 0.1 (Arizona and New Mexico) to 9.5 (Alabama). In 2006, prevalence rates ranged from 0.2 (Arizona) to 7.5 (Alabama). In 2007, prevalence rates ranged from 0.1 (Oklahoma) to 9.1 (Alabama).
Data on industry and exposure source were submitted by 33 states (7,492 state resident adults) in 2005, 35 states (8,230 state resident adults) in 2006, and 35 states (8,246 state resident adults) in 2007.** For this analysis, adults exposed to both occupational and nonoccupational sources (17 in 2005, 24 in 2006, and 11 in 2007) were considered exposed at work only. Exposures at work accounted for 5,861 (78.2%), 6,643 (80.7%), and 6,463 (76.7%) elevated BLLs in 2005, 2006, and 2007, respectively. The majority of adults with elevated BLLs were employed in three large industry sectors: manufacturing (64.8% in 2005 and 71.8% in 2006 and 2007), construction (15.2% in 2005, 12.6% in 2006, and 11.4% in 2007), and mining (9.4% in 2005, 9.5% in 2006, and 10.5% in 2007). Specific industry subsectors with the highest numbers were manufacturing of storage batteries, mining of lead and zinc ores, and painting and paper hanging (Table). Nonoccupational exposures accounted for 330 (4.4%), 380 (4.6%), and 350 (4.2%) adults in 2005, 2006, and 2007, respectively. Among these, the most common exposures were shooting firearms; remodeling, renovating, or painting; retained bullets (gunshot wounds); and eating food containing lead (Table).
Reported by: WA Alarcon, MD, RJ Roscoe, MS, GM Calvert, MD, JR Graydon, Div of Surveillance, Hazard Evaluations, and Field Studies, National Institute for Occupational Safety and Health, CDC.
Editorial Note:
ABLES surveillance results indicate an overall decreasing trend in the national prevalence rate of elevated BLLs in adults since 1994 (Figure 1), with a slight increase in the 2006 and 2007 rates. Part of the overall decrease might be the result of a decline in the number of manufacturing jobs with potential for lead exposure over time, in addition to prevention measures that have been enacted since the early 1990s, including 1) improved interventions by ABLES states, worker-affiliated organizations, and federal programs (e.g., NIOSH's ABLES surveillance†† and OSHA's National Emphasis Program to reduce lead exposure§§) and 2) measures implemented by industry (e.g., engineering controls, work practices, and respiratory protection). However, these rates might also reflect low employer compliance with testing and reporting requirements. A 2008 report using ABLES data found that only 29% of adults with BLLs requiring medical removal from work involving lead exposure received appropriate follow-up blood lead tests and met the eligibility criteria to return to their work (7). The slight increase in national rates in the ABLES data for 2006 and 2007 might have resulted from increased exposures at workplaces or improved testing and reporting. Changes in annual rates also might reflect increased or decreased surveillance activities by ABLES state programs.
ABLES data also indicate that excessive exposure to lead remains primarily an occupational health problem in the United States; 95% of adults with an identified exposure source were exposed at work. As in the past, during 2005--2007, these exposures occurred mainly in battery manufacturing, lead and zinc ores mining, and painting and paper hanging industry subsectors. The consistently higher proportions of adults with BLLs ≥40 µg/dL among those with BLLs ≥25 µg/dL observed in the painting and paper hanging, special trade contractors, and nonferrous foundries industries from 2005 through 2007 (Table 1) likely reflect higher lead exposures in these industries.
OSHA lead standards require removing a worker from lead exposure when the whole-blood lead concentrations ≥50 µg/dL for construction workers or ≥60 µg/dL for general industry workers, and permit return to work when their BLLs is ≤40 µg/dL (8,9). The current CDC/NIOSH surveillance case definition for elevated BLLs in adults is BLL ≥25 µg/dL. Recent research has consistently demonstrated the toxicity of lead from chronic dose exposures <30 µg/dL. Low-dose lead exposure can result in adverse effects in multiple organ systems, including effects in neurologic, cardiovascular, reproductive, and renal function (1,2).
CDC is making efforts to reduce occupational lead exposures through collaborations with state ABLES programs (by providing technical support and funding for surveillance); with worker-affiliated organizations (e.g., NIOSH cooperated with the Center for Construction Research and Training, formerly known as The Center to Protect Workers' Rights [CPWR], in analyzing lead exposures in the construction industry); and with OSHA. One of OSHA's National Emphasis Programs aims to reduce workplace lead exposure among all U.S. workers, and ABLES data are provided periodically to OSHA to help better target this program.
The findings in this report are subject to at least one limitation. The number of adults with elevated BLLs reported to ABLES likely is underreported because some employers might not provide BLL testing to all lead-exposed workers as required by OSHA regulations and because some laboratories might not report all tests as required by state regulations (10); these factors likely vary across the 38 participating ABLES states.
To further prevent workplace lead exposures and help move toward the Healthy People 2010 objective, the following efforts need to be strengthened, particularly in industries with higher exposures: 1) worker protection programs developed and maintained by employers¶¶; 2) government efforts, such as state ABLES programs, the OSHA National Emphasis Program to reduce lead exposure, and the NIOSH ABLES program; 3) research and interventions by worker-affiliated organizations, such as the Center for Construction Research and Training; and 4) education of the public to prevent nonoccupational exposures.
Acknowledgments
This report is based, in part, contributions by ABLES state coordinators and by J Li, Div of Surveillance, Hazard Evaluations, and Field Studies, National Institute for Occupational Safety and Health, CDC.
References
- MJ Kosnett, RP Wedeen, SJ Rothenberg, et al. Recommendations for medical management of adult lead exposure. Environ Health Perspect 2007;115:463--71.
- Association of Occupational and Environmental Clinics. Medical management guidelines for lead-exposed adults. 2007. Available at http://www.aoec.org/documents/positions/mmg_final.pdf.
- US Department of Health and Human Services. Occupational safety and health. Objective 20-7: Reduce the proportion of adults who have elevated blood lead concentrations. Healthy People 2010 midcourse review. Washington, DC: US Department of Health and Human Services; 2007: 20--18. Available at http://www.healthypeople.gov/data/midcourse/pdf/fa20.pdf.
- CDC. Adult blood lead epidemiology and surveillance---United States, 1998--2001. MMWR 2002;51(No. SS-11).
- CDC. Adult blood lead epidemiology and surveillance---United States, 2002. MMWR 2004;53:578--82.
- CDC. Adult blood lead epidemiology and surveillance---United States, 2003--2004. MMWR 2006;55:876--9.
- Tak S, Roscoe RJ, Alarcon W, et al. Characteristics of US workers whose blood lead levels trigger the medical removal protection provision, and conformity with biological monitoring requirements, 2003--2005. Am J Ind Med 2008;51:691--700.
- US Department of Labor, Occupational Safety and Health Administration. Final standard; occupational exposure to lead. Federal Register 1978;43:52952--3014.
- US Department of Labor, Occupational Safety and Health Administration. Lead exposure in construction-interim rule. Federal Register 1993;58:26590--26649.
- Whittaker SG. Lead exposure in radiator repair workers: a survey of Washington State radiator repair shops and review of occupational lead exposure registry data. J Occup Environ Med 2003;45:724--33.
* Information on reporting requirements by state is available at http://www.cdc.gov/niosh/topics/ables/state-contacts.html.
† Data extracted from http://www.bls.gov/data.
§ Information regarding interpretation of specific state ABLES data, definitions, and rate calculations is available at http://www.cdc.gov/niosh/topics/ables/ables.html.
¶ 38 states submitted data to ABLES in 2007: Alabama, Alaska, Arizona, California, Connecticut, Florida, Georgia, Illinois, Indiana, Iowa, Kansas, Kentucky, Louisiana, Maine, Maryland, Massachusetts, Michigan, Minnesota, Missouri, Montana, Nebraska, New Hampshire, New Jersey, New Mexico, New York, North Carolina, Ohio, Oklahoma, Oregon, Pennsylvania, Rhode Island, South Carolina, Tennessee, Texas, Utah, Washington, Wisconsin, and Wyoming. Tennessee data were not available for 2005. Louisiana data were not available for 2005 and 2006. Hawaii data were not available for 2007.
** States providing data on industry in 2007: Alaska, Arizona, California, Connecticut, Florida, Georgia, Illinois, Iowa, Kansas, Louisiana, Maine, Maryland, Massachusetts, Michigan, Minnesota, Missouri, Montana, Nebraska, New Hampshire, New Jersey, New Mexico, New York, North Carolina, Ohio, Oklahoma, Oregon, Pennsylvania, Rhode Island, South Carolina, Tennessee, Texas, Utah, Washington, Wisconsin, and Wyoming. Industry data were not available for Louisiana for 2005 and 2006, Rhode Island for 2005, and Tennessee for 2005. Hawaii data were not available for 2007.
†† Information available at http://www.cdc.gov/niosh/topics/ables/ables.html.
§§ Information available at http://www.osha.gov/pls/oshaweb/owadisp.show_document?p_table=directives&p_id=2572.
¶¶ Elements of worker protection programs should include 1) hazard determination, including exposure assessment; 2) engineering and work practice controls; 3) respiratory protection; 4) protective clothing and equipment; 5) housekeeping; 6) hygiene facilities and practices; 7) medical surveillance and provisions for medical removal; 8) training; 9) signs; and 10) recordkeeping. Additional information available at http://www.osha.gov/pls/oshaweb/owadisp.show_document?p_table=fact_sheets&p_id=161.
FIGURE 1. National prevalence rates* of adults with elevated blood lead levels (BLLs), by year - Adult Blood Lead Epidemiology and Surveillance program, United States, 1994--2007
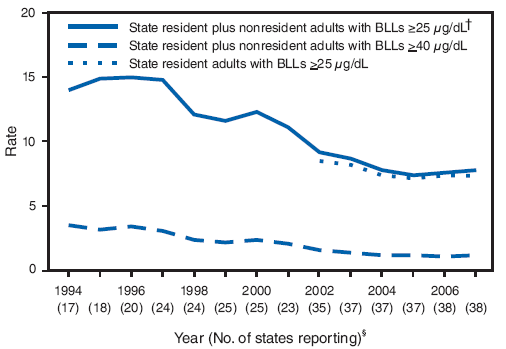
* Per 100,000 employed adults aged ≥16 years. Denominators for 2005-2007 extracted from 2008 U.S. Department of Labor, Bureau of labor Statistics Current Population Survey, available at http://www.bls.gov/data.
† State residents are adults residing in the reporting state. State residents plus nonresidents are all adults reported by a state.
§ 38 states submitted data in 2007: Alabama, Alaska, Arizona, California, Connecticut, Florida, Georgia, Illinois, Indiana, Iowa, Kansas, Kentucky, Louisiana, Maine, Maryland, Massachusetts, Michigan, Minnesota, Missouri, Montana, Nebraska, New Hampshire, New Jersey, New Mexico, New York, North Carolina, Ohio, Oklahoma, Oregon, Pennsylvania, Rhode Island, South Carolina, Tennessee, Texas, Utah, Washington, Wisconsin, and Wyoming. Tennessee data were not available for 2005. Louisiana data were not available for 2005 and 2006. Hawaii data were not available for 2007.
FIGURE 2. Annual state prevalence rate* categories for state resident adults† with elevated blood lead levels (≥25 µg/dL) - Adult Blood Lead Epidemiology and Surveillance (ABLES) program, United States, 2007§
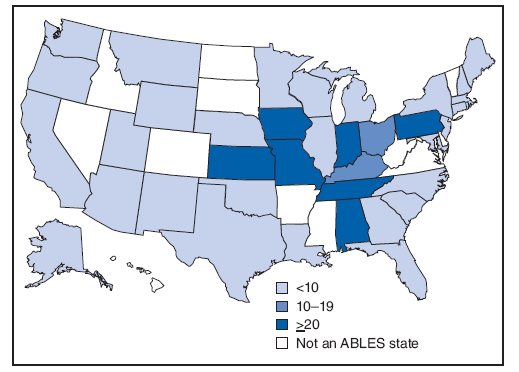
* Per 100,000 employed adults aged ≥16 years. Denominators for 2005--2007 extracted from 2008 U.S. Department of Labor, Bureau of labor Statistics Current Population Survey, available at http://www.bls.gov/data.
† State residents are adults residing in the reporting state.
§ 38 states submitted data in 2007: Alabama, Alaska, Arizona, California, Connecticut, Florida, Georgia, Illinois, Indiana, Iowa, Kansas, Kentucky, Louisiana, Maine, Maryland, Massachusetts, Michigan, Minnesota, Missouri, Montana, Nebraska, New Hampshire, New Jersey, New Mexico, New York, North Carolina, Ohio, Oklahoma, Oregon, Pennsylvania, Rhode Island, South Carolina, Tennessee, Texas, Utah, Washington, Wisconsin, and Wyoming. Tennessee data were not available for 2005. Louisiana data were not available for 2005 and 2006. Hawaii data were not available for 2007.
|
TABLE. Number and percentage of resident adults with elevated blood lead levels (BLLs), by industry subsector and nonoccupational source of exposure - Adult Blood Lead Epidemiology and Surveillance (ABLES) program, United States, 2005-2007 |
||||||||||||
|---|---|---|---|---|---|---|---|---|---|---|---|---|
|
2005 (33 states) |
2006 (35 states) |
2007 (34 states) |
||||||||||
|
BLLs ≥25 µg/dL |
BLLs ≥40 µg/dL |
BLLs ≥25 µg/dL |
BLLs ≥40 µg/dL |
BLLs ≥25 µg/dL |
BLLs ≥40 µg/dL |
|||||||
|
Exposure type |
No. |
(%)† |
No. |
(%)§ |
No. |
(%) |
No. |
(%) |
No. |
(%) |
No. |
(%) |
|
Occupational (Industry subsector [SIC and NAICS codes]*) |
||||||||||||
|
Manufacturing, storage batteries (SIC 3691, NAICS 335911) |
1,916 |
(32.7) |
90 |
(4.7) |
2,636 |
(39.7) |
179 |
(6.8) |
2,524 |
(39.1) |
207 |
(8.2) |
|
Metal mining, lead and zinc ores (SIC 1031, NAICS 212231) |
542 |
(9.2) |
71 |
(13.1) |
625 |
(9.4) |
109 |
(17.4) |
672 |
(10.4) |
127 |
(18.9) |
|
Construction, painting and paper Hanging (SIC 1721, NAICS 237310 part, 238320 part) |
527 |
(9.0) |
144 |
(27.3) |
495 |
(7.5) |
130 |
(26.3) |
399 |
(6.2) |
117 |
(29.3) |
|
Manufacturing, primary batteries (dry and wet) (SIC 3692, NAICS 335912) |
187 |
(3.2) |
22 |
(11.8) |
597 |
(9.0) |
92 |
(15.4) |
573 |
(8.9) |
126 |
(22.0) |
|
Manufacturing, secondary smelting and refining of nonferrous metals (SIC 3341, NAICS 331314 part, 331423 part, 331492 part) |
355 |
(6.1) |
51 |
(14.4) |
370 |
(5.6) |
37 |
(10.0) |
447 |
(6.9) |
60 |
(13.4) |
|
Manufacturing, primary smelting and refining of nonferrous metals (SIC 3339, NAICS 33419) |
134 |
(2.3) |
19 |
(14.2) |
129 |
(1.9) |
24 |
(18.6) |
128 |
(2.0) |
21 |
(16.4) |
|
Construction, special trade contractors NEC¶ (SIC 1799, various NAICS codes in construction and services) |
135 |
(2.3) |
34 |
(25.2) |
93 |
(1.4) |
23 |
(24.7) |
96 |
(1.5) |
20 |
(20.8) |
|
Manufacturing, copper foundries (SIC 3366, NAICS 331525) |
125 |
(2.1) |
16 |
(12.8) |
112 |
(1.7) |
18 |
(16.1) |
78 |
(1.2) |
11 |
(14.1) |
|
Construction, bridge, tunnel, and elevated highway construction (SIC 1622, NAICS 237310 part, 237990 part) |
67 |
(1.1) |
9 |
(13.4) |
87 |
(1.3) |
12 |
(13.8) |
34 |
(0.5) |
5 |
(14.7) |
|
Manufacturing, nonferrous foundries, except aluminum and copper (SIC 3369, NAICS 331528) |
60 |
(1.0) |
13 |
(21.7) |
53 |
(0.8) |
9 |
(17.0) |
75 |
(1.2) |
20 |
(26.7) |
|
Manufacturing, rolling, drawing, and extruding of nonferrous metals (SIC 3356, NAICS 331491) |
65 |
(1.1) |
3 |
(4.6) |
54 |
(0.8) |
7 |
(13.0) |
56 |
(0.9) |
14 |
(25.0) |
|
Services, automotive repair shops NEC (SIC 7539, NAICS 811118, 811198 part) |
79 |
(1.3) |
15 |
(19.0) |
41 |
(0.6) |
5 |
(12.2) |
50 |
(0.8) |
9 |
(18.0) |
|
Manufacturing, steel works, blast furnaces (including coke ovens), and rolling mills (SIC 3312, NAICS 331111 part, 331221 part) |
63 |
(1.1) |
6 |
(9.5) |
26 |
(0.4) |
2 |
(7.7) |
64 |
(1.0) |
5 |
(7.8) |
|
Other industries and unavailable information on industry** |
1,606 |
(27.4) |
302 |
(18.8) |
1,325 |
(19.9) |
207 |
(15.6) |
1,267 |
(19.6) |
215 |
(17.0) |
|
Total exposed at work |
5,861 |
(100.0) |
795 |
(13.6) |
6,643 |
(100.0) |
854 |
(12.9) |
6,463 |
(100.0) |
957 |
(14.8) |
|
Nonoccupational |
||||||||||||
|
Shooting firearms (target shooting) |
98 |
(29.7) |
25 |
(25.5) |
129 |
(33.9) |
29 |
(22.5) |
120 |
(34.3) |
19 |
(15.8) |
|
Remodeling/Renovation/Painting |
58 |
(17.6) |
15 |
(25.9) |
49 |
(12.9) |
9 |
(18.4) |
51 |
(14.6) |
15 |
(29.4) |
|
Retained bullets (gunshot wounds) |
17 |
(5.2) |
4 |
(23.5) |
30 |
(7.9) |
15 |
(50.0) |
35 |
(10.0) |
10 |
(28.6) |
|
Eating food containing lead |
21 |
(6.4) |
9 |
(42.9) |
29 |
(7.6) |
10 |
(34.5) |
21 |
(6.0) |
5 |
(23.8) |
|
Casting (e.g., bullets and fishing weights) |
14 |
(4.2) |
5 |
(35.7) |
13 |
(3.4) |
4 |
(30.8) |
20 |
(5.7) |
6 |
(30.0) |
|
Pica (i.e., the eating of nonfood items) |
21 |
(6.4) |
8 |
(38.1) |
15 |
(3.9) |
5 |
(33.3) |
10 |
(2.9) |
3 |
(30.0) |
|
Complementary and alternative medicines |
8 |
(2.4) |
7 |
(87.5) |
13 |
(3.4) |
9 |
(69.2) |
10 |
(2.9) |
6 |
(60.0) |
|
Retired†† |
11 |
(3.3) |
2 |
(18.2) |
3 |
(0.8) |
2 |
(66.7) |
8 |
(2.3) |
1 |
(12.5) |
|
Ceramics |
- |
- |
- |
- |
- |
- |
- |
- |
3 |
(0.9) |
2 |
(66.7) |
|
Stained glass |
3 |
(0.9) |
|
- |
- |
- |
- |
- |
- |
- |
- |
- |
|
Eating from leaded cookware |
3 |
(0.9) |
1 |
(33.3) |
- |
- |
- |
- |
- |
- |
- |
- |
|
Drinking liquids containing lead (e.g., moonshine) |
- |
- |
- |
- |
- |
- |
- |
- |
2 |
(0.6) |
1 |
(50.0) |
|
Other nonoccupational exposure |
3 |
(0.9) |
2 |
(66.7) |
3 |
(0.8) |
2 |
(66.7) |
6 |
(1.7) |
2 |
(33.3) |
|
Unavailable nonoccupational source of exposure |
73 |
(22.1) |
19 |
(26.0) |
96 |
(25.3) |
27 |
(28.1) |
64 |
(18.3) |
15 |
(23.4) |
|
Total exposed at places other than work |
330 |
(100.0) |
97 |
(29.4) |
380 |
(100.0) |
112 |
(29.5) |
350 |
(100.0) |
85 |
(24.3) |
|
* Standard Industry Classification and North American Industry Classification System. Correspondence tables between 2002 NAICS and 1987 SIC are available from the U.S. Census Bureau at http://www.census.gov/epcd/naics02/index.html. † Percentage of the total cases reported per year. § Percentage cases with elevated BLLs in each industry or nonoccupational exposure source. ¶ Not elsewhere classified. ** Information on industry was unavailable for 265 adults with BLLs ≥25 µg/dL and for three adults with BLLs ≥40 µg/dL in 2005; and in 88 adults with BLLs ≥25 µg/dL in 2006. †† These adults might have been former lead workers. Available data show that two adults (BLLs 32 µg/dL and 34 µg/dL) retired from a radiator repair shop, one retired from the police (BLL 39 µg/dL), and one retired from a tire manufacturing industry (BLL 37 µg/dL). |
||||||||||||
Use of trade names and commercial sources is for identification only and does not imply endorsement by the U.S. Department of
Health and Human Services. |
All MMWR HTML versions of articles are electronic conversions from typeset documents. This conversion might result in character translation or format errors in the HTML version. Users are referred to the electronic PDF version (http://www.cdc.gov/mmwr) and/or the original MMWR paper copy for printable versions of official text, figures, and tables. An original paper copy of this issue can be obtained from the Superintendent of Documents, U.S. Government Printing Office (GPO), Washington, DC 20402-9371; telephone: (202) 512-1800. Contact GPO for current prices.
**Questions or messages regarding errors in formatting should be addressed to mmwrq@cdc.gov.Date last reviewed: 4/15/2009