 |
|
|
|
|
|
|
| ||||||||||
|
|
|
|
|
|
|
||||
| ||||||||||
|
|
|
|
|
Persons using assistive technology might not be able to fully access information in this file. For assistance, please send e-mail to: mmwrq@cdc.gov. Type 508 Accommodation and the title of the report in the subject line of e-mail. Adult Blood Lead Epidemiology and Surveillance --- United States, 1998--2001Robert J. Roscoe, M.S.,1 Wayne Ball, Ph.D.,2 John J. Curran,3 Carol DeLaurier,4 Myron C. Falken, Ph.D.,5 Rose Fitchett, M.D.,6 Mary Lou Fleissner, Dr.P.H.,7 Amy E. Fletcher,8 Susan J. Garman, M.S.,9 Rita M. Gergely,10 Barbara T. Gerwel, M.D.,11 Judith E. Gostin, M.S.,12 Ezatollah Keyvan-Larijani, M.D.,13 Richard D. Leiker,14 J.P. Lofgren, M.D.,15 Deborah R. Nelson,16 Susan F. Payne, M.A.,17 Richard A. Rabin, M.S.P.H.,18 Diana L. Salzman, M.P.H.,19 Kristina E. Schaller,20 Amy S. Sims,21 Joshua D. Smith,22 Edward M. Socie, M.S.,23 Marie Stoeckel, M.P.H.,24 Robert R. Stone, Ph.D.,25 and Stephen G. Whittaker, Ph.D.,26 1Division of Surveillance, Hazard Evaluations, and Field Studies, National Institute for Occupational Safety and Health, CDC, Cincinnati, Ohio; 2Utah Department of Health, Salt Lake City, Utah; 3North Carolina Department of Health and Human Services, Raleigh, North Carolina; 4New Hampshire Department of Health and Human Services, Concord, New Hampshire; 5Minnesota Department of Health, St. Paul, Minnesota; 6South Carolina Department of Health and Environmental Control, Columbia, South Carolina; 7Connecticut Department of Public Health, Hartford, Connecticut; 8Oklahoma State Department of Health, Oklahoma City, Oklahoma; 9Wisconsin Department of Health and Family Services, Madison, Wisconsin; 10Iowa Department of Public Health, Des Moines, Iowa; 11New Jersey State Department of Health and Senior Services, Trenton, New Jersey; 12Pennsylvania Department of Health, Harrisburg, Pennsylvania; 13Maryland Department of the Environment, Baltimore, Maryland; 14Oregon Department of Human Services, Portland, Oregon; 15Alabama Department of Public Health, Montgomery, Alabama; 16Wyoming Department of Health, Cheyenne, Wyoming; 17California Department of Health Services, Oakland, California; 18Massachusetts Department of Labor and Workforce Development, Newton, Massachusetts; 19Texas Department of Health, Austin, Texas; 20Arizona Department of Health Services, Phoenix, Arizona; 21Michigan State University, East Lansing, Michigan; 22Nebraska Health and Human Services System, Lincoln, Nebraska; 23Ohio Department of Health, Columbus, Ohio; 24Rhode Island Department of Health, Providence, Rhode Island; 25New York State Department of Health, Troy, New York; 26Washington State Department of Labor and Industries, Olympia, Washington Abstract Problem/Condition: Elevated blood lead levels (BLLs) in adults can damage the cardiovascular, central nervous, reproductive, hematologic, and renal systems. The majority of cases are workplace-related. U.S. Department of Health and Human Services recommends that BLLs among all adults be reduced to <25 µg/dL. The highest BLL acceptable by standards of the U.S. Occupational Safety and Health Administration is 40 µg/dL. The mean BLL of adults in the United States is <3 µg/dL. Reporting Period: This report covers cases of adults (aged >16 years) with BLLs >25 µg/dL, as reported by 25 states during 1998--2001. Description of System: Since 1987, CDC has sponsored the state-based Adult Blood Lead Epidemiology and Surveillance (ABLES) program to track cases of elevated BLLs and provide intervention consultation and other assistance. Overall ABLES program data were last published in 1999 for the years 1994--1997. This report provides an update with data from 25 states reporting for >2 years during 1998--2001. During that period, the ABLES program funded surveillance in 21 states --- Alabama, Arizona, Connecticut, Iowa, Maryland, Massachusetts, Michigan, Minnesota, New Jersey, New York, North Carolina, Ohio, Oklahoma, Oregon, Pennsylvania, Rhode Island, South Carolina, Texas, Washington, Wisconsin, and Wyoming. Four additional states --- California, Nebraska, New Hampshire, and Utah --- contributed data without CDC funding. Results: During 1998--2001, the overall program's annual mean state prevalence rate for adults with BLLs >25 µg/dL was 13.4/100,000 employed adults. This compares with 15.2/100,000 for 1994--1997. Yearly rates were 13.8 (1998), 12.9 (1999), 14.3 (2000), and 12.5 (2001). For adults with BLLs >40 µg/dL, the overall program's annual mean state prevalence rate during 1998--2001 was 2.9/100,000 employed adults. This compares with 3.9/100,000 for 1994--1997. Yearly rates were 3.3 (1998), 2.5 (1999), 2.9 (2000), and 2.8 (2001). Interpretation: Although certain limitations exist, the overall ABLES data indicate a declining trend in elevated BLLs among employed adults. Public Health Actions: ABLES-funded states increased from 21 to 35 in 2002, and more detailed reporting requirements were put into effect. These, and other improvements, will enable the ABLES program to work more effectively toward its 2010 target of eliminating all cases of BLLs >25 µg/dL in adults caused by workplace exposures. IntroductionInorganic LeadInorganic lead is a bluish gray metal valued since ancient times because of its useful properties (e.g., low melting point, pliability, and resistance to corrosion). The ancient Romans and Greeks first discovered its toxic effects. Lead is ubiquitous in U.S. urban environments because of the widespread use of lead compounds in industry, gasoline, and paints during the 1900s (1--3). Adult Lead ExposureAdult exposure to inorganic lead occurs when dust and fumes are inhaled and when lead from lead-contaminated hands, food, water, cigarettes, and clothing is ingested. Lead absorbed through the respiratory and digestive systems is released into the blood, which distributes the lead throughout the body. Approximately 90% of total body lead content is accumulated in the bones, where it is stored for decades. Lead in bones continues to be released gradually back into the body after the external environmental exposure occurs (1--3). Health Effects of Adult Lead ExposureThe adverse health effects of elevated exposure to lead among adults include damage to the cardiovascular, central nervous, reproductive, hematologic, and renal systems (1--3). Studies have reported that adults with blood lead levels (BLLs) of 25--60 µg/dL can exhibit nonspecific symptoms, including irritability, fatigue, headache, sleep disturbance, decreased libido, and depressed mood (4). Studies have also reported adverse health effects, including hypertension, subtle or subclinical central nervous system deficits, and adverse reproductive outcomes among adults exposed to lead at concentrations below the existing regulatory exposure limits of 40 µg/dL (5--9). Although the significance of these subclinical effects on long-term health continues to be studied, the U.S. Department of Health and Human Services (DHHS) recommends that BLLs be reduced to <25 µg/dL among all adults as a preventive health measure (10,11). Lead readily crosses the placenta. The source of lead exposure for a fetus might be the mother's recent exposure to lead or mobilization of lead into the blood during pregnancy from bone stores because of past exposure. The American Conference of Governmental Industrial Hygienists (ACGIH) advises women of child-bearing age, if their BLL is >10 µg/dL, they are at risk for delivering a child with a BLL >10 µg/dL (12) --- the level of concern in CDC's pediatric guidelines. Sources of Adult Lead ExposuresData reported to the Adult Blood Lead Epidemiology and Surveillance Program (ABLES), suggest >90% of elevated BLL cases among adults result from workplace exposure (13,14). National Health and Nutrition Examination Survey data indicate that by 1991--1994, the geometric mean BLL of U.S. adults had dropped to 2.1, 3.1, and 3.4 µg/dL for persons aged 20--49, 50--69, and >70 years, respectively (15). This compares with a geometric mean of 13.1 µg/dL for persons aged 20--74 years for the period 1976--1980 (16). Although the mean BLL of the entire U.S. population is relatively low, adult workers continue to be exposed to high concentrations of lead in >100 industries, including battery manufacturing, painting, nonferrous smelting, radiator repair, brass and bronze foundries, pottery production, scrap metal recycling, firing ranges, and wrecking and demolition (11). Elevated BLLs among adults can also be caused by exposure to nonoccupational (i.e., ambient or environmental) sources of lead (e.g., recreational target shooting, home remodeling, casting bullets and fishing weights, making stained glass and ceramics, cookware, pica behavior [ingestion of nonfood items], traditional remedies, drinking homemade alcoholic brews, and retaining bullets in or near a synovial joint). When occupational exposure is not proven or seems unlikely, clinicians should investigate these factors as potential cases of elevated BLLs (11). Adult Blood Lead Epidemiology and Surveillance ProgramSince 1987, CDC's National Institute for Occupational Safety and Health (NIOSH) has sponsored ABLES, a state-based program that tracks laboratory-reported BLLs among adults, and teams with other agencies to intervene and help prevent further high-level lead exposures. For states that report to ABLES, the primary sources of BLL reports are public and private laboratories; secondary sources are physicians. ABLES requires that laboratory reporting to the state health department (or other designee) of BLL results, both occupational and nonoccupational, be mandatory under state law. Laboratory reports include basic demographic information with unique identifiers to differentiate between new and ongoing cases and to account for multiple reports regarding the same person. Those reporting are also urged to include information regarding occupations and industries, lead-related avocations, and whether the laboratory is approved for occupational lead testing by the Occupational Safety and Health Administration (OSHA). The minimum BLL reporting requirement varies from state to state. Moreover, reporting of all BLLs is encouraged, because these data are useful for analyzing exposure trends and for providing the basis for future ABLES consultation and education on intervention strategies. The public health objective of the ABLES program, as stated in Healthy People 2010, is to reduce the number of persons with BLLs >25 µg/dL from work exposures; the target is to reduce that number to zero by 2010 (10). In collaboration with the ABLES program, the Council of State and Territorial Epidemiologists (CSTE) has adopted a surveillance case definition: an adult (aged >16 years) with a venous (or comparable) BLL >25 µg/dL of whole blood (17). The ABLES program seeks to accomplish its objective by continuing to improve its surveillance programs and helping state health and other agencies to effectively intervene to prevent further lead exposures. Intervention strategies implemented by ABLES-reporting states include conducting follow-up interviews with physicians, employers, and workers; investigating work sites; delivering technical assistance regarding exposure reduction or prevention; providing referrals for consultation and enforcement; and developing and disseminating educational materials and outreach programs. The educational materials developed by ABLES-reporting states are listed on, or linked to, the ABLES website.* The ABLES program is a complete surveillance program that entails not only enumerating adults with elevated BLLs, but also analyzing and reporting data, helping appropriate agencies intervene to prevent further exposures, and testing the effectiveness of those interventions. State and federal ABLES participants and partners have published analyses of their intervention activities (18--22), surveillance data, and investigations (13,14,23--27). To coordinate their reporting and intervention activities for maximum efficiency, state ABLES programs are strongly encouraged to develop effective working relationships with the childhood lead prevention programs in their states. An estimated 2%--3% of children with BLL >10 µg/dL reach those levels from exposure to lead brought home from the workplace on the clothes or in the vehicles of their adult caregivers (23). State ABLES programs are also encouraged to develop effective working relationships with other federal and state agencies involved in preventing adult lead poisoning (e.g., OSHA, U.S. Department of Housing and Urban Development, U.S. Environmental Protection Agency, U.S. Department of Transportation, and U.S. Department of Defense). Overall ABLES program data were last published in the MMWR in 1999 for 1994--1997 (28). This report provides data for 1998--2001. This will be the last report for ABLES data collected under the old aggregate format. Increased data requirements that took effect in 2002 will track adult BLLs by age, sex, and industry. MethodsBiological IndicesThe best method for monitoring exposure to lead is measuring BLLs in whole blood, although other biological indices exist. As the BLL increases, the frequency and severity of symptoms associated with lead exposure also increase (albeit with considerable variability). With other indices of lead exposure, no such specific relationship with symptoms has been established (1--3). Furthermore, BLL is responsive to recent exposures --- the cases most amenable to preventive intervention. Among other indices, measurement of protoporphyrin (free or zinc protoporphyrin) concentration in red blood cells can be an accurate indicator of inhibition of heme synthesis by lead. However, other causes of elevated protoporphyrin levels exist (e.g., iron-deficiency anemia and inflammatory conditions) (29). Lead concentrations can be measured in urine, teeth, and hair, but these measurements are not as reliable as BLLs. An experimental technique, radiographic fluorescence, provides a more accurate method for determining long-term, cumulative lead exposure and the total body burden of lead (7), but only a limited number of research facilities in the United States and Canada provide bone lead measurements. Testing RequirementsPermissible exposure limits for lead in the workplace and worker monitoring are regulated by OSHA standards, which differ slightly for general industry† (30) and the construction industry§ (31). A detailed comparison of the standards has been published elsewhere (32). When airborne lead concentrations exceed the action level of 30 µg/m3, OSHA requires medical surveillance, which includes biologic monitoring of BLLs by an OSHA-approved laboratory. Under the OSHA general industry standard, workers must be removed from substantial lead exposure when their BLLs are >60 µg/dL or when they averaged >50 µg/dL during the previous six months, or when workers have detected medical conditions that place them at increased risk for material impairment to health from lead exposure. After workers have been medically removed, they may return to work when their BLLs fall to 40 µg/dL. Thus, 40 µg/dL can be construed as the highest BLL deemed acceptable under OSHA lead standards. Surveillance ReportingIn this report, ABLES prevalence is reported according to two benchmarks: BLLs >25 µg/dL, the limit set by Healthy People 2010 in its public health objective (10); and >40 µg/dL, the limit at which OSHA will permit a worker to return to work after being medically removed. To enable year-to-year and state-to-state comparisons of ABLES data, adjustments were made to account for the changing number and roster of states, and to control for their different populations. Prevalence rates were established by expressing cases of BLLs >25 and >40 µg/dL for each reporting state as annual rates per 100,000 persons employed (aged >16 years). State employment data were obtained from the Bureau of Labor Statistics, Current Population Survey ¶ (33). ResultsThe data reported here are for the 25 state ABLES programs reporting for >2 years during 1998--2001 (Figure 1). These data can differ slightly from previous ABLES reports that included states no longer reporting (states that stopped reporting and the years they did report: Maine 1994--1998, Illinois 1994--1996, New Mexico 1997, and Vermont 1994 and 1997). For 1998--2001, a total of 25 ABLES states reported 41,984 adults with BLLs >25 µg/dL and 8,265 adults with BLLs >40 µg/dL. The yearly totals for BLLs >25 µg/dL were 10,459 (1998) with 24 of 25 states reporting; 10,310 (1999) with 25 states reporting; 11,272 (2000) with 25 states reporting; and 9,943 (2001) with 23 of 25 states reporting (Table 1). The yearly totals for BLLS >40 µg/dL were 2,071 (1998); 1,933 (1999); 2,252 (2000); and 2,009 (2001) (Table 2). More populous ABLES states reported more cases (Tables 1 and 2). To illustrate the degree of variance among states, mean annual percentages by state are presented for adults with BLLs >25 µg/dL for 1998--2001 (Figure 2). These percentages were derived by 1) calculating the mean number of annual cases for each state during 1998--2001; 2) adding those means; and 3) calculating the percentage of this sum of means for each state. On average, Pennsylvania, Ohio, California, and New York --- when combined --- reported 50% of the adult cases with BLLs >25 µg/dL, whereas Arizona, Oklahoma, South Carolina, Utah, and Wyoming reported <1% each (Figure 2). Using the same method for cases with BLLs >40 µg/dL, on average, the same four populous states, plus North Carolina, combined to report 55% of the cases, whereas Arizona, Nebraska, Oklahoma, Utah, and Wyoming reported, on average, <1% each (Figure 3). Year-to-year comparisons were enabled by expressing cases of BLLs >25 and >40 µg/dL for each reporting state as annual rates per 100,000 persons employed (aged >16 years). Mean annual state rates for the overall ABLES program were then calculated for each year during 1998--2001 (Figure 4). State-to-state comparisons of 1998-2001 data were made in a similar fashion. The 25 ABLES states are displayed in order of their 4-year mean annual rates for adults with BLLs >25 µg/dL (Figure 5). The overall mean for the 25 states for 1998-2001 was 13.4/100,000 employed. ABLES states are also displayed in order of their 4-year mean annual rates for adults with BLLs >40 µg/dL (Figure 6). The overall mean for the 25 states for 1998-2001 was 2.9/100,000. To make state-to-state comparisons of 1998--2001 data with 1994--1997 data, only 20 of the 25 ABLES states --- those that reported for >2 years during both 4-year periods --- were used (Figures 7 and 8). The mean annual rates for each state were then calculated, as well as the mean annual rates for the program overall, during each 4-year period. For adults with BLLs >25 µg/dL, 17 of 20 states reported lower rates for 1998--2001, compared with 1994--1997 (only Alabama, North Carolina and Maryland reported higher rates). For the ABLES program overall, the mean annual rates were 15.2/100,000 for 1994--1997 compared with 13.4/100,000 for 1998--2001 (Figure 7). Using the same method for adults with BLLs >40 µg/dL, 16 of 20 states reported lower rates for 1998--2001, compared with 1994-1997 (only Alabama, North Carolina, and Pennsylvania reported higher rates; Maryland's rate did not change). For the program overall, the mean annual rates for adults with BLLs >40 µg/dL were 3.9/100,000 for 1994--1997 and 2.9/100,000 for 1998--2001 (Figure 8). To better illustrate the decline in BLL rates, the mean annual rates for the overall program are presented for the years 1994--1997 (Figure 9). From 1998 onward, with the exception of 2000, the rates for adults with BLLs >25 µg/dL decreased to <14/100,000. Likewise, the rates for adults with BLLs >40 µg/dL decreased to <3/100,000. CDC/NIOSH funding has enabled surveillance and intervention activities among ABLES states that have contributed to the decline in adult BLLs. NIOSH increased its funding commitment, allowing the ABLES program to expand from 21 to 35 funded states for 2002 (Figure 10). Four of these additional 14 states were already providing data to ABLES (California, Nebraska, New Hampshire, and Utah); three resumed reporting (Illinois, Maine, and New Mexico); and seven were completely new (Florida, Georgia, Hawaii, Kansas, Kentucky, Missouri, and Montana). DiscussionThis data analysis has certain limitations, including the numerators and denominators used in calculating the prevalence rates. The numerators are the numbers of adults with BLLs >25 or >40 µg/dL, as reported by the ABLES states. These numbers are likely underreported because 1) not all employers provide BLL testing to lead-exposed workers; and 2) to a lesser extent, certain laboratories might not be in compliance with reporting requirements. Additionally, certain states with workers at risk do not participate. The denominators are the numbers of persons, aged >16 years, who were employed in the state during the year in question. An advantage of using the employed population as the denominator is that it excludes unemployed adults who have limited risk for lead exposure. A disadvantage of using the employed population is that the numbers include those whose jobs do not involve lead exposures. State-to-state comparisons have been made in this report by using the data reported from the states to the ABLES program. Questions regarding the specifics of any state's reporting should be addressed to the ABLES contact from that state (state contacts are available at the ABLES website). Certain states publish in-depth analyses of their surveillance data, and these analyses provide the most complete descriptions (13--14,25--26). The decline in BLL rates observed in this analysis depends on continued, effective intervention and prevention efforts by ABLES program participants and their partners. For example,
CDC/NIOSH continues to take steps to improve the ABLES program. In addition to expanding the program from 21 to 35 states, NIOSH stipulated that future ABLES data would be collected on an individual rather than aggregate basis. These individual data, providing information specific to occupation, industry, sex, and age, will be more useful to the efforts to reduce BLLs. With NIOSH assistance, persons from certain ABLES states are also developing clinical/laboratory guidelines that will help improve identification of lead exposure and treatment by medical personnel of this often unrecognized and misunderstood public health problem (11). At the same time, CDC is working to implement greater standardization and efficiency for all its surveillance programs, including ABLES, under the National Electronic Disease Surveillance System.** Other partners in the effort to reduce BLLs include the following:
Despite limitations and variations within the ABLES program, data indicate a declining trend in the number of adults with elevated BLLs. Because the program has increased in size and with the addition of more detailed reporting requirements, ABLES has increased its capability to offer data, intervention insights, and other assistance as it works toward its Healthy People 2010 target of eliminating work-related BLLs >25 µg/dL among all adults by 2010 (10). Acknowledgments The authors acknowledge the persons at CDC/NIOSH who founded and developed the ABLES program: Paul J. Seligman, M.D., Janie L. Gittleman, Ph.D., John P. Sestito, J.D., William E. Halperin, M.D., Lawrence J. Fine, M.D., Jefferson P. Rowland, M.S., and Vannetta Gibert. We also express our gratitude to all state ABLES personnel who have contributed their efforts over the years. References
† 29 CFR 1910.1025. § 29 CFR 1926.62. ¶ Available at http://www.bls.gov/lau/staa_7000.pdf. ** Available at http://www.cdc.gov/programs/research12.htm. †† Available at http://www.osha-slc.gov/SLTC/lead/index.html. §§ Available at http://www.cpwr.com. Table 1 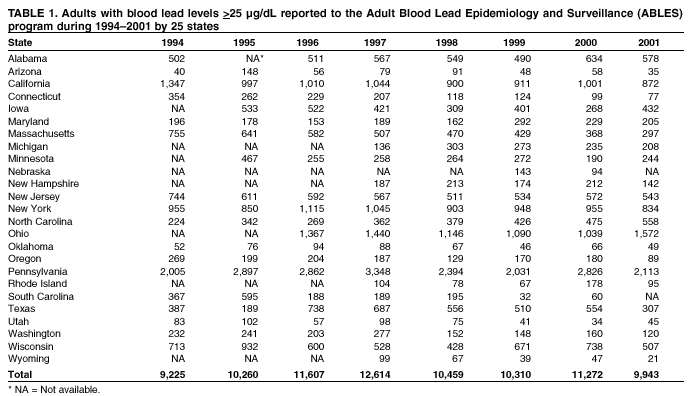 Return to top. Figure 1 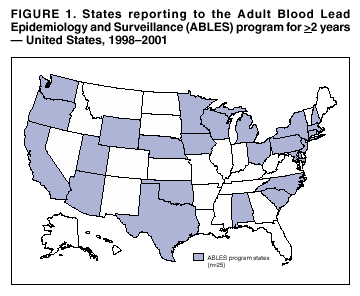 Return to top. Table 2 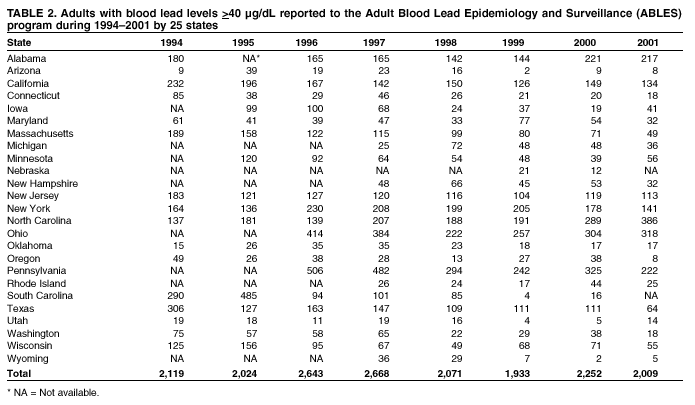 Return to top. Figure 2 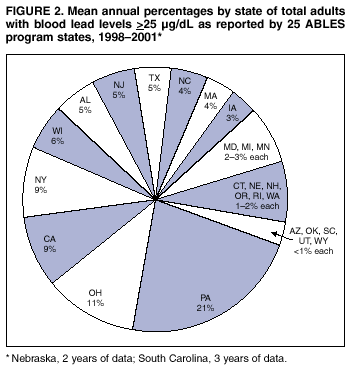 Return to top. Figure 3 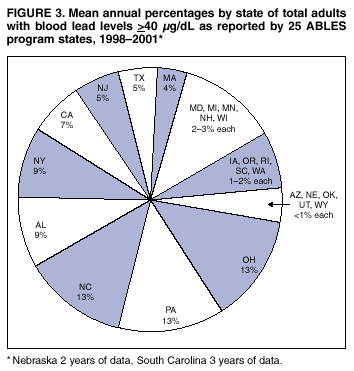 Return to top. Figure 4 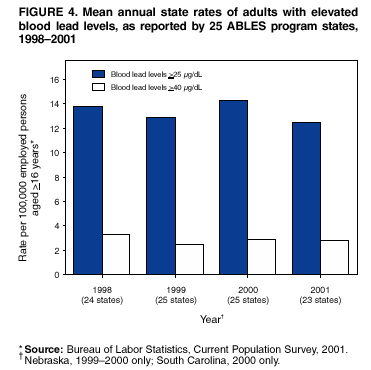 Return to top. Figure 5 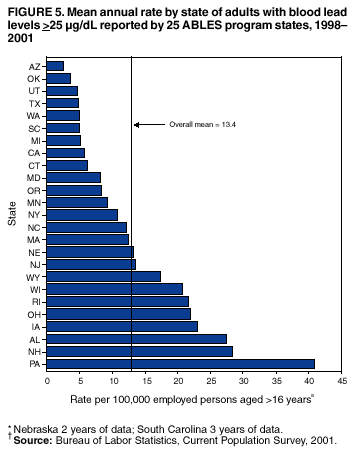 Return to top. Figure 6 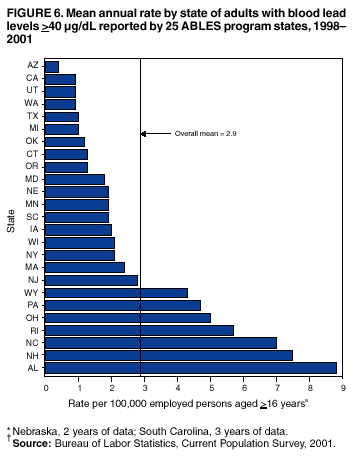 Return to top. Figure 7 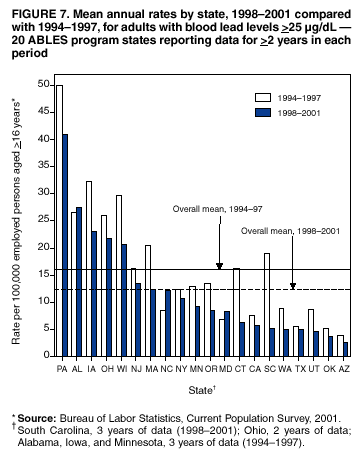 Return to top. Figure 8 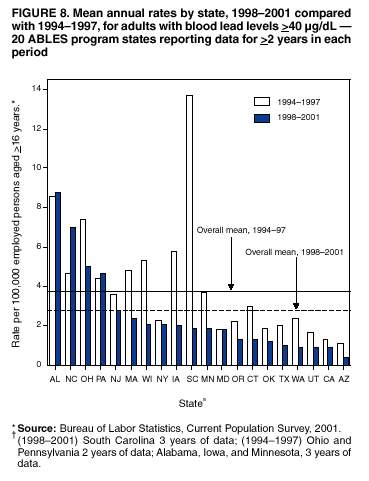 Return to top. Figure 9 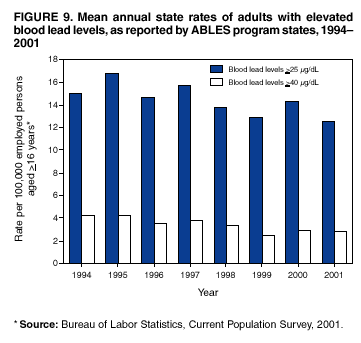 Return to top. Figure 10 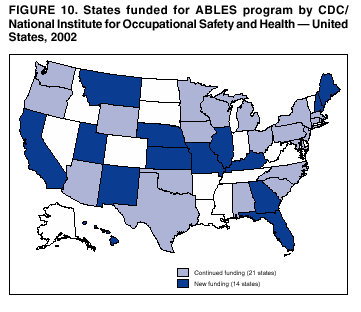 Return to top.
Disclaimer All MMWR HTML versions of articles are electronic conversions from ASCII text into HTML. This conversion may have resulted in character translation or format errors in the HTML version. Users should not rely on this HTML document, but are referred to the electronic PDF version and/or the original MMWR paper copy for the official text, figures, and tables. An original paper copy of this issue can be obtained from the Superintendent of Documents, U.S. Government Printing Office (GPO), Washington, DC 20402-9371; telephone: (202) 512-1800. Contact GPO for current prices. **Questions or messages regarding errors in formatting should be addressed to mmwrq@cdc.gov.Page converted: 12/2/2002 |
|||||||||
This page last reviewed 12/2/2002
|