 |
|
|
|
|
|
|
| ||||||||||
|
|
|
|
|
|
|
||||
| ||||||||||
|
|
|
|
|
Persons using assistive technology might not be able to fully access information in this file. For assistance, please send e-mail to: mmwrq@cdc.gov. Type 508 Accommodation and the title of the report in the subject line of e-mail. Adult Participation in Recommended Levels of Physical Activity --- United States, 2001 and 2003Physical activity is associated with a range of health benefits, and its absence can have harmful effects on health and well being, increasing the risk for coronary heart disease, diabetes, certain cancers, obesity, and hypertension (1). CDC and the American College of Sports Medicine recommend that adults engage in at least 30 minutes of moderate-intensity physical activity on most days, preferably all days, to have a beneficial effect on their health (2). Two Healthy People 2010 objectives (objectives 22-1 and 22-2) are to increase the proportion of adults who engage in regular moderate or vigorous activity to at least 50% and to decrease the proportion of adults who engage in no leisure-time physical activity to 20% (3). To examine differences from 2001 to 2003 in overall U.S. and state- and territory-specific prevalence estimates of 1) adult participation in the minimum recommended level of physical activity and 2) physical inactivity among adults during lifestyle activities, CDC analyzed data from the Behavioral Risk Factor Surveillance System (BRFSS) surveys for 2001 and 2003. The findings indicated that more than half of U.S. adults continue not to participate in physical activity at a level recommended as beneficial to health. Concerted public health efforts at federal, state, and local levels are needed to improve participation in physical activity. BRFSS is a population-based, random-digit--dialed telephone survey of the U.S. civilian, noninstitutionalized population aged >18 years in 50 states, the District of Columbia, and certain U.S. territories (Guam, Puerto Rico, and the U.S. Virgin Islands). For this study, CDC analyzed data from BRFSS surveys for 2001 (214,500 respondents; median response rate: 51.1%; range: 33.3%--81.5%) and 2003 (264,684 respondents; median response rate: 53.2%; range: 34.4%--80.5%). Since 2001, BRFSS has used six survey questions about physical activity in three domains (household work, transportation, and discretionary/leisure time) to quantify its frequency, duration, and intensity. These questions are asked in all states once every 2 years. Respondents are asked to provide information on overall frequency and duration of time spent in bouts of 10 minutes or more of physical activity of moderate intensity (e.g., brisk walking or gardening) and vigorous intensity (e.g., heavy yard work, running, or aerobics) during a usual week. Moderate-intensity activity is described to respondents as any activity "that causes small increases in breathing and heart rate," and vigorous-intensity activity is described as any activity "that causes large increases in breathing or heart rate." Respondents are classified as active at the minimum recommended level if they report moderate-intensity activity at least 30 minutes per day, 5 or more days per week, or vigorous-intensity activity at least 20 minutes per day, 3 or more days per week. Respondents are classified as inactive if they report no activity of 10 minutes or more per week of moderate or vigorous intensity. For this analysis, prevalence estimates were age-adjusted to the 2000 U.S. standard population. Pairwise comparisons for changes in prevalence from 2001 to 2003 were performed for each state and territory to calculate t-statistics. Differences were considered statistically significant at p<0.05. Statistical analysis software was used to account for the complex sampling design. From 2001 to 2003, the age-adjusted prevalence of adults participating in physical activity at the minimum recommended level remained similar (45.3% in 2001 and 45.9% in 2003) (Table 1). Although an increase in prevalence of physical activity was observed in 41 states and territories from 2001 to 2003, the increase was significant only in nine states (Table 1). The prevalence of such activity decreased in 12 states and territories; the decrease was significant in Florida (45.5% in 2001 versus 41.7% in 2003), North Carolina (42.3% versus 37.6%), West Virginia (48.4% versus 43.6%), and Puerto Rico (43.5% versus 34.5%) (Table 1). Nebraska had the largest percentage-point increase in the prevalence of recommended level of physical activity (+10.3%); Puerto Rico had the largest percentage-point decrease (-9.1%) (Table 1). In 2003, the prevalence of physical activity in 22 states and the District of Columbia was equal to or greater than the target (50%) for the national health objective to increase the prevalence of regular moderate- or vigorous-intensity physical activity (Table 1 and Figure) (3). In 2001 and 2003, the overall prevalence of lifestyle inactivity (i.e., no activity of at least 10 minutes per week of moderate or vigorous intensity) was similar (16.0% in 2001 versus 15.6% in 2003) (Table 2). A decrease in prevalence of lifestyle inactivity was observed in 32 states and territories (percentage-point change ranging from 0.1% in Arkansas, North Dakota, and Oregon to 12.9% in Nebraska); the decrease was significant in 14 states (Table 2). An increase in prevalence of inactivity was observed in 19 states and territories; these increases were significant in North Carolina (16.9% in 2001 versus 22.5% in 2003), Washington (6.3% versus 9.9%), West Virginia (14.9% versus 17.4%), Wyoming (8.6% versus 10.6%), and Puerto Rico (24.1% versus 33.9%) (Table 2). Inactivity in 2003 ranged from 7.7% (Minnesota) to 33.9% (Puerto Rico). Reported by: S Sapkota, MBBS, MPH, HR Bowles, MS, SA Ham, MS, HW Kohl III, PhD, Div of Nutrition and Physical Activity, National Center for Chronic Disease Prevention and Health Promotion, CDC. Editorial Note:The findings in this report indicate that, in 2003, the majority (54.1%) of U.S. adults did not engage in physical activity at the minimum recommended level and that the prevalence of meeting recommend levels of physical activity was similar in 2001 and 2003 (45.3% and 45.9%, respectively). From 2001 to 2003, the prevalence of adults participating in recommended levels of physical activity increased significantly in nine states and decreased significantly in three states and Puerto Rico. The remainder of the states had no statistically significant differences. In addition, the prevalence of lifestyle physical inactivity was similar for the two years (16.0% in 2001 versus 15.6% in 2003). Although 2 years is a relatively short period for which to examine state- and territory-specific trends in prevalence of physical activity, this study is valuable as the first national report using 2 years of data to determine whether U.S. adults engaged in the recommended levels of physical activity in any of three domains: household work, transportation, and discretionary/leisure time. Earlier reports examined trends in one domain only (discretionary/leisure time) (4--6). The findings in this report are subject to at least three limitations. First, BRFSS data are based on self-reports and thus are subject to social desirability and recall biases. Second, the survey misclassifies a small proportion of the sample because the instrument is designed to measure only those who meet the recommendation in one of two intensities, moderate or vigorous, and misses those who would be deemed adequately active when the intensities were combined (e.g., being moderately active 3 days a week and vigorously active 2 days a week). Finally, the response rates were low in 2001 (51.1%) and 2003 (53.2%), indicating possible nonresponse bias. Promotion of physical activity is integral to national health promotion policies. Physical activity levels can be increased by incorporating physical activity into daily routines, such as being active in housework, walking and biking for transportation, participating in worksite physical activity programs, and pursuing physically active hobbies and recreational activities. The Guide to Community Preventive Services: Physical Activity highlights recommended evidence-based strategies for successful physical activity promotion in these settings (7). CDC coordinates multiple programs at state and local levels, including Steps to a HealthierUS, that aim to prevent or control obesity, diabetes, and cardiovascular disease; physical activity is an important component of such programs. Public health agencies should continue to increase and promote opportunities for physical activity among adults in communities and workplaces. References
Figure 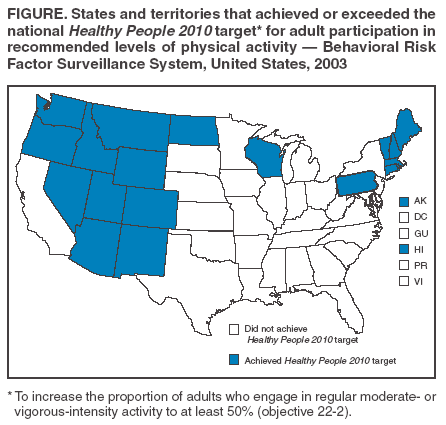 Return to top. Table 1  Return to top. Table 2 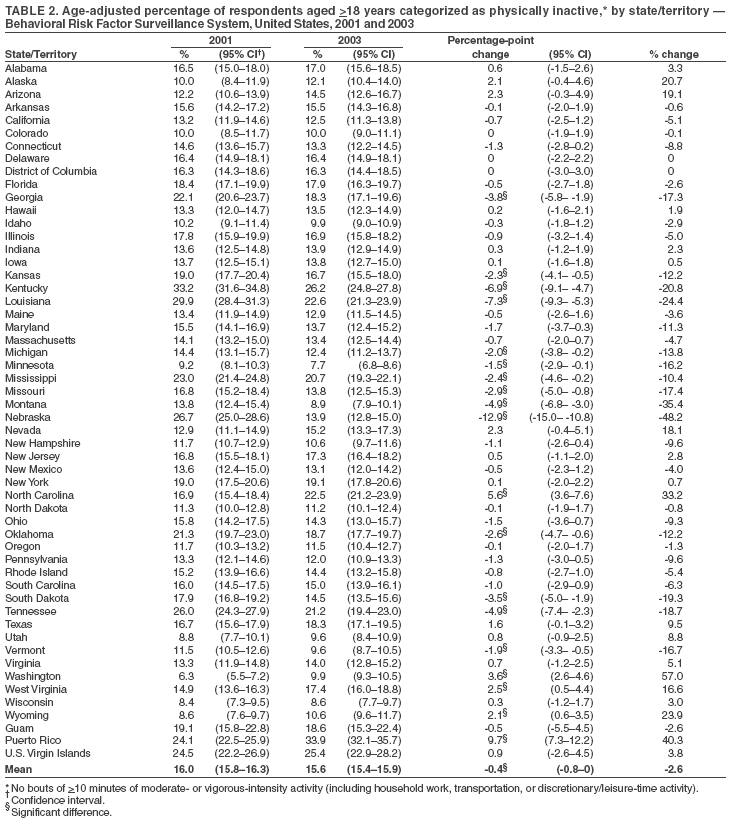 Return to top.
Disclaimer All MMWR HTML versions of articles are electronic conversions from ASCII text into HTML. This conversion may have resulted in character translation or format errors in the HTML version. Users should not rely on this HTML document, but are referred to the electronic PDF version and/or the original MMWR paper copy for the official text, figures, and tables. An original paper copy of this issue can be obtained from the Superintendent of Documents, U.S. Government Printing Office (GPO), Washington, DC 20402-9371; telephone: (202) 512-1800. Contact GPO for current prices. **Questions or messages regarding errors in formatting should be addressed to mmwrq@cdc.gov.Date last reviewed: 12/1/2005 |
|||||||||
|