|
|
|
|
|
|
|
| ||||||||||
|
|
|
|
|
|
|
||||
| ||||||||||
|
|
|
|
|
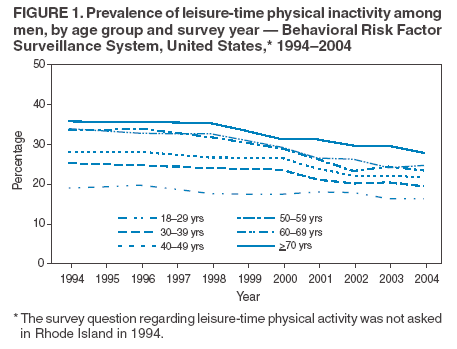
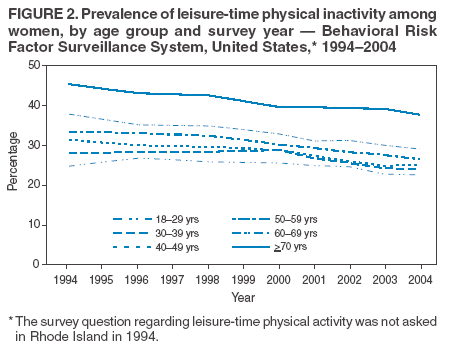
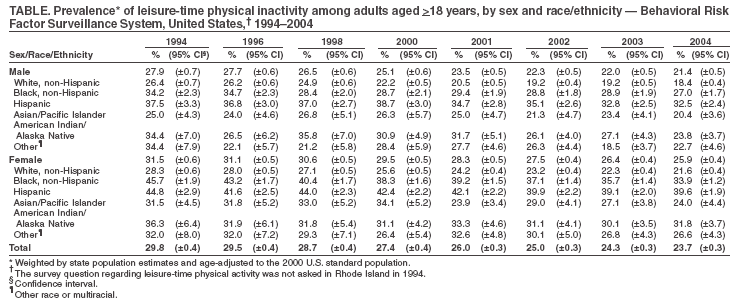
Persons using assistive technology might not be able to fully access information in this file. For assistance, please send e-mail to: mmwrq@cdc.gov. Type 508 Accommodation and the title of the report in the subject line of e-mail. Trends in Leisure-Time Physical Inactivity by Age, Sex, and Race/Ethnicity --- United States, 1994--2004Physical inactivity is associated with increased risk for certain chronic diseases, including cardiovascular disease, diabetes, and osteoporosis (1). Despite the benefits of physical activity, more than half of adults in the United States are not regularly active at the recommended levels (2). Trends in the proportion of adults who achieve the recommended levels of leisure-time physical activity have remained relatively stable over time (3,4). However, the proportion of adults from 35 states and the District of Columbia who reported that they did not engage in any leisure-time physical activity declined from 1996 to 2002 (5). To further examine trends in no leisure-time physical activity by population subgroup, CDC analyzed data from the Behavioral Risk Factor Surveillance System (BRFSS) for the period 1994--2004. This report is the first analysis of BRFSS physical-inactivity trends that includes all 50 states and the District of Columbia (DC). State and local health departments should continue to create programs that encourage adults to be physically active during leisure time. BRFSS is a state-based telephone survey of the noninstitutionalized, U.S. civilian, population aged >18 years. Data on leisure-time physical activity were collected every other year from 1994 to 2000; data were collected annually beginning in 2000. Rhode Island did not ask the survey question in 1994. The survey sample sizes ranged from 105,853 in 1994 to 296,971 in 2004 for 50 states and DC. Leisure-time physical inactivity was defined as a "no" response to the survey question, "During the past month, other than your regular job, did you participate in any physical activities or exercise, such as running, calisthenics, golf, gardening, or walking for exercise?" The reference time frame for the wording of this survey question was revised in 2001 to "During the past 30 days" and was changed back to "During the past month" in 2002. Also, in 2001, the phrase "other than your regular job" was added. Prevalence estimates by sex, age, and race/ethnicity for 50 states and DC were weighted to account for nonresponse and to represent the populations of states/areas included in the study. Sex and race/ethnicity estimates were age-adjusted to the 2000 U.S. population, and testing for trend was conducted for men and women for each age category. Statistical analysis software was used to account for the complex sampling design. The median CASRO response rate was 69.9% in 1994 and 52.8% in 2004. Overall, the prevalence of leisure-time physical inactivity declined significantly, from 29.8% in 1994 to 23.7% in 2004 (p<0.001). The proportions of physical inactivity among men and women were highest in 1994 (men, 27.9%; women, 31.5%) and decreased through 2004 (men, 21.4%; women, 25.9%) (Table). The largest decline was among men aged 50--59 years (from 33.5% to 23.5%) and among women aged 60--69 years (from 37.8% to 28.5%). Among racial/ethnic groups, during 1994--2004, prevalence of leisure-time physical inactivity was lowest among non-Hispanic white men and decreased from 26.4% to 18.4%. Among non-Hispanic black men, the prevalence of physical inactivity decreased from 34.2% in 1994 to 27.0% in 2004. Among Hispanic men, the prevalence of leisure-time inactivity decreased from 37.5% in 1994 to 32.5% in 2004. Non-Hispanic black women (45.7% in 1994 to 33.9% in 2004) and Hispanic women (44.8% in 1994 to 39.6% in 2004) had higher prevalences than non-Hispanic white women (28.3% in 1994 to 21.6% in 2004). Among men, the prevalence of leisure-time physical inactivity declined significantly for each age group (test for trend [p<0.001]) (Figure 1). In 2004, the highest prevalence of physical inactivity among men was among those aged >70 years (27.9%), and the lowest was among those aged 18--29 years (16.4%). For women in every age group, the prevalence of leisure-time physical inactivity also declined significantly (test for trend p<0.001) (Figure 2) from 1996 to 2004. Women aged >70 years had the highest prevalence of physical inactivity. Reported by: J Kruger, PhD, SA Ham, MS, HW Kohl III, PhD, Div of Nutrition and Physical Activity, National Center for Chronic Disease Prevention and Health Promotion, CDC. Editorial Note:This report summarizes the first prevalence estimates for leisure-time physical inactivity for all 50 states and DC using 11 years of state-based data. Reducing the percentage of adults who engage in no leisure-time physical activity to 20% is a Healthy People 2010 objective (no. 22.1). The findings in this report demonstrate that the nationwide prevalence of leisure-time physical inactivity for U.S. adults has declined an average of 0.6% per year during an 11-year period. In 2004, approximately 21% of men and 26% of women reported no leisure-time physical activity, which is the lowest reported prevalence in the past decade. In 2004, men aged 18--29 years and men aged 30--39 years were the only groups for which the national health objective was achieved. The results are consistent with reports indicating that inactivity in adults declined from 1997 to 2002 (3). Findings from this report also update previous analyses that used BRFSS data from 1990--1998 for 43 states and DC (4) and from 1996--2002 for 35 states and DC (5). No other measure of physical activity (e.g., regular moderate or vigorous physical activity) has exhibited such improvements (3). These findings provide evidence that leisure-time physical inactivity is declining in every age group and among both men and women. Although the trends indicate improvement, more than 30% of older adults aged >70 years are inactive. Because inactive older adults are at increased risk for disability, loss of muscle mass, flexibility, and balance and suffer more serious consequences from falling (6), public health messages should continue to focus on older adults to heighten awareness of physical activity opportunities. Trends in leisure-time physical inactivity for racial/ethnic groups indicated improvements among both non-Hispanic whites and non-Hispanic blacks during the 11 years examined in the study. Asians/Pacific Islanders, American Indians/Alaska Natives, and other multiracial groups did not have sufficient sample sizes to assess trends. An overarching goal of Healthy People 2010 is to reduce health disparities between racial/ethnic groups. Efforts to address racial/ethnic disparities can be bolstered by studies of correlates of physical inactivity behaviors in disparate groups. Community programs that provide accessible facilities, transportation options, culturally sensitive activities, and a multilingual staff might encourage physical activity in certain racial/ethnic populations. Further investigation into attitudes toward and barriers to physical activity might enhance programs for promoting physical activity among racial/ethnic minority populations. The Community Guide to Preventive Services recommends six evidence-based strategies to increase physical activity: communitywide campaigns, signage to encourage stair use near elevators and escalators, individually adapted health-behavior change programs, school physical education, social support interventions in community settings, and creation of or enhanced access to places for physical activity combined with informational outreach activities (7). This report identifies segments of the U.S population for whom those recommended interventions might be targeted, including Hispanics and older adults. The findings of this report are subject to at least four limitations. First, BRFSS is a telephone survey and, as such, the data are self-reported, subject to both recall and social desirability bias, and are provided only by those with landline telephones. Second, small sample sizes and ethnic heterogeneity among the majority of racial/ethnic minority populations might lead to substantial variability in estimates and imprecise trends in these populations. Third, Rhode Island did not ask the physical activity survey question in 1994 and therefore was not included in this study for that year. However, exclusion of Rhode Island from all years did not change the prevalences. Finally, these data are limited by potential nonresponse-related errors, particularly because the response rate declined over time. Although the decline in leisure-time physical inactivity is a positive trend, 11-year--trend data also indicate that a substantial proportion of U.S. adults remain physically inactive; nearly one in four adults reported no leisure-time physical activity in 2004. CDC and the American College of Sports Medicine recommend that every adult participate in at least 30 minutes of moderate-intensity physical activity (e.g., brisk walking) on most, and preferably all, days of the week (8). Regular physical activity can provide important health benefits, even when initiated later in life (9). CDC coordinates multiple initiatives at state and local levels to promote physical activity, including Steps to a HealthierUS and various programs focusing on obesity prevention. Public health agencies should continue to encourage adults to meet physical activity recommendations by increasing opportunities and motivation for physical activity. References
|
Use of trade names and commercial sources is for identification only and does not imply endorsement by the U.S. Department of
Health and Human Services. |
Disclaimer All MMWR HTML versions of articles are electronic conversions from ASCII text into HTML. This conversion may have resulted in character translation or format errors in the HTML version. Users should not rely on this HTML document, but are referred to the electronic PDF version and/or the original MMWR paper copy for the official text, figures, and tables. An original paper copy of this issue can be obtained from the Superintendent of Documents, U.S. Government Printing Office (GPO), Washington, DC 20402-9371; telephone: (202) 512-1800. Contact GPO for current prices.
**Questions or messages regarding errors in formatting should be addressed to mmwrq@cdc.gov.Date last reviewed: 10/5/2005
|
|
|||||
|
HOME |
ABOUT MMWR |
MMWR SEARCH |
DOWNLOADS |
RSS
|
CONTACT
|
|||||
|
|
|||||
|