
Persons using assistive technology might not be able to fully access information in this file. For assistance, please send e-mail to: mmwrq@cdc.gov. Type 508 Accommodation and the title of the report in the subject line of e-mail.
Perceived Insufficient Rest or Sleep Among Adults --- United States, 2008
The importance of chronic sleep insufficiency is under-recognized as a public health problem, despite being associated with numerous physical and mental health problems, injury, loss of productivity, and mortality (1,2). Approximately 29% of U.S. adults report sleeping <7 hours per night (3) and 50--70 million have chronic sleep and wakefulness disorders (1). A CDC analysis of 2006 data from the Behavioral Risk Factor Surveillance System (BRFSS) in four states showed that an estimated 10.1% of adults reported receiving insufficient rest or sleep on all days during the preceding 30 days (4). To examine the prevalence of insufficient rest or sleep in all states, CDC analyzed BRFSS data for all 50 states, the District of Columbia (DC), and three U.S. territories (Guam, Puerto Rico, and U.S. Virgin Islands) in 2008. This report summarizes the results, which showed that among 403,981 respondents, 30.7% reported no days of insufficient rest or sleep and 11.1% reported insufficient rest or sleep every day during the preceding 30 days. Females (12.4%) were more likely than males (9.9%) and non-Hispanic blacks (13.3%) were more likely than other racial/ethnic groups to report insufficient rest or sleep. State estimates of 30 days of insufficient rest or sleep ranged from 7.4% in North Dakota to 19.3% in West Virginia. Health-care providers should consider adding an assessment of chronic rest or sleep insufficiency to routine office visits so they can make needed interventions or referrals to sleep specialists.
BRFSS* is a state-based, random-digit--dialed telephone survey of the noninstitutionalized U.S. civilian population aged ≥18 years, which is conducted by state health departments in collaboration with CDC (5). In 2008, response rates† among all 50 states, DC, and territories ranged from 35.8% to 65.9% (median: 53.3%), based on Council of American Survey and Research Organizations (CASRO) guidelines. Cooperation rates§ ranged from 59.3% to 87.8% (median: 75.0%).
The 2008 survey included the question, "During the past 30 days, for about how many days have you felt you did not get enough rest or sleep?" Data from all sites were aggregated, and the numbers of days of perceived insufficient rest or sleep were categorized as zero days, 1--13 days, 14--29 days, and 30 days. Analyses were stratified by age group, race/ethnicity, sex, employment status, education level, marital status, and geographic area. Age-adjusted prevalence estimates were obtained and standardized to the projected U.S. 2000 population and 95% confidence intervals were calculated using statistical software to account for the complex sampling design. Age-adjusted estimates account for variations within state populations and permit comparisons between states and the 2006 report (4) examining data from four states. Statistical significance was determined by using t-tests. Unless otherwise indicated, all comparisons mentioned in this report were significant at the p<0.001 level.
Among the 403,981 adult respondents, an estimated 30.7% reported no days of insufficient rest or sleep in the preceding 30 days, 41.3% reported 1--13 days, 16.8% reported 14--29 days, and 11.1% reported 30 days (Table 1). The prevalence of adults reporting no days of insufficient rest or sleep in the preceding 30 days increased with age; persons aged ≥45 years were more likely to report no days than adults aged <45 years. Hispanic (38.8%) and other non-Hispanic racial/ethnic groups (35.4%) were more likely to report no days in comparison with non-Hispanic whites (27.9%) and non-Hispanic blacks (30.4%). Men (33.6%) were more likely to report no days than women (28.1%). Retired persons (43.8%) were most likely to report no days of insufficient rest or sleep in comparison with adults reporting other types of employment status (p=0.003). Those with less than a high school diploma or general education development certificate (GED) (37.9%) also were more likely to report no days of insufficient rest or sleep in comparison with those with a high school diploma or GED (33.8%) or with some college or college degree (28.0%). Finally, reports of no days of insufficient rest or sleep were similar among adults of varying marital status, although never married adults (31.6%) were more likely to report no days than members of an unmarried couple (28.4%; p=0.005).
The percentage of adults reporting insufficient rest or sleep every day during the preceding 30 days generally declined with age (Table 1). The percentage was highest among persons aged 25--34 years (13.8%) and lowest among persons aged ≥65 years (7.4%). Non-Hispanic blacks (13.3%) were significantly more likely than non-Hispanic whites (11.2%) to report 30 days of insufficient rest or sleep. Females were more likely to report 30 days of insufficient rest or sleep than males (12.4% versus 9.9%, respectively). Persons who reported being unable to work (25.8%) and unemployed respondents (13.9%) were significantly more likely to report 30 days of insufficient rest or sleep than respondents who were employed (9.9%), retired (9.5%; p=0.011), or a student or homemaker (11.1%). In comparison with persons with some college education or a college degree (9.6%), insufficient rest or sleep was significantly more likely to be reported by persons with less than a high school education (14.3%) and among those with a high school diploma or GED (13.2%). Compared with married respondents (11.1%), those who were divorced, widowed, or separated were more likely to report insufficient sleep (16.0%). Percentages for never married persons (10.6%) and members of an unmarried couple (12.1%) were similar to those for married adults (11.1%; p=0.139).
The distribution of reported days of insufficient rest or sleep varied among states and territories (Table 2). The lowest age-standardized prevalences of 30 days of insufficient rest or sleep in the preceding 30 days were observed in North Dakota (7.4%), California (8.0%), DC (8.5%), Wisconsin (8.6%), and Oregon (8.8%); the highest were observed in Puerto Rico (14.0%), Oklahoma (14.3%), Kentucky (14.4%), Tennessee (14.8%), and West Virginia (19.3%) (Figure).
Reported by: LR McKnight-Eily, PhD, Y Liu, MPH, GS Perry, DrPH, LR Presley-Cantrell, PhD, TW Strine, MPH, H Lu, MS, JB Croft, PhD, Div of Adult and Community Health, National Center for Chronic Disease Prevention and Health Promotion, CDC.
Editorial Note:
This is the first published report to present state-based estimates of perceived insufficient sleep or rest by adults for the 50 states, DC, and three U.S. territories. The insufficient rest or sleep question was included on the 2008 BRFSS core questionnaire in response to an Institute of Medicine recommendation that CDC expand surveillance of population sleep patterns (1). The analysis presented in this report found that an estimated 11.1% of respondents reported experiencing insufficient rest or sleep every day for the preceding 30 days and 30.7% of respondents reported no days of insufficient sleep or rest, similar to the 10.1% and 29.6%, respectively, reported by adults from four states in 2006 (4). Racial/ethnic and sex differences observed in this 2008 study were not seen in the 2006 data and likely are the result of increased geographic representation in the sample population and a much larger sample size in 2008. However, the 2008 findings are consistent with previous research indicating a higher prevalence of self-reported frequent insufficient rest or sleep by women in comparison with men (6) and disparities in sleep duration reported by non-Hispanic blacks in comparison with whites (7,8).
The high prevalence of insufficient rest or sleep was concentrated in the southeastern United States. The causes of the geographic variations found cannot be determined by this study. However, geographic variations in occupational factors (e.g., shift work opportunities and extended work schedules) and lifestyle choices (e.g., use of technology), and the distribution of related common chronic diseases (e.g., obesity [9], depression, hypertension, heart disease, and stroke), many of which also are concentrated in the Southeast, might play a role and should be examined further (10).
The major causes of sleep loss are overlapping and include lifestyle and occupational factors that reflect broad societal factors (e.g., work hours and access to technology), and specific sleep disorders (1). Further studies are needed to explain the sex and racial/ethnic differences apparent in these results. Women are underrepresented in studies of sleep and sleep disorders (7). Further research also is needed to examine the relationship between sleep during pregnancy and postpartum and sleep-related diseases, such as depression, which are more prevalent in women (7). Racial and ethnic minorities disproportionately report sleep durations that are associated with increased mortality and might contribute to health disparities, and they are overrepresented in low socioeconomic environments that might compromise sleep quality (7). In this analysis, persons unable to work expressed the greatest prevalence of perceived rest or sleep insufficiency, which might be the result of mental distress or medical problems, disabilities, or other conditions that prevent them from being employed.
The findings in this report are subject to at least three limitations. First, the definitions of "enough (sufficient)" sleep and "rest" and responses to the survey question were subjective and were not accompanied by reports of hours of sleep per night; therefore, this analysis cannot be compared directly with studies of sleep duration. Because the survey question also did not distinguish between "rest" and "sleep," respondents might vary in their interpretation of the questions and the terms. Finally, institutionalized persons and persons residing in households without landline telephones are not included in the survey. Therefore, the findings of this report are not generalizable to those populations.
According to the National Sleep Foundation, adults need 7--9 hours of sleep each night. Health-care professionals should evaluate patients who report chronic insufficient rest or sleep and advise them of effective behavioral strategies including keeping a regular sleep schedule; avoiding stimulating activities within 2 hours of bedtime; avoiding caffeine, nicotine, and alcohol in the evening; sleeping in a dark, quiet, well-ventilated space; and avoiding going to bed hungry.¶ Pharmacologic intervention also might be warranted. Although few formal clinical practice guidelines are available for assessing and treating sleep insufficiency and sleeping disorders, a multidisciplinary team, including a sleep specialist, might be required for proper treatment (1).
Acknowledgment
The findings in this report are based, in part, on data provided by BRFSS state coordinators from the 50 United States, DC, Guam, Puerto Rico, and U.S. Virgin Islands.
References
- Institute of Medicine. Sleep disorders and sleep deprivation: an unmet public health problem. Washington, DC: The National Academies Press; 2006.
- Banks S, Dinges DF. Behavioral and physiological consequences of sleep restriction. J Clin Sleep Med 2007;3:519--28.
- Schoenborn CA, Adams PF. Sleep duration as a correlate of smoking, alcohol use, leisure-time physical inactivity, and obesity among adults: United States, 2004--2006. Available at http://www.cdc.gov/nchs/data/hestat/sleep04-06/sleep04-06.pdf. Accessed October 22, 2009.
- CDC. Perceived insufficient rest or sleep---four states, 2006. MMWR 2008;57:200--3.
- CDC. Public health surveillance for behavioral risk factors in a changing environment: recommendations from the Behavioral Risk Factor Surveillance Team. MMWR 2003;52(No. RR-9).
- Strine TW, Chapman DP. Associations of frequent sleep insufficiency with health-related quality of life and health behaviors. Sleep Med 2005;6:23--7.
- National Center on Sleep Disorders Research. 2003 National Sleep Disorders Research Plan. Bethesda, MD: US Department of Health and Human Services, National Center on Sleep Disorders Research; 2003. Available at http://www.nhlbi.nih.gov/health/prof/sleep/res_plan/sleep-rplan.pdf. Accessed October 28, 2009.
- Hale L, Do DP. Racial differences in self-reports of sleep duration in a population-based study. Sleep 2007;30:1096--103.
- CDC. State-specific prevalence of obesity among adults---United States, 2005. MMWR 2006;55:985--8.
- DeVol R, Bedroussian A. An unhealthy America: the economic burden of chronic disease. Santa Monica, CA: Milken Institute; 2007.
* Information regarding BRFSS data and methods is available at http://www.cdc.gov/brfss/technical_infodata/surveydata/2005.htm.
† The percentage of persons who completed interviews among all eligible persons, including those who were not successfully contacted.
§ The percentage of persons who completed interviews among all eligible persons who were contacted.
¶ Additional guidance on good sleep practices from the National Sleep Foundation is available at http://www.sleepfoundation.org/article/ask-the-expert/sleep-hygiene.
|
What is already known on this topic? A 2008 MMWR report of perceived insufficient rest or sleep by adults from four states using 2006 Behavioral Risk Factor Surveillance System (BRFSS) data found that 1 in 10 adults reported insufficient rest or sleep every day in the preceding 30 days and 29.6% reported no days of insufficient rest or sleep. What is added by this report? Insufficient rest or sleep prevalence estimates from adults in the 50 United States, the District of Columbia, and three U.S. territories (Guam, Puerto Rico, and U.S. Virgin Islands) from the 2008 BRFSS substantiate previous findings, add support for sex and race/ethnicity differences, and characterize geographic variations in the state-based reports of rest or sleep insufficiency. What are the implications for public health practice? Health-care providers should consider adding an assessment of chronic rest or sleep insufficiency to routine office visits so they can make needed interventions or referrals to sleep specialists. |
FIGURE. Age-adjusted* percentage of adults who reported 30 days of insufficient rest or sleep† during the preceding 30 days --- Behavioral Risk Factor Surveillance System, United States,§ 2008.
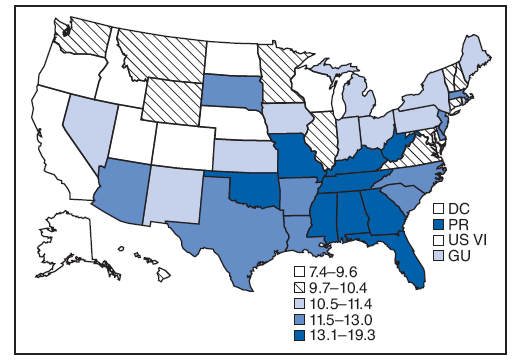
* Age adjusted to 2000 projected U.S. population.
† Determined by response to the question, "During the past 30 days, for about how many days have you felt you did not get enough rest or sleep?"
§ Includes the 50 states, District of Columbia, Guam, Puerto Rico, and U.S. Virgin Islands.
Alternative Text: The figure above shows the age-adjusted percentage of adults who reported 30 days of insufficient rest or sleep during the preceding 30 days in the United States in 2008. The lowest age-standardized prevalences of 30 days of insufficient rest or sleep in the preceding 30 days were observed in North Dakota (7.4%), California (8.0%), District of Columbia (8.5%), Wisconsin (8.6%), and Oregon (8.8%); the highest were observed in Puerto Rico (14.0%), Oklahoma (14.3%), Kentucky (14.4%), Tennessee (14.8%), and West Virginia (19.3%).
Use of trade names and commercial sources is for identification only and does not imply endorsement by the U.S. Department of
Health and Human Services. |
All MMWR HTML versions of articles are electronic conversions from typeset documents. This conversion might result in character translation or format errors in the HTML version. Users are referred to the electronic PDF version (http://www.cdc.gov/mmwr) and/or the original MMWR paper copy for printable versions of official text, figures, and tables. An original paper copy of this issue can be obtained from the Superintendent of Documents, U.S. Government Printing Office (GPO), Washington, DC 20402-9371; telephone: (202) 512-1800. Contact GPO for current prices.
**Questions or messages regarding errors in formatting should be addressed to mmwrq@cdc.gov.Date last reviewed: 10/29/2009